Efficient customer support is critical for maintaining satisfaction, loyalty, and business growth. The Customer Support Dashboard in Excel is a ready-to-use solution that allows support teams and managers to monitor ticket performance, agent efficiency, and customer feedback in one consolidated view.
In this article, we will explain the features, advantages, and best practices for using this dashboard to enhance your support operations.
What Is a Customer Support Dashboard?
A Customer Support Dashboard is a visual reporting tool that consolidates key support metrics, providing insights into ticket resolution, response times, agent performance, and customer satisfaction.
With this Excel-based dashboard, support managers can:
-
Track ticket volume, priority, and category trends
-
Analyze agent performance and workload
-
Monitor response and resolution times
-
Measure customer feedback and satisfaction
-
Identify escalation patterns and bottlenecks
Key Features of the Customer Support Dashboard
Click to Buy Customer Support Dashboard in Excel
This dashboard contains multiple sheet tabs, each serving a specific purpose:
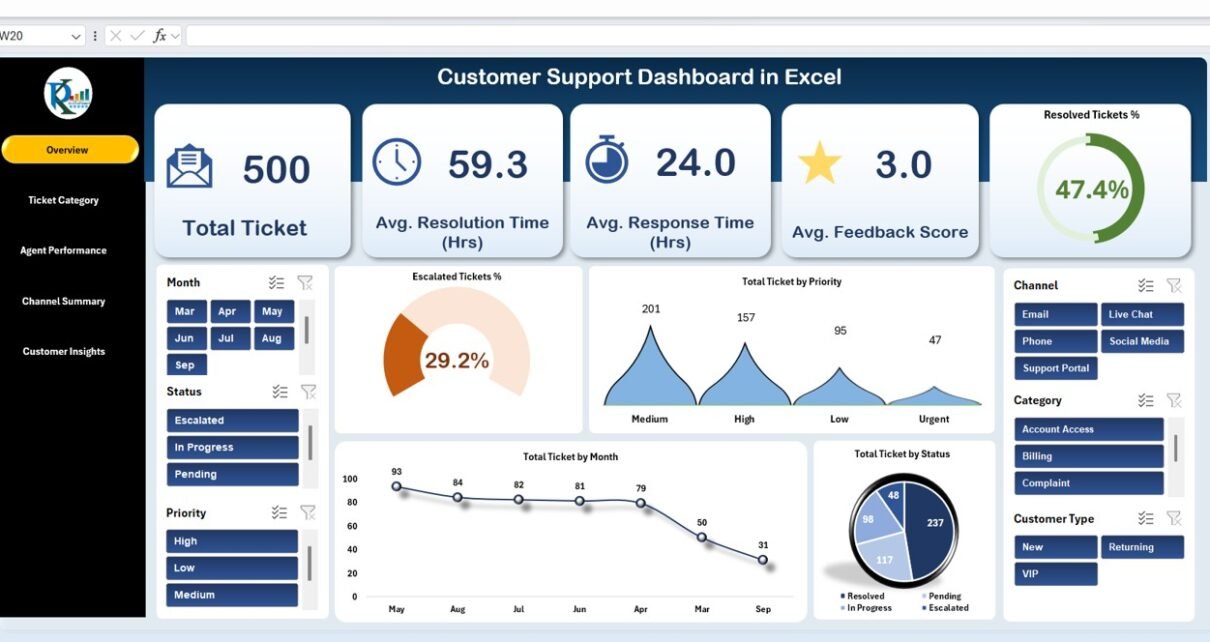
1. Overview Sheet Tab
The Overview sheet provides a high-level snapshot of support metrics.
Cards:
-
Total Ticket: Total number of tickets received
-
Avg. Resolution Time (Hrs): Average time to resolve tickets
-
Avg. Response Time (Hrs): Average first response time
-
Avg. Feedback Score: Overall customer feedback rating
-
Resolved Tickets %: Percentage of tickets resolved
Charts:
-
Escalated Tickets %: Visual representation of escalated tickets
-
Total Ticket by Priority: Number of tickets by priority level
-
Total Ticket by Month: Monthly ticket trends
-
Total Ticket by Status: Breakdown of ticket status (Open, Closed, Escalated)

Click to Buy Customer Support Dashboard in Excel
2. Ticket Category Analysis Sheet Tab
This sheet focuses on ticket types and categories to identify trends and pain points.
Charts:
-
Total Ticket by Category: Tickets grouped by category
-
Avg. Resolution Time by Category: Average resolution duration per category
-
Tickets by Category and Priority: Combined view of category and priority
-
Avg. Feedback Score by Category: Customer feedback by ticket type
-
Avg. Response Time by Category: Response time across categories

Click to Buy Customer Support Dashboard in Excel
3. Agent Performance Sheet Tab
The Agent Performance sheet evaluates individual support team members.
Charts:
-
Total Ticket by Assigned Agent: Tickets handled by each agent
-
Open or Escalated Tickets by Assigned Agent: Tickets still pending per agent
-
Avg. Feedback Score by Assigned Agent: Customer satisfaction per agent
-
Escalated Tickets % by Assigned Agent: Percentage of escalations per agent
-
Avg. Resolution Time by Assigned Agent: Average time taken to resolve tickets
This sheet helps managers identify top performers and provide coaching where necessary.

Click to Buy Customer Support Dashboard in Excel
4. Channel Summary Sheet Tab
The Channel Summary sheet analyzes ticket performance across different support channels.
Charts:
-
Total Ticket by Channel: Number of tickets per communication channel (Email, Chat, Phone, etc.)
-
Resolved Tickets vs Open or Escalated Tickets by Channel: Track efficiency per channel
-
Avg. Feedback Score by Channel: Customer satisfaction per channel
-
Resolved Tickets % by Channel: Resolution rate per channel
-
Avg. Resolution Time by Channel: Average resolution time by channel

5. Customer Insights Sheet Tab
The Customer Insights sheet provides metrics related to customer types and behavior.
Charts:
-
Avg. Feedback Score by Customer Type: Feedback segmented by customer type
-
Avg. Response Time by Customer Type: Response time by customer type
-
Open or Escalated Tickets vs Resolved Tickets by Customer Type: Ticket status overview
-
Total Ticket by Customer Type: Total tickets submitted by different customer groups

Click to Buy Customer Support Dashboard in Excel
6. Data Sheet Tab
The Data sheet serves as the input sheet for all ticket information.
-
Each ticket record includes details such as ticket ID, category, priority, status, assigned agent, response time, resolution time, channel, customer type, and feedback score
-
Updating this sheet automatically refreshes all dashboards and visualizations
This ensures accurate reporting and allows managers to make data-driven decisions.
Advantages of Using the Customer Support Dashboard
Click to Buy Customer Support Dashboard in Excel
-
Centralized Insights: Consolidates all support metrics in one place
-
Agent Performance Monitoring: Identify high-performing and underperforming agents
-
Customer Satisfaction Tracking: Monitor feedback and satisfaction trends
-
Trend Analysis: Track ticket volume, escalations, and response times over time
-
Channel Optimization: Analyze which support channels are most effective
-
Data-Driven Decision Making: Provides actionable insights to improve support operations
Best Practices for Using the Dashboard
-
Regularly Update Data: Enter all ticket information promptly for accurate insights
-
Segment Analysis: Use filters by agent, channel, or category to identify trends
-
Monitor Key Metrics: Focus on resolution time, response time, and feedback scores
-
Track Escalations: Identify causes of escalated tickets to reduce recurrence
-
Review Monthly and Quarterly Trends: Use trend charts to adjust resource allocation
-
Customize Metrics: Add or modify KPIs to fit your support team’s goals
How This Dashboard Helps Customer Support Teams
Click to Buy Customer Support Dashboard in Excel
-
Improve Response Times: Quickly identify bottlenecks in ticket handling
-
Enhance Customer Satisfaction: Monitor feedback scores and resolve issues faster
-
Optimize Resources: Assign tickets effectively to balance agent workload
-
Track Performance: Measure success at the team, channel, and individual level
-
Support Decision Making: Use visual insights to implement process improvements
Frequently Asked Questions (FAQs)
Q1: Can I customize this dashboard for my support team?
Yes, you can add or remove KPIs, channels, or categories to match your organization’s needs.
Q2: How often should data be updated?
Ideally, update data daily or weekly to ensure accurate dashboard reporting.
Q3: Can I analyze agent performance by channel?
Yes, the Agent Performance and Channel Summary sheets allow combined analysis.
Q4: Can this dashboard track customer satisfaction trends?
Yes, feedback scores are tracked across categories, agents, channels, and customer types.
Q5: Is this dashboard suitable for large support teams?
Absolutely. The dashboard can handle a large volume of tickets efficiently using structured data and pivot tables.
Conclusion
Click to Buy Customer Support Dashboard in Excel
The Customer Support Dashboard in Excel is an essential tool for monitoring, analyzing, and improving customer support operations. With cards, charts, and structured data input, support managers can track ticket trends, agent performance, and customer satisfaction, enabling faster responses and better decision-making.
Visit our YouTube channel to learn step-by-step video tutorials
Watch the step-by-step video Demo:
Click to Buy Customer Support Dashboard in Excel