Corporate Social Responsibility (CSR) has become one of the most important areas for organizations across the globe. Businesses are not only judged by their profits but also by how they contribute to society, support communities, and protect the environment. While most companies prepare annual CSR reports in PDF or printed formats, many struggle with tracking, analyzing, and visualizing CSR performance throughout the year.
This is where a Corporate Social Responsibility Report in Excel becomes an essential tool. With a ready-to-use template, companies can track CSR activities, monitor budgets, evaluate beneficiaries, and generate professional reports without expensive software.
In this article, we will explore everything you need to know about CSR reports in Excel—its structure, features, advantages, best practices, real-world use cases, and answers to frequently asked questions.
Click to Purchases Corporate Social Responsibility Report in Excel
What Is a Corporate Social Responsibility Report in Excel?
A Corporate Social Responsibility (CSR) Report in Excel is a digital reporting tool designed to track and analyze CSR initiatives in an interactive and structured way. Unlike traditional CSR reports, which are often static documents, Excel-based CSR reports allow users to:
-
Consolidate CSR program data in one place.
-
Track actual spending versus budget allocations.
-
Measure the number of beneficiaries reached.
-
Visualize data using charts, cards, and slicers.
-
Compare results across departments, programs, and regions.
This Excel template provides dynamic dashboards that automatically update when you enter new data. As a result, managers and CSR officers gain real-time insights to improve decision-making.
Key Features of the Corporate Social Responsibility Report
This ready-to-use Excel CSR report template comes with three main pages and a support sheet. Each section is designed to provide specific insights for CSR managers and stakeholders.
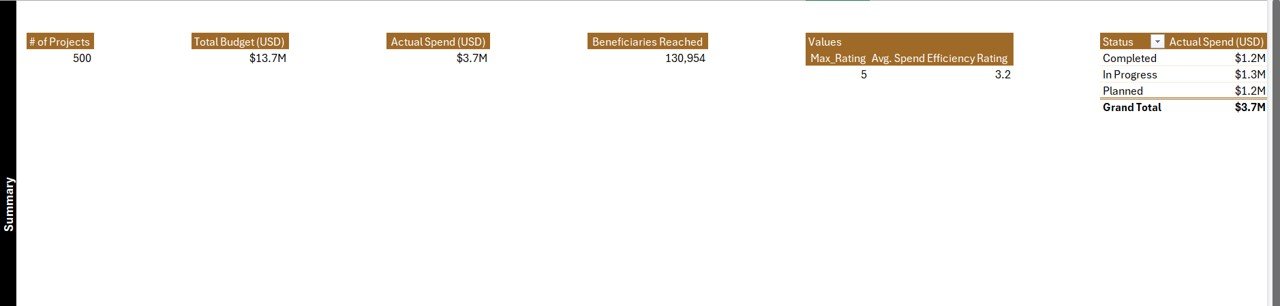
Summary Page
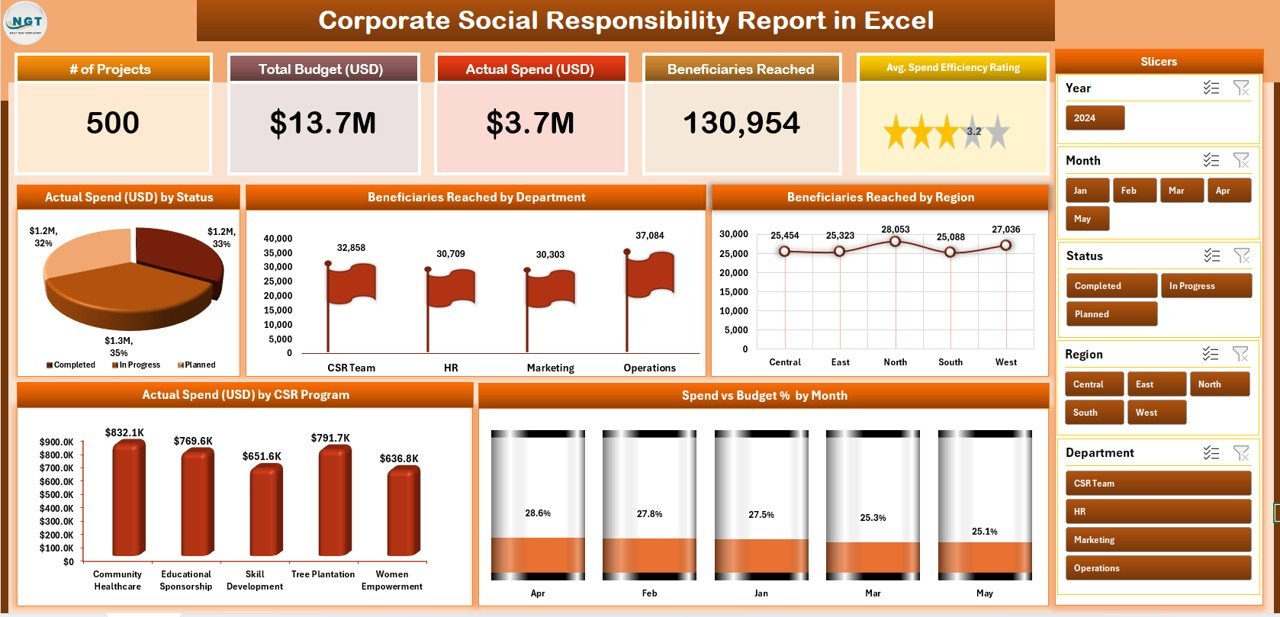
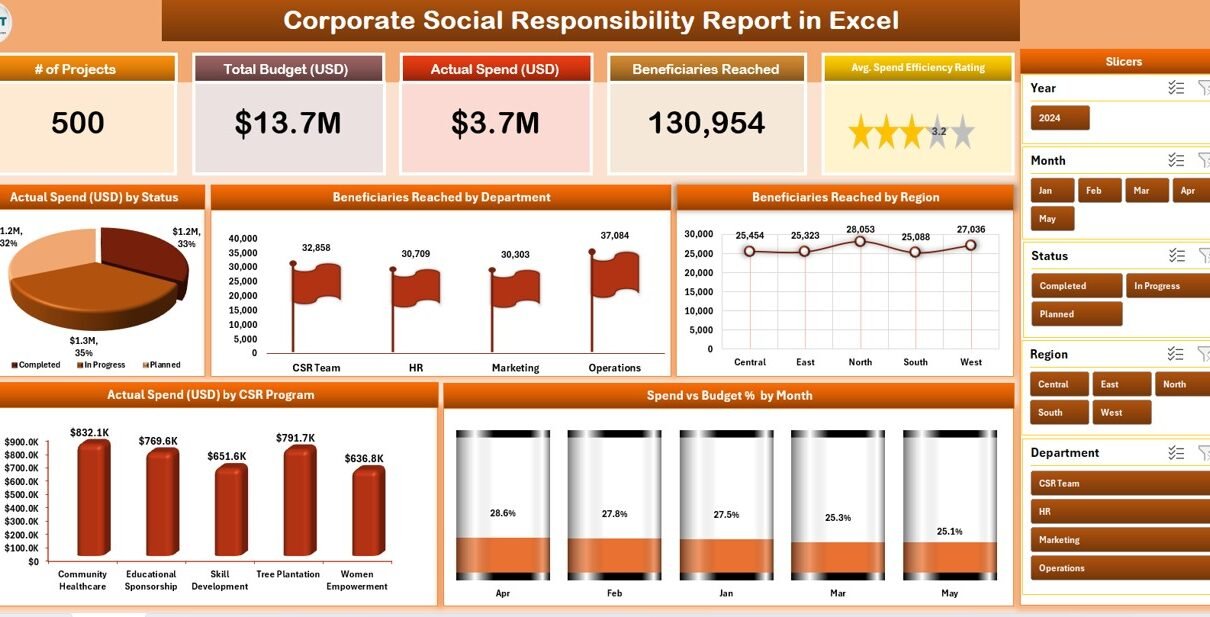
The Summary Page is the heart of the CSR Report. It provides a high-level overview with the following elements:
-
Top 5 KPI Cards – Quick metrics such as total spend, total beneficiaries, active programs, completed projects, and spend efficiency.
-
Right-Side Slicer – Filter data by program, department, or region.
Charts and Visuals:
- Actual Spend (USD) by Status – Displays budget allocation and usage.
- Beneficiaries Reached by Department – Shows which departments impact the most lives.
- Beneficiaries Reached by Region – Tracks geographic coverage.
- Actual Spend (USD) by CSR Program – Breaks down spending per program.
- Spend Vs. Budget % by Month – Monthly performance analysis.
This page acts as a dashboard for senior management to quickly evaluate CSR performance.
Report Page
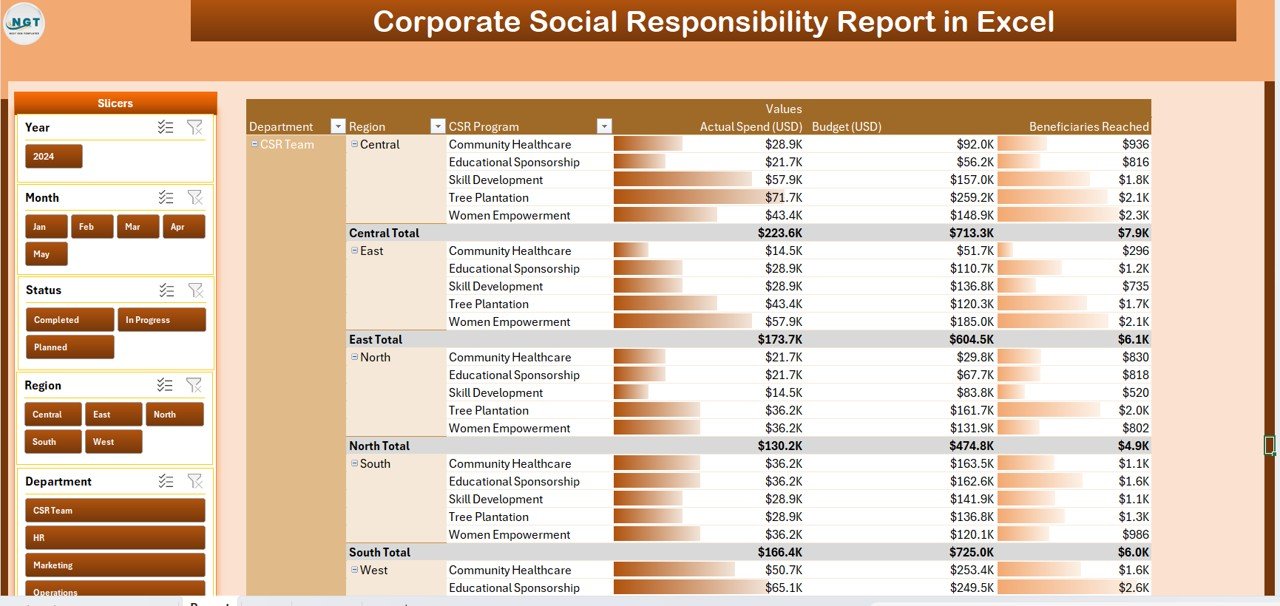
The Report Page provides more detailed insights and tabular information.
-
Left-Side Slicer – Select department, program, or region to filter the report.
Information Table – Displays detailed records of CSR programs including:
Click to Purchases Corporate Social Responsibility Report in Excel
- Project name
- Department
- Region
- Budget
- Actual spend
- Beneficiaries
- Status
This page is extremely helpful for CSR teams preparing quarterly or annual board presentations.
Data Sheet
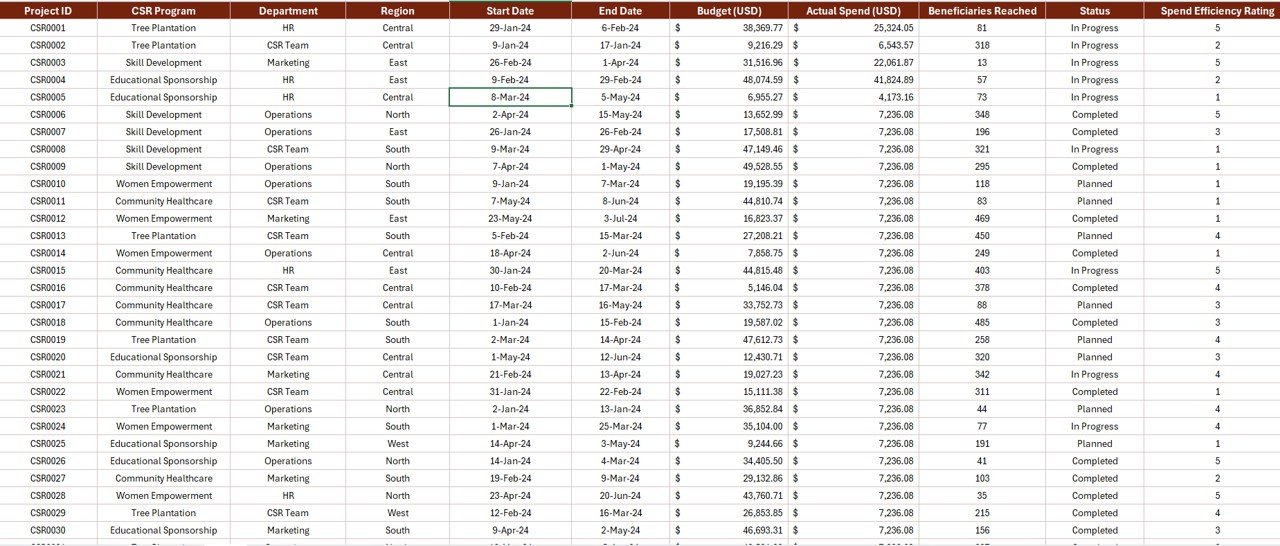
The Data Sheet is the backbone of the report. It contains the raw data that powers the Summary and Report pages.
Typical columns include:
-
Project ID
-
Program Name
-
Department
-
Region
-
Budget
-
Actual Spend
-
Number of Beneficiaries
-
Status (Planned, In-progress, Completed)
-
Month/Year
By keeping this sheet structured, the entire dashboard remains accurate and reliable.
Support Sheet
The Support Sheet contains lists and reference data used in drop-down menus and slicers.
For example:
-
Department names
-
Program types
-
Status categories
-
Regions
This ensures data consistency and prevents errors during data entry.
Why Should Companies Use a CSR Report in Excel?
Many organizations still rely on manual reporting, which often leads to inefficiencies. A CSR report in Excel solves these issues by providing a centralized, automated, and visualized system.
Here are the reasons why companies should adopt it:
-
Real-time performance tracking
-
Data-driven insights for decision-making
-
Easy-to-use format without expensive software
-
Professional and board-ready presentations
-
Flexibility to customize metrics and visuals
Advantages of a Corporate Social Responsibility Report in Excel
Using an Excel-based CSR report offers several advantages:
1. Centralized Data Management
All CSR-related data stays in one file, making it easier to track and update.
2. Improved Decision-Making
Charts, KPIs, and slicers provide actionable insights to management.
3. Cost-Effective Solution
No need for complex BI tools—Excel provides everything required for reporting.
4. User-Friendly Interface
Drop-downs, slicers, and dashboards make it easy for non-technical users.
5. Customizable
Organizations can easily add new programs, KPIs, or regions based on requirements.
6. Better Compliance Reporting
CSR reports often need submission to government authorities. This template ensures compliance with minimal effort.
How to Use the Corporate Social Responsibility Report Template
Here is a step-by-step guide to using this Excel CSR Report:
-
Enter Data in the Data Sheet
-
Fill in all project details such as program, department, budget, and spend.
-
-
Maintain the Support Sheet
-
Update lists like departments, programs, and regions as needed.
-
-
Review the Report Page
-
Use slicers to filter data and check detailed information.
-
-
Analyze the Summary Page
-
Review charts and KPI cards to measure performance at a glance.
-
-
Share with Stakeholders
-
Export the Summary Page as a PDF for board meetings or public reports.
-
Best Practices for a Corporate Social Responsibility Report in Excel
To maximize efficiency and accuracy, follow these best practices:
✅ Keep data structured – Avoid blank rows or inconsistent formats.
✅ Use standard units – Always enter spend in the same currency.
✅ Regularly update the Data Sheet – Input monthly or quarterly updates to keep the report current.
✅ Automate where possible – Use formulas and pivot tables to reduce manual work.
✅ Validate entries – Use data validation to prevent incorrect inputs.
✅ Secure the file – Lock important sheets to prevent accidental changes.
✅ Create backups – Maintain historical versions for compliance.
Opportunities for Improvement
Click to Purchases Corporate Social Responsibility Report in Excel
While Excel provides a robust framework, organizations can improve further:
🌍 Integrate with Power BI for advanced visualizations.
⏱ Automate data collection using macros or VBA scripts.
🔄 Link with HR or Finance systems for real-time updates.
📊 Add more KPIs like ROI of CSR activities, satisfaction scores, or long-term impact.
☁️ Move to cloud-based platforms like SharePoint or Google Sheets for collaboration.
Real-World Applications of CSR Reports in Excel
Companies across industries can use this template:
-
Manufacturing Companies – To track community welfare and environmental initiatives.
-
IT and Software Firms – To manage CSR programs like digital literacy or scholarships.
-
Banks and Financial Institutions – To report on financial inclusion and rural development projects.
-
Healthcare Organizations – To track medical camps, vaccinations, and awareness drives.
-
Educational Institutions – To manage CSR-driven scholarships and training programs.
Conclusion
A Corporate Social Responsibility Report in Excel provides a simple yet powerful way to track and manage CSR initiatives. It offers centralized reporting, visual dashboards, and easy customization—making it the perfect solution for companies of all sizes.
By adopting this template, organizations can improve transparency, demonstrate accountability, and showcase their positive contributions to society in a structured and measurable way.
Frequently Asked Questions (FAQs)
1. What is a Corporate Social Responsibility Report?
A CSR report is a document that outlines a company’s initiatives, spending, and outcomes related to social, environmental, and community development activities.
2. Why should I use Excel for CSR reporting?
Excel provides a cost-effective, flexible, and easy-to-use platform for tracking CSR data with dashboards and visuals.
3. Can I customize the CSR Report template?
Yes, you can add new KPIs, departments, or regions as per your organization’s needs.
4. Is this template suitable for small businesses?
Absolutely! Small businesses can track CSR activities without investing in complex reporting software.
5. Can I share the report with stakeholders?
Yes, you can export the summary page to PDF or share the Excel file directly.
6. How often should I update the CSR report?
Ideally, update it monthly or quarterly to ensure data accuracy and timely insights.
7. Can this report be integrated with Power BI?
Yes, the structured Excel data can be easily imported into Power BI for advanced analytics.
Visit our YouTube channel to learn step-by-step video tutorials