In today’s fast-paced business environment, teamwork is at the center of success. Companies rely on teams to deliver results, meet project deadlines, and achieve organizational goals. However, without a proper way to measure and track team performance, it becomes difficult to understand productivity, efficiency, and overall contribution.
This is where a Team Performance Report in Excel becomes highly valuable. Excel remains one of the most widely used tools for performance reporting due to its flexibility, accessibility, and ability to handle complex data in a simple way. A well-structured performance report provides managers and team leaders with actionable insights that help them make better decisions, recognize achievements, and identify areas for improvement.
In this article, we will explore everything about a Team Performance Report in Excel—its structure, features, advantages, best practices, and frequently asked questions.
What Is a Team Performance Report in Excel?
A Team Performance Report in Excel is a structured template that tracks key performance indicators (KPIs) of teams within an organization. It consolidates tasks, hours, ratings, and progress into one centralized file that can be easily updated and analyzed.
Instead of reviewing multiple reports or scattered spreadsheets, managers can rely on a single Excel report to:
-
Monitor completed and pending tasks.
-
Compare planned versus actual hours.
-
Evaluate performance ratings across individuals or departments.
-
Visualize data through charts, slicers, and dashboards.
The goal of this report is not only to measure results but also to provide a clear view of trends, patterns, and areas where team performance can be optimized.
Key Features of the Team Performance Report
The ready-to-use Team Performance Report in Excel typically contains multiple pages, each serving a specific purpose. Below are the important features included in the template.
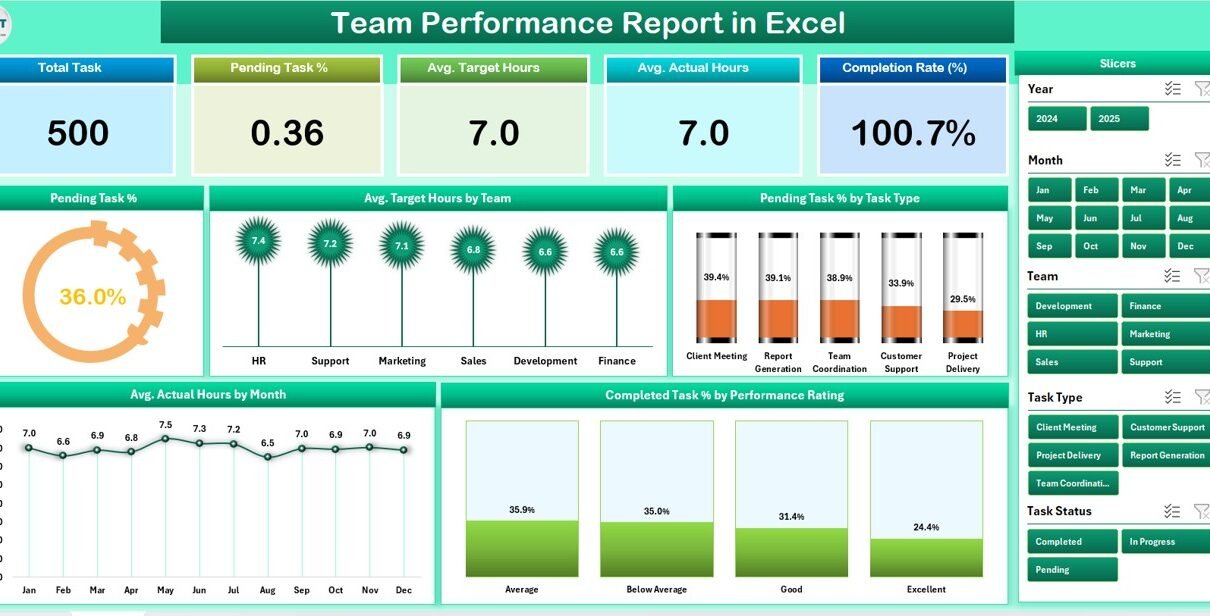
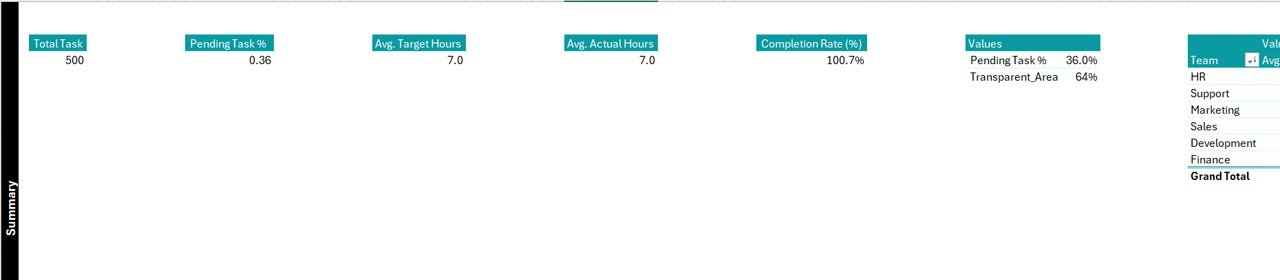
Summary Page
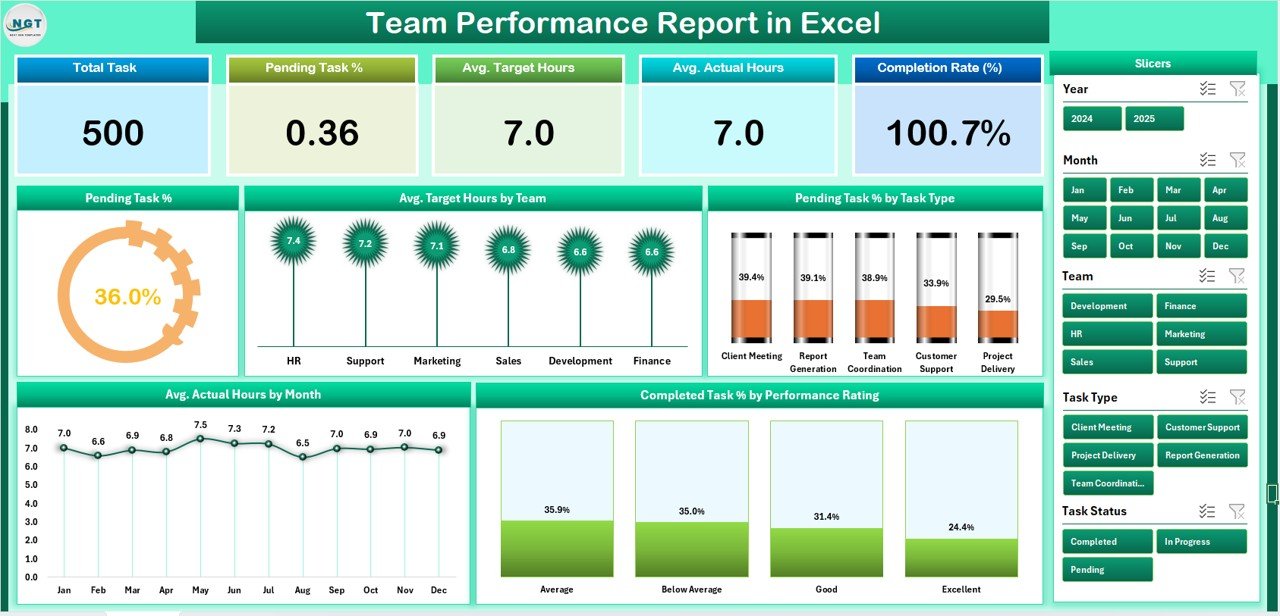
The Summary Page acts as the main dashboard of the report. It brings together essential KPIs and visuals in one place.
-
Top 5 Cards: Quick overview of the most important metrics such as total tasks, completed tasks, pending tasks, average hours, and overall performance rating.
-
Right-Side Slicer: Allows users to filter data by team, department, month, or task type for customized reporting.
Charts:
- Pending Task %: Shows the percentage of tasks still open.
- Average Target Hours by Team: Compares planned work hours across teams.
- Pending Task % by Task Type: Breaks down workload by type of task.
- Average Actual Hours by Month: Tracks how actual working hours evolve month by month.
- Completed Task % by Performance Rating: Measures quality of work based on ratings.
This page provides managers with a snapshot of overall performance at a glance.
Report Page
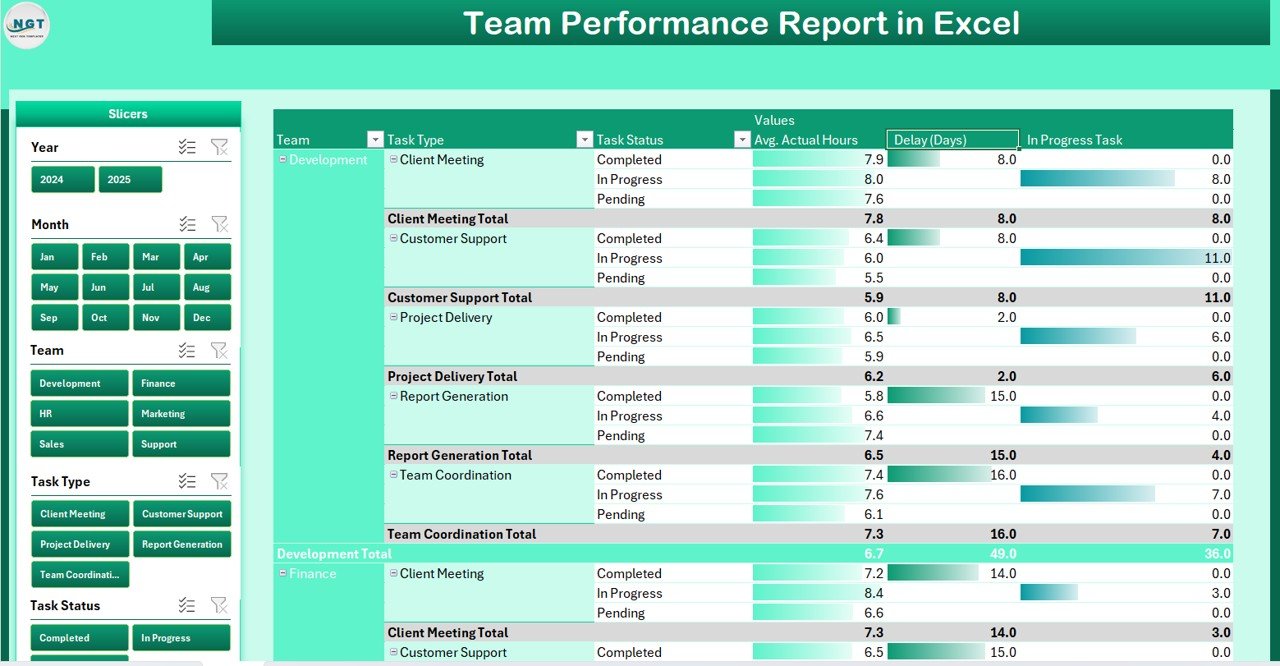
The Report Page contains more detailed information for in-depth analysis.
-
Left-Side Slicer: Filters data based on parameters such as project, department, or time period.
-
Information Table: Displays detailed performance data for each team member or task. This may include fields such as employee name, task description, target hours, actual hours, and completion status.
This page is useful for supervisors and HR professionals who need to drill down into specific details.
Data Sheet
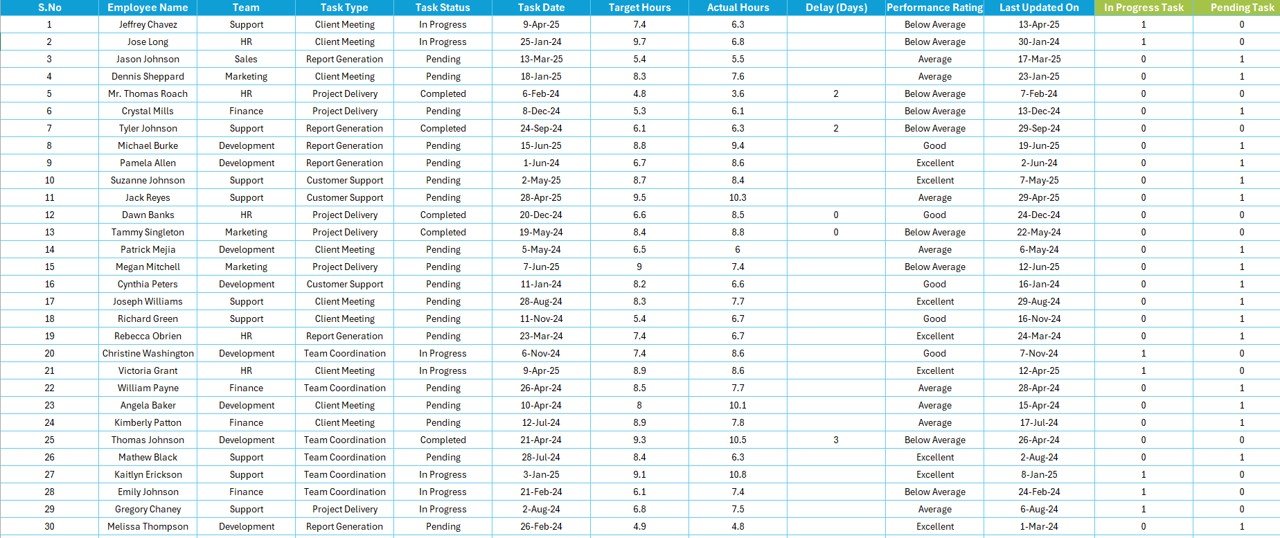
The Data Sheet acts as the backbone of the report.
-
Stores raw data such as task lists, assigned hours, completion status, and ratings.
-
Provides input for charts, tables, and calculations.
-
Designed in a clean, structured way to make updating easy.
Support Sheet
The Support Sheet contains reference data, drop-down lists, and supporting calculations.
-
Ensures consistency across the report.
-
Provides a controlled way to manage lists such as task types, performance categories, and department names.
-
Simplifies report customization for different organizations.
Why Do You Need a Team Performance Report in Excel?
Many organizations struggle to track team efficiency and productivity. A Team Performance Report in Excel helps overcome this challenge by offering:
-
Transparency: Everyone can see progress and identify delays.
-
Accountability: Assignments and results are clearly documented.
-
Decision-Making Support: Managers can make informed choices about workload distribution.
-
Employee Motivation: Recognizing high performers encourages a culture of achievement.
-
Efficiency Improvement: Identifying gaps helps teams improve their processes.
Advantages of a Team Performance Report in Excel
Creating a Team Performance Report in Excel offers several benefits:
✅ User-Friendly: Excel is easy to use and widely available.
✅ Customizable: Reports can be tailored to any industry or department.
✅ Cost-Effective: No need for expensive software licenses.
✅ Data Visualization: Charts and slicers make performance tracking engaging and insightful.
✅ Flexibility: Suitable for both small and large organizations.
✅ Real-Time Updates: Teams can update the data instantly for accurate reporting.
✅ Collaboration Ready: Reports can be shared across teams or departments.
How to Create a Team Performance Report in Excel
Building a professional performance report requires careful planning. Here are the basic steps:
-
Define Your KPIs: Choose key metrics such as pending tasks, completed tasks, target hours, and ratings.
-
Organize Data Input: Create a structured Data Sheet with columns for task, employee, hours, and completion status.
-
Build Calculations: Use Excel formulas like
SUMIF,AVERAGEIF, andCOUNTIFto calculate KPIs. -
Create Charts: Add bar charts, pie charts, and line charts to visualize data.
-
Design Dashboard: Place charts, cards, and slicers on the Summary Page for easy analysis.
-
Test and Validate: Check that slicers and charts update correctly with new data.
-
Automate Where Possible: Use conditional formatting and pivot tables for dynamic updates.
Best Practices for the Team Performance Report
To ensure your report is effective and professional, follow these best practices:
-
Keep It Simple: Avoid unnecessary complexity—focus on clear KPIs.
-
Use Visuals Wisely: Limit charts to meaningful comparisons.
-
Automate Updates: Use pivot tables and slicers for faster analysis.
-
Maintain Data Integrity: Ensure the Data Sheet remains structured and error-free.
-
Regular Updates: Update the report weekly or monthly to keep insights fresh.
-
Highlight Key Insights: Use conditional formatting to draw attention to important metrics.
-
Make It Interactive: Add slicers and filters for dynamic reporting.
Opportunities for Improvement
Even though Excel is a powerful tool, there are always areas to enhance the report:
🔹 Integration with Other Tools: Link data from project management software.
🔹 Automated Data Import: Use Power Query to refresh data automatically.
🔹 Advanced Visualization: Incorporate Power BI for deeper insights.
🔹 Employee Feedback Integration: Add surveys and ratings for 360° performance evaluation.
🔹 Forecasting Features: Use Excel’s forecasting functions to predict future workload and performance.
Conclusion
A Team Performance Report in Excel is not just a reporting tool—it is a strategic resource for organizations. It enables managers to track productivity, evaluate task completion, and improve team efficiency. With features such as summary dashboards, slicers, and detailed reporting pages, it provides a complete view of team activities in one place.
By following best practices and keeping the design simple yet insightful, organizations can make the most out of this ready-to-use template. Whether you are managing a small team or a large department, Excel provides the flexibility and control needed to measure success effectively.
Frequently Asked Questions (FAQs)
1. What is included in a Team Performance Report in Excel?
It includes KPIs, charts, dashboards, slicers, a data sheet, and support sheets for structured performance tracking.
2. Can this report be customized for different teams?
Yes, the template is fully customizable. You can add or remove KPIs, change charts, and adjust slicers to fit your needs.
3. How often should I update the Team Performance Report?
Ideally, update it weekly or monthly, depending on your team’s reporting cycle.
4. What are the main benefits of using Excel for performance reports?
Excel is cost-effective, flexible, easy to use, and provides strong data visualization capabilities.
5. Can I integrate the Excel report with other tools?
Yes. With Power Query or external connectors, you can import data from tools like Trello, Jira, or project management software.
6. Is this report suitable for both small and large teams?
Absolutely. The template works for small groups as well as large organizations, as it can handle large data sets efficiently.
Visit our YouTube channel to learn step-by-step video tutorials