In today’s sustainability-driven world, energy efficiency is more than just a corporate buzzword — it’s a necessity. Organizations across industries aim to reduce costs, improve resource utilization, and minimize environmental impact. To achieve these goals, leaders need real-time visibility into their energy performance metrics. That’s exactly what the Energy Dashboard in Power BI delivers.
This ready-to-use Power BI solution helps businesses track, analyze, and visualize energy data from multiple departments, projects, and regions — all in one unified view.
Click to Purchases Energy Dashboard in Power BI
Let’s explore what makes this dashboard a must-have tool for data-driven energy management.
What Is an Energy Dashboard in Power BI?
An Energy Dashboard in Power BI is an interactive reporting tool that consolidates key performance indicators (KPIs) related to energy consumption, efficiency, and sustainability. It gathers data from various sources — such as Excel sheets, IoT sensors, or ERP systems — and transforms it into meaningful visual insights.
Instead of manually analyzing spreadsheets, this dashboard gives managers a clear snapshot of how energy is being consumed across departments, projects, and regions. It helps identify inefficiencies, track savings, and compare actual vs. budgeted consumption — all with a few clicks.
Structure of the Energy Dashboard in Power BI
This Power BI file is designed with five key analytical pages, each serving a unique purpose. Together, they provide a holistic view of organizational energy performance.
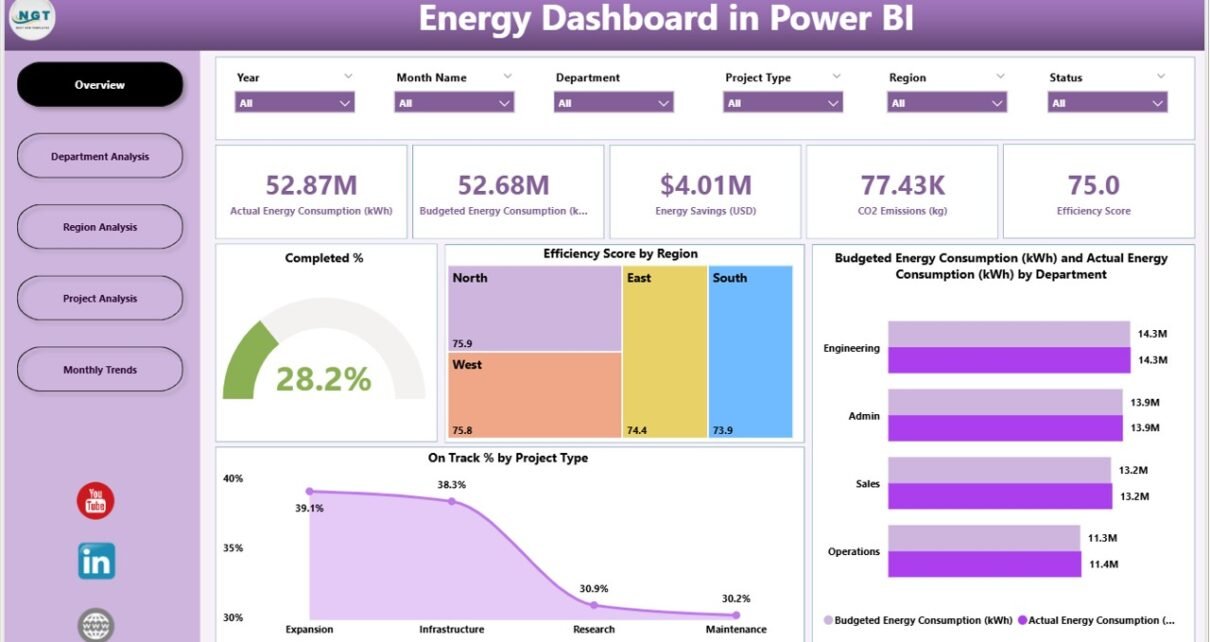
1️⃣ Overview Page
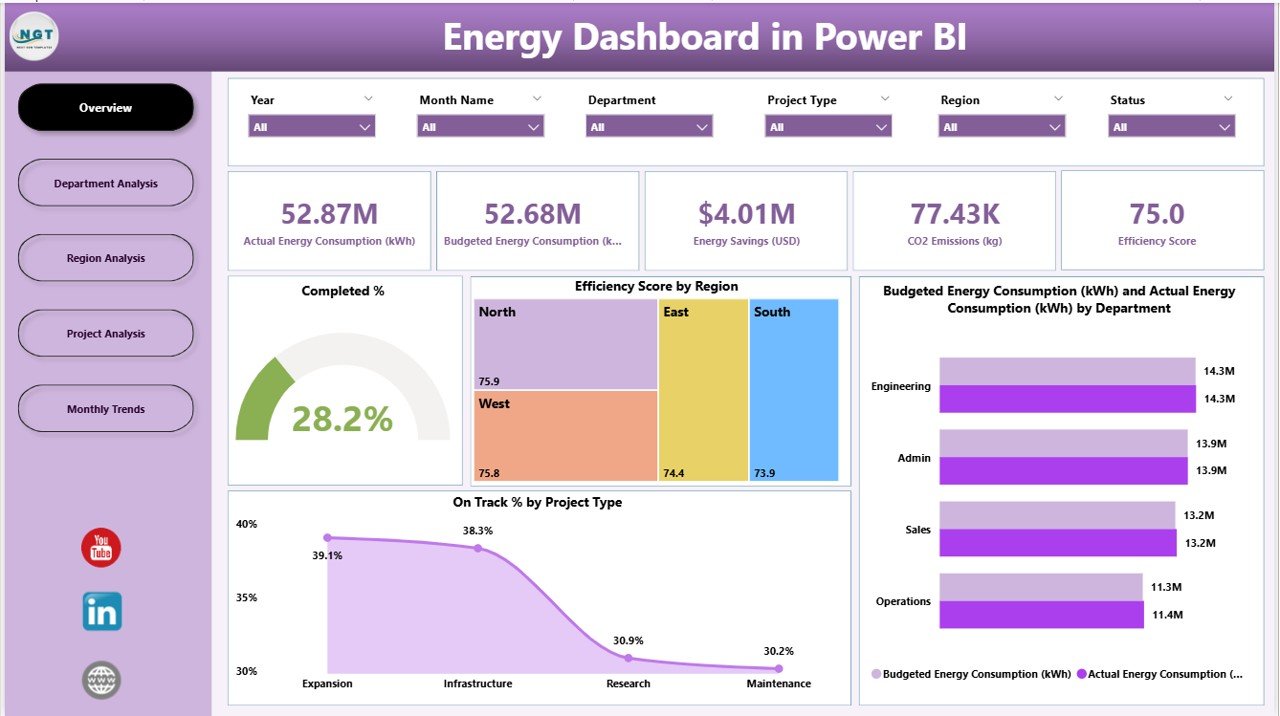
The Overview Page acts as the control center for your energy analytics.
Key Elements Include:
-
Slicers: Dynamic filters to select time periods, departments, or regions.
-
Five KPI Cards: Display metrics such as total efficiency, energy savings, or completed project percentages.
Main Charts:
- Completed %
- Efficiency Score by Region
- Budgeted vs. Actual Energy Consumption (kWh) by Department
- On Track % by Project Type
This page gives an instant snapshot of energy utilization and performance — making it perfect for quick executive reviews.
2️⃣ Department Analysis Page
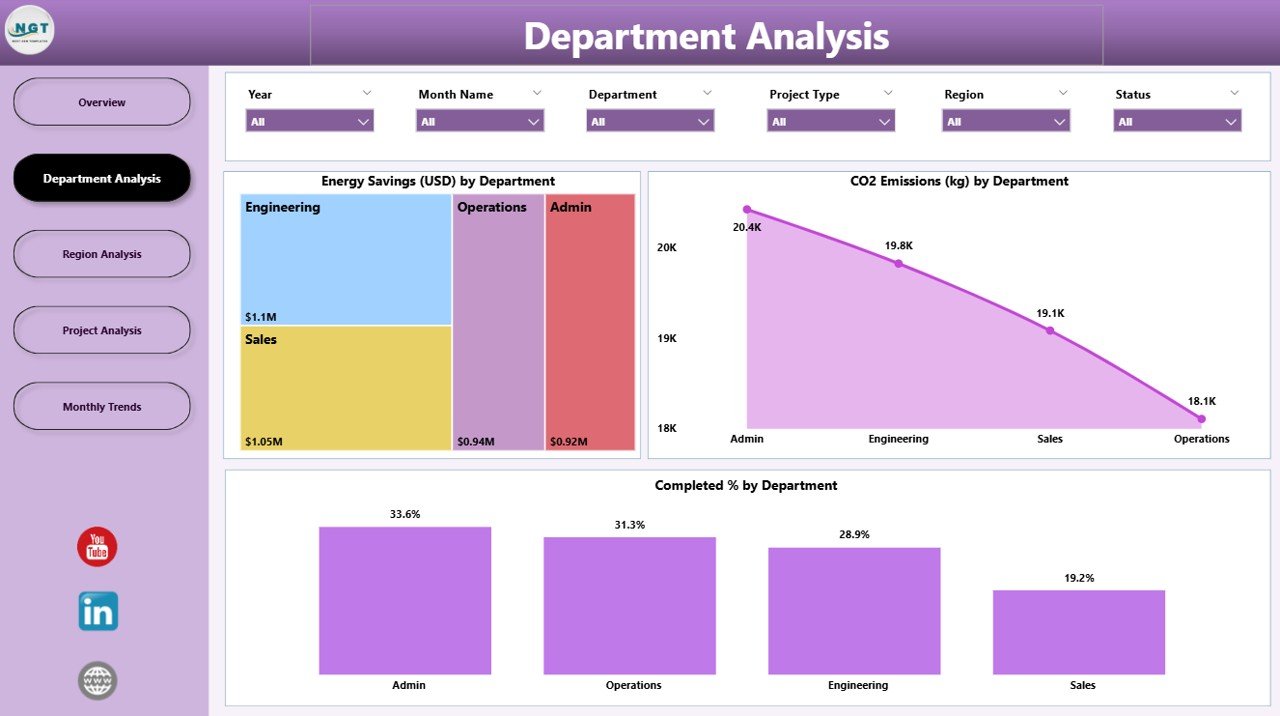
The Department Analysis Page dives deeper into department-level insights.
Main Charts Include:
-
Energy Savings (USD) by Department – Tracks cost reduction across business units.
-
CO₂ Emission (kg) by Department – Highlights which departments contribute most to emissions.
-
Completed % by Department – Monitors progress and efficiency of energy initiatives.
This view helps identify departments performing well and those needing optimization.
3️⃣ Region Analysis Page
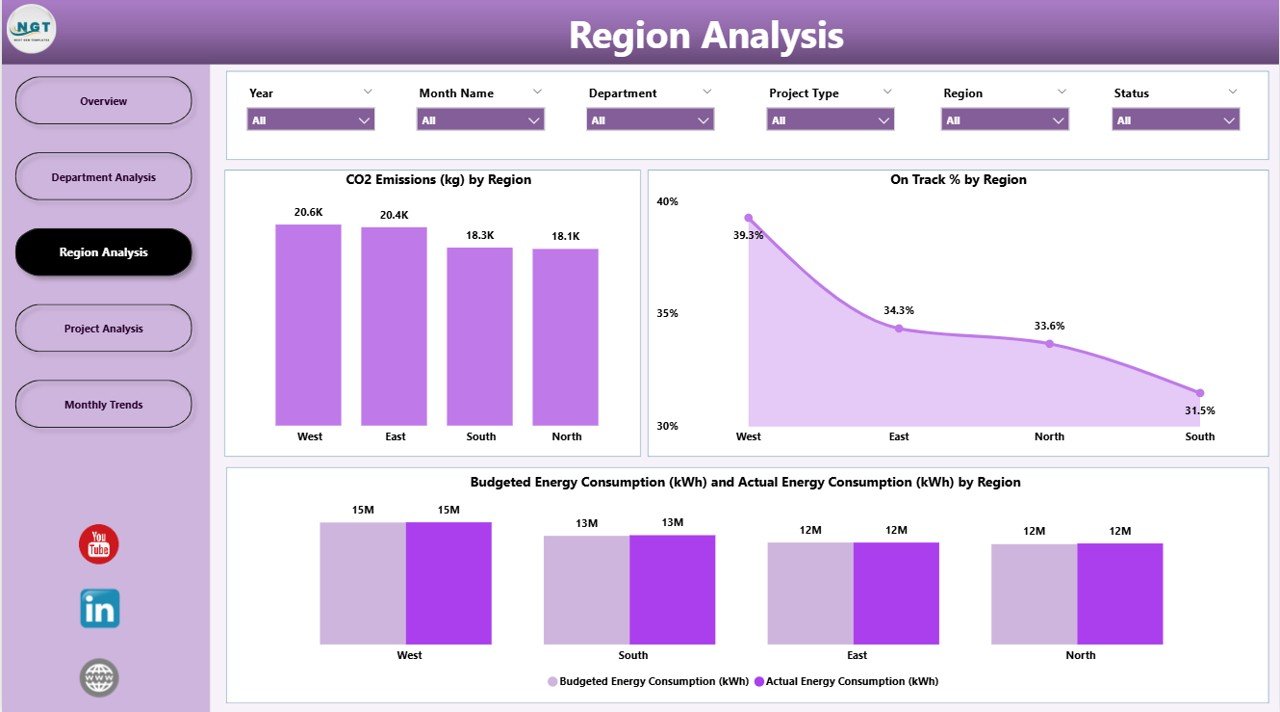
The Region Analysis Page evaluates energy performance geographically.
Key Visuals:
-
CO₂ Emissions (kg) by Region
-
On Track % by Region
-
Budgeted vs. Actual Energy Consumption (kWh) by Region
By visualizing data by location, decision-makers can recognize regional disparities and plan targeted interventions for improvement.
4️⃣ Project Analysis Page
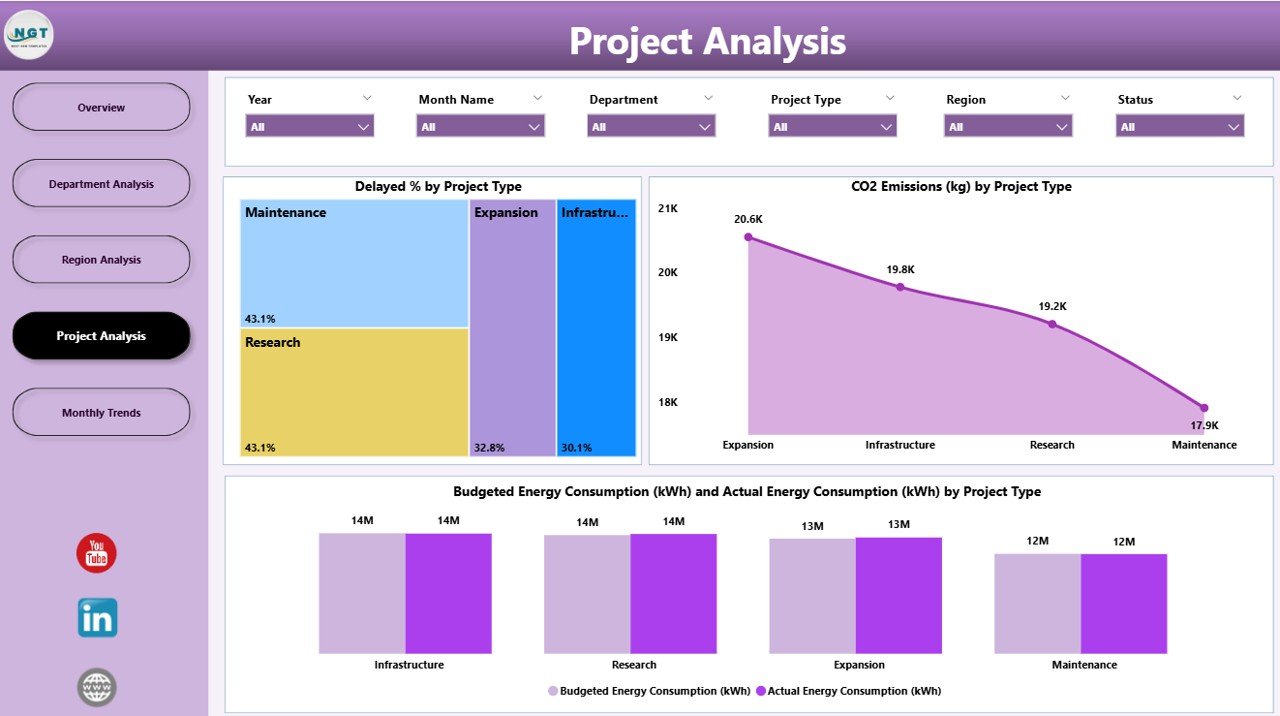
This page focuses on project-level performance and completion tracking.
Core Visuals Include:
-
Delayed % by Project Type – Identifies inefficiencies or delays in energy projects.
-
CO₂ Emissions (kg) by Project Type – Monitors sustainability impact by project category.
-
Budgeted vs. Actual Energy Consumption (kWh) by Project Type – Ensures projects align with set targets.
It’s a powerful tool for project managers to ensure energy initiatives stay on schedule and budget.
5️⃣ Monthly Trends Page
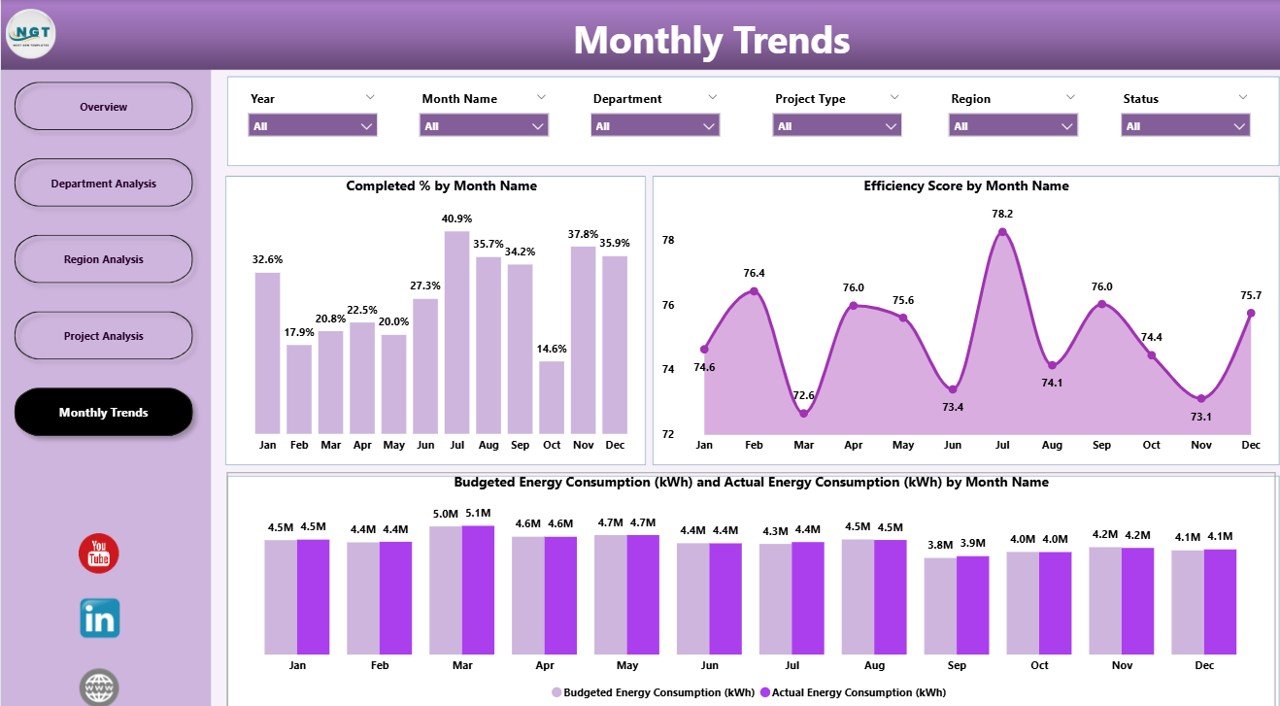
The Monthly Trends Page displays performance trends over time.
Charts Include:
-
Completed % by Month Name
-
Efficiency Score by Month Name
-
Budgeted vs. Actual Energy Consumption (kWh) by Month
With this page, organizations can identify seasonal patterns, track monthly progress, and forecast future energy needs more accurately.
Click to Purchases Energy Dashboard in Power BI
Why Businesses Need an Energy Dashboard in Power BI
Energy is a critical cost and sustainability driver. Without a centralized dashboard, teams often rely on scattered reports that make it difficult to analyze patterns. The Energy Dashboard in Power BI solves this challenge by offering a single source of truth.
Key Benefits:
✅ Centralized Data Management: Collects energy-related KPIs from multiple systems into one platform.
✅ Real-Time Analysis: Instantly visualizes changes in consumption and performance.
✅ Cost Savings: Identifies inefficiencies that lead to unnecessary energy expenses.
✅ Regulatory Compliance: Helps track emissions and sustainability indicators for audits.
✅ Data-Driven Decision Making: Empowers leaders with actionable insights instead of assumptions.
How Power BI Enhances Energy Management
Power BI adds exceptional value to energy monitoring by combining data integration, visualization, and automation.
Key Advantages:
-
Seamless Integration: Connects with Excel, SQL, IoT sensors, and ERP systems.
-
Interactive Visuals: Enables drill-downs from summary to detail level.
-
Automation: Scheduled data refresh keeps insights current without manual updates.
-
Accessibility: Share dashboards securely via Power BI Service or Teams.
-
AI Capabilities: Use natural language Q&A to generate insights quickly.
With these capabilities, Power BI turns energy management from a reactive process into a proactive strategy.
Advantages of the Energy Dashboard in Power BI
1. Unified Data Insights
All departments, projects, and regional data are combined in one interactive platform, eliminating spreadsheet chaos.
2. Improved Efficiency
Visual analytics highlight inefficiencies immediately, allowing quicker corrective action.
3. Enhanced Decision-Making
Leaders can base strategic decisions on accurate data trends, not gut instinct.
4. Sustainability Tracking
Environmental KPIs such as CO₂ emissions and efficiency scores ensure continuous improvement.
5. Better Cost Management
By comparing budgeted vs. actual energy consumption, teams can pinpoint overspending and implement savings measures.
6. Dynamic Reporting
Interactive slicers and filters make data exploration simple for users of all skill levels.
Opportunities for Improvement
Even the most well-built dashboards have room to grow.
Suggestions to Maximize Value:
-
Add Predictive Analytics: Use machine learning to forecast future energy demand.
-
Automate Alerts: Trigger notifications when KPIs cross thresholds.
-
Integrate IoT Devices: Connect real-time meter readings for live updates.
-
Include Benchmarking: Compare performance with industry averages.
-
Mobile Optimization: Ensure responsive layouts for access on mobile devices.
These improvements make the dashboard even more intelligent and future-ready.
Best Practices for the Energy Dashboard in Power BI
Click to Purchases Energy Dashboard in Power BI
To get the most out of your dashboard, follow these tried-and-true practices:
🔸 Data Management
-
Maintain clean, structured Excel or SQL datasets.
-
Use consistent KPI naming conventions.
-
Refresh data regularly to avoid outdated insights.
🔸 Dashboard Design
-
Keep visuals minimal and focused on insights.
-
Use color codes wisely — green for efficiency, red for alerts.
-
Group similar KPIs together for easy comparison.
🔸 User Interaction
-
Add tooltips for quick metric explanations.
-
Enable drill-through functionality for deeper insights.
-
Create bookmarks for custom views and storytelling.
🔸 Performance Optimization
-
Limit excessive visuals to improve load time.
-
Use DAX measures efficiently to enhance calculation speed.
-
Utilize aggregations for large datasets.
These best practices ensure your Power BI energy dashboard runs smoothly and delivers real business value.
Real-World Applications
Energy dashboards are being adopted across sectors for different purposes:
-
Manufacturing: To track machine-level energy usage and optimize production.
-
Construction: To monitor energy efficiency in green building projects.
-
Retail Chains: To manage power consumption across stores.
-
Healthcare: To maintain power reliability for critical equipment.
-
Public Sector: To report sustainability KPIs for policy transparency.
Power BI’s flexibility makes it suitable for any organization looking to enhance its energy intelligence.
Integration Possibilities
You can integrate your Power BI Energy Dashboard with:
-
Microsoft Excel for manual data inputs.
-
SharePoint / OneDrive for file-based synchronization.
-
IoT Devices for live meter readings.
-
ERP Systems (SAP, Oracle) for operational data.
-
Power Automate to schedule report distribution.
Such integrations make it easier to maintain real-time energy visibility across the enterprise.
How to Build Your Own Energy Dashboard in Power BI
If you wish to create a similar dashboard, here’s a simplified approach:
1️⃣ Collect Data: Gather consumption, emission, and cost data in Excel or SQL format.
2️⃣ Prepare Data: Clean and structure the dataset for Power BI import.
3️⃣ Import & Model: Connect data sources and build relationships.
4️⃣ Design Pages: Create visuals such as KPI cards, bar charts, and trend lines.
5️⃣ Add Interactivity: Include slicers, filters, and tooltips.
6️⃣ Publish: Share reports on Power BI Service for organization-wide access.
Following this step-by-step workflow ensures that even beginners can replicate the dashboard efficiently.
Conclusion
The Energy Dashboard in Power BI transforms how organizations monitor, analyze, and optimize energy performance. With its five detailed analytical pages — from overview to trends — it offers actionable insights that lead to better efficiency, cost reduction, and sustainability.
By combining automation, real-time visuals, and intuitive design, this dashboard bridges the gap between data and decision-making. Whether you’re managing corporate facilities or regional energy initiatives, Power BI makes it easier to visualize your path toward a greener, smarter future.
❓ Frequently Asked Questions (FAQs)
1. What data sources can the Energy Dashboard in Power BI connect to?
It can connect to Excel, SQL Server, IoT sensors, SharePoint, or cloud databases, enabling a unified energy view.
2. How often can the dashboard data refresh?
You can set automatic data refresh schedules in Power BI Service — hourly, daily, or weekly — based on your data frequency.
3. Can the dashboard track CO₂ emissions in real time?
Yes, when integrated with IoT sensors or API feeds, Power BI can update emissions metrics in real time.
4. Is this dashboard suitable for small businesses?
Absolutely. Small and mid-sized companies can use it with Excel-based data without needing complex infrastructure.
5. Can I share the dashboard with external stakeholders?
Yes, you can securely publish the dashboard using Power BI’s sharing and embedding features for clients or partners.
6. How can I improve dashboard performance?
Reduce the number of visuals, optimize DAX formulas, and use aggregated data tables to enhance speed and responsiveness.
7. Does Power BI offer mobile compatibility for this dashboard?
Yes. Power BI provides responsive layout options, allowing users to view dashboards seamlessly on mobile devices.
Visit our YouTube channel to learn step-by-step video tutorials