Managing your office budget efficiently is one of the most critical aspects of running a successful organization. Whether you are a finance manager, business owner, or project lead, tracking how your company’s budget is utilized helps you control expenses, improve resource allocation, and ensure financial health.
In today’s fast-paced work environment, Excel continues to be one of the most reliable tools for building detailed financial reports and dashboards. One such tool is the Office Budget Utilization Report in Excel — a ready-to-use, easy-to-customize template designed to track your budget, spending, and variance with clarity and precision.
Click to Purchases Office Budget Utilization Report in Excel
This article will explain everything you need to know about the Office Budget Utilization Report, including its structure, key features, benefits, and best practices for effective usage.
What Is an Office Budget Utilization Report in Excel?
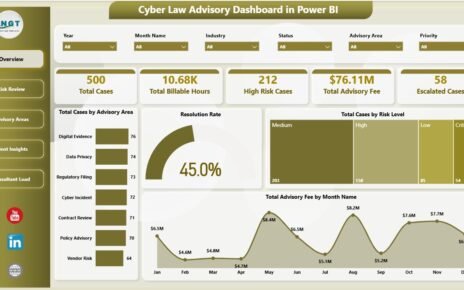
An Office Budget Utilization Report in Excel is a comprehensive financial analysis tool that helps organizations monitor how their allocated budgets are being used. It compares the approved budget against actual spending, highlights the variance percentage, and provides actionable insights through visual charts and summarized tables.
The template enables decision-makers to track budget performance by department, category, vendor, and month, helping identify overspending areas and cost-saving opportunities.
Key Components of the Office Budget Utilization Report
Our ready-made Excel report includes three main pages (plus a support sheet) that provide an end-to-end overview of budget performance. Each page is designed for a specific purpose and works seamlessly with slicers and formulas for automation and interactivity.
1️⃣ Summary Page
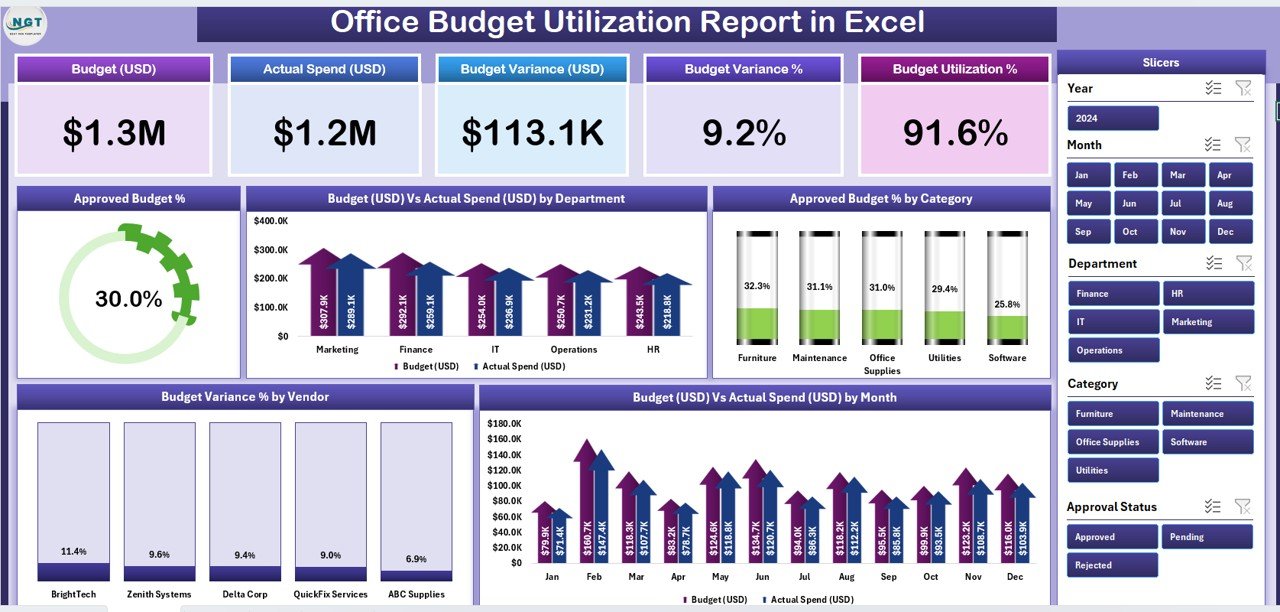
The Summary Page acts as the dashboard or main visualization area of the report.
It contains five major sections that summarize the entire financial picture:
-
Top 5 KPI Cards:
Display key indicators such as Total Budget, Total Actual Spend, Budget Utilization %, Budget Variance %, and Remaining Budget. -
Interactive Slicers (Right Side):
Allow users to filter the dashboard by Department, Vendor, or Month.
Charts and Visuals:
- Approved Budget %
- Budget (USD) vs Actual Spend (USD) by Department
- Approved Budget % by Category
- Budget Variance % by Vendor
- Budget (USD) vs Actual Spend (USD) by Month
Together, these visuals give an instant snapshot of financial performance and spending patterns across departments.
Report Page
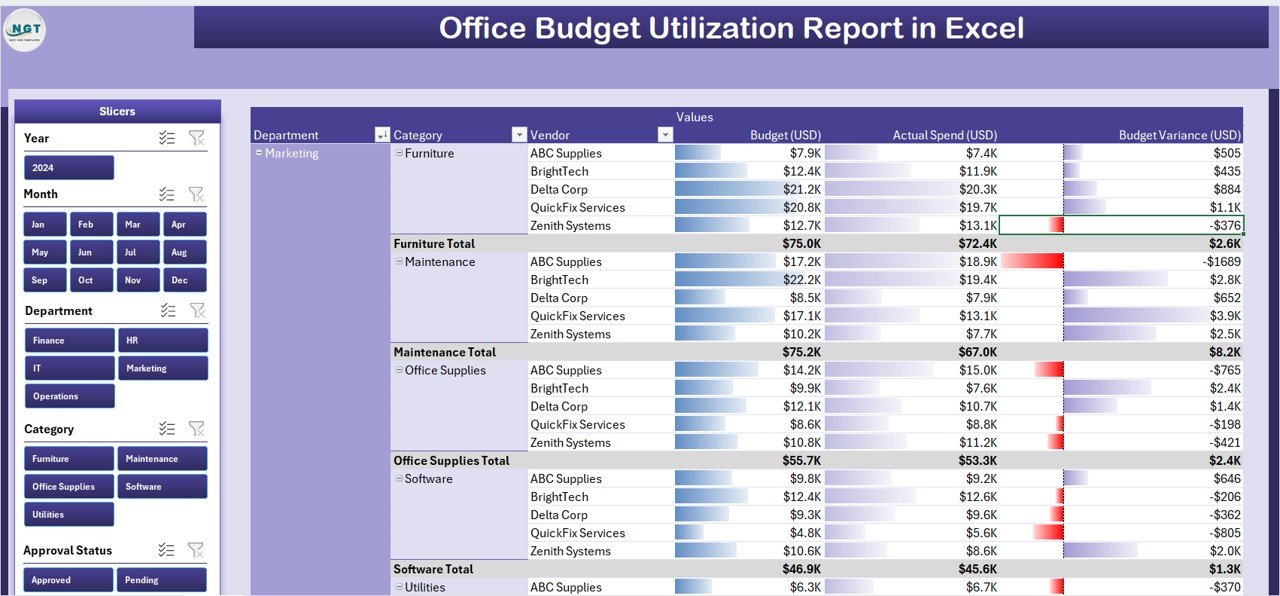
The Report Page focuses on detailed budget tracking and analysis.
It contains:
-
Left-Side Slicers: For dynamic filtering (e.g., by Department, Vendor, or Category).
Information Table: Displays granular data such as:
- Department Name
- Approved Budget (USD)
- Actual Spend (USD)
- Budget Variance %
- Vendor Details
- Category and Month
Click to Purchases Office Budget Utilization Report in Excel
This table is ideal for finance teams who need in-depth insights into individual cost areas or project-wise budget utilization.
3️⃣ Data Sheet
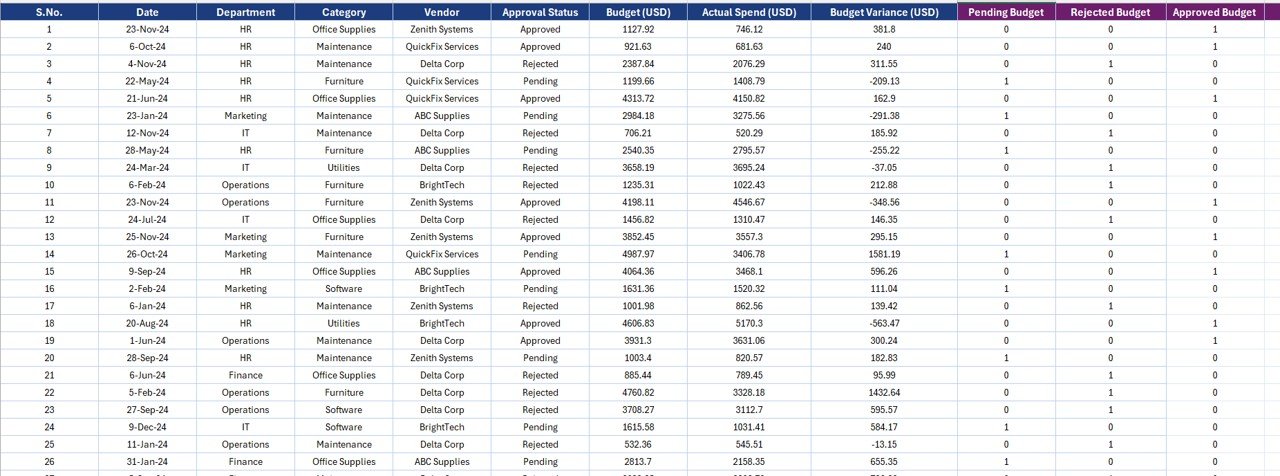
The Data Sheet is the foundation of the entire report.
It stores all the raw financial data — including approved budgets, actual expenditures, departments, vendors, categories, and months. This sheet is linked with the visuals and pivot tables used in the other pages, ensuring real-time updates.
You can easily import or paste your organization’s expense data here. Once updated, all charts and summary metrics in the dashboard refresh automatically.
4️⃣ Support Sheet
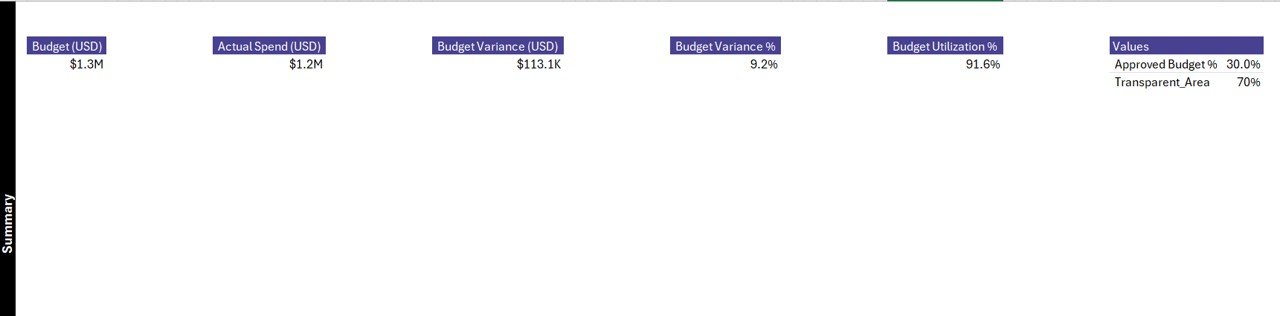
The Support Sheet holds lists, mappings, and formulas that support dropdowns, slicers, and lookup functions throughout the report. It ensures smooth interactivity and prevents data entry errors.
Why Use an Office Budget Utilization Report?
Financial control is at the heart of every successful organization. Without tracking budget performance, it’s nearly impossible to identify inefficiencies, detect spending leaks, or measure ROI accurately.
The Office Budget Utilization Report in Excel provides a systematic, data-driven way to manage your office finances effectively. Here are some compelling reasons why every organization should use it:
✅ Key Benefits
-
Centralized Financial View:
Combines data from multiple departments into one dashboard for quick insights. -
Budget Control:
Helps monitor spending and prevent cost overruns. -
Variance Tracking:
Shows the gap between planned and actual expenses. -
Data-Driven Decisions:
Allows managers to make better financial decisions using accurate analytics. -
Customizable and Scalable:
You can easily modify it for any industry or department.
How Does the Office Budget Utilization Report Work?
The logic behind this Excel report is simple yet powerful. It uses Excel formulas, pivot tables, and charts to automatically calculate and visualize financial data.
Here’s how it functions step by step:
-
Data Entry:
Input monthly or departmental budget and expense data in the Data Sheet. -
Formula Calculations:
Excel automatically computes Budget Utilization %, Variance %, and Remaining Budget. -
Pivot Tables:
Data is aggregated using pivot tables that group it by department, category, vendor, or month. -
Charts and KPIs:
These pivot outputs feed into dynamic charts and KPI cards displayed on the Summary Page. -
Filtering and Analysis:
Use slicers to narrow down specific departments, vendors, or months and instantly see updated insights.
Who Can Use This Report?
The Office Budget Utilization Report in Excel is ideal for:
-
Finance Managers tracking budgets across multiple departments.
-
Business Owners wanting to monitor cost efficiency.
-
Project Managers ensuring that project funds are utilized effectively.
-
Operations Teams overseeing vendor expenses and procurement.
-
Corporate Offices aiming to maintain transparency in financial management.
Advantages of the Office Budget Utilization Report in Excel
1. Real-Time Financial Monitoring
You can instantly check how much of your budget has been used, which department is overspending, and how much remains for future expenses.
2. Visual Clarity
Charts and KPIs make it easy to interpret financial data. Even non-financial professionals can understand spending trends at a glance.
3. Efficiency and Accuracy
Automated calculations reduce manual errors and save time spent on financial analysis.
4. Data-Driven Planning
Historical trends allow better forecasting and resource planning for future budgets.
5. Customization and Flexibility
Since it’s built in Excel, you can easily add or modify charts, KPIs, or departments as per your business structure.
How to Create an Office Budget Utilization Report in Excel
You can build your own report using the following steps:
-
Prepare the Data Table:
Include columns like Department, Vendor, Category, Month, Approved Budget, and Actual Spend. -
Insert Calculated Columns:
Add formulas for Variance, Budget Utilization %, and Remaining Budget. -
Create Pivot Tables:
Use pivot tables to summarize spending by Department, Category, Vendor, and Month. -
Insert Charts:
Add bar charts, line charts, or pie charts to visualize Approved vs Actual Spend, Variance %, etc. -
Add KPIs:
Use data cards or simple Excel cells with large fonts and conditional formatting. -
Add Slicers and Interactivity:
Link slicers to pivot tables for dynamic filtering. -
Design a Dashboard Layout:
Combine all visuals neatly on one sheet (Summary Page). -
Automate with Formulas:
Use Excel functions like SUMIFS, AVERAGEIFS, and IFERROR for error-free results.
Click to Purchases Office Budget Utilization Report in Excel
Best Practices for the Office Budget Utilization Report in Excel
Follow these proven practices to get the most out of your budget report:
✔️ Maintain Clean Data
Keep your Data Sheet structured and free from duplicates or empty rows.
✔️ Use Consistent Categories
Define uniform department, vendor, and category names across all entries to ensure accurate pivots.
✔️ Regularly Update Actual Spend
Update your data weekly or monthly to reflect real-time financial performance.
✔️ Apply Conditional Formatting
Use color codes to highlight overspending (e.g., red) or under-utilization (e.g., green).
✔️ Use Dynamic Ranges
Convert data tables into Excel Tables (Ctrl + T) for automatic expansion.
✔️ Protect Critical Cells
Lock formula cells to prevent accidental edits.
✔️ Add Documentation
Include a small instruction section on the Home or Support Sheet for new users.
-
Budget Utilization: 95.4%
-
Total Variance: −$10,000
-
Departments Over Budget: IT
-
Departments Under Budget: Marketing
With these insights, the company can decide whether to reallocate unused funds or implement cost control measures.
Common Mistakes to Avoid
Even with a great template, some mistakes can reduce the accuracy of your report. Avoid these pitfalls:
-
Forgetting to update actual expenses regularly.
-
Using inconsistent currency formats.
-
Not verifying vendor or category details.
-
Overcomplicating formulas without testing.
-
Ignoring negative variance values (they often signal overspending).
How to Use the Template Effectively
-
Open the Excel File.
Go to the Data Sheet and input your financial data. -
Navigate to the Summary Page.
View the key KPIs and visual dashboards. -
Use Slicers.
Filter by Department, Vendor, or Month for specific insights. -
Analyze Trends.
Study variance and utilization trends across time. -
Export or Share.
Convert the report into PDF or share it directly for management reviews.
Advantages of Using Excel for Budget Utilization Tracking
-
No expensive software required.
-
Works offline and on any computer.
-
Easy to customize and replicate.
-
Integrates with Power BI or Google Sheets if needed.
-
Widely accepted by finance teams around the world.
Conclusion
An Office Budget Utilization Report in Excel is a powerful yet simple tool for managing financial performance. It helps organizations control spending, evaluate departmental efficiency, and plan budgets with confidence.
By combining structured data, automation, and clear visuals, this Excel-based report transforms ordinary numbers into actionable insights. Whether you manage a small office or a large enterprise, this template saves time, increases accuracy, and provides the clarity every decision-maker needs.
❓ Frequently Asked Questions (FAQs)
1. What is the main purpose of a Budget Utilization Report?
It helps track how much of the approved budget has been spent and identifies areas where spending exceeds or falls below expectations.
2. Can I use this Excel report for any industry?
Yes. You can easily customize department names, categories, and vendors to suit any sector — from IT and healthcare to manufacturing and education.
3. How often should I update the data?
It’s best to update the Actual Spend column monthly to ensure accurate variance tracking and forecasting.
4. Can this report handle multiple currencies?
Yes, you can add currency fields or use Excel’s built-in formatting to display different currencies for international operations.
5. Does this report require advanced Excel skills?
No. The template is beginner-friendly and relies on basic formulas, slicers, and pivot tables.
6. Can I convert this report into a Power BI dashboard later?
Absolutely. Since all the data is stored in structured Excel tables, you can directly import it into Power BI for advanced visualization.
7. How can I share the report with my management team?
You can export the Summary Page as a PDF or share the Excel file directly through cloud storage like OneDrive or Google Drive.
Visit our YouTube channel to learn step-by-step video tutorials