In today’s competitive financial world, data-driven decision-making is essential for every investment professional. Whether you manage portfolios, mutual funds, or institutional assets, the ability to measure, track, and analyze performance accurately defines your success.
The Investment Management KPI Scorecard in Excel provides a simple yet powerful way to evaluate performance metrics, monitor goals, and make informed strategic decisions — all within one interactive and easy-to-use Excel file.
This article explains what the Investment Management KPI Scorecard is, how it works, its key features, advantages, and best practices to help investment managers achieve greater efficiency and insight.
Click to Purchases Investment Management KPI Scorecard in Excel
What Is an Investment Management KPI Scorecard in Excel?
An Investment Management KPI Scorecard is a structured performance tracking system built in Microsoft Excel. It consolidates critical Key Performance Indicators (KPIs) related to investment performance, client satisfaction, compliance, and operational efficiency.
The scorecard allows portfolio managers, analysts, and executives to visualize financial and non-financial metrics through clear, data-driven visuals. It supports Month-to-Date (MTD) and Year-to-Date (YTD) comparisons, making it easy to monitor ongoing performance and identify areas that require attention.
By integrating actual, target, and previous year (PY) data, the scorecard helps align investment goals with performance outcomes. It becomes an essential decision-support tool that transforms raw data into actionable insights.
Click to Purchases Investment Management KPI Scorecard in Excel
Why Use Excel for Investment Performance Tracking?
Excel remains a trusted tool in financial analysis and reporting. It provides the perfect balance between flexibility, customization, and functionality. Using Excel for investment KPIs allows you to:
-
Build dynamic dashboards and scorecards using formulas, conditional formatting, and charts.
-
Easily import or link data from multiple sources such as trading platforms, CRMs, or performance reports.
-
Apply custom logic, calculations, and formulas for each KPI.
-
Avoid complex software setups or licensing costs.
-
Maintain full control over your data and presentation format.
Because Excel is widely used across the finance industry, professionals can easily adapt to this scorecard format without needing specialized software training.
Key Features of the Investment Management KPI Scorecard in Excel
The Investment Management KPI Scorecard comes with four functional worksheet tabs, each designed to simplify specific aspects of performance tracking.
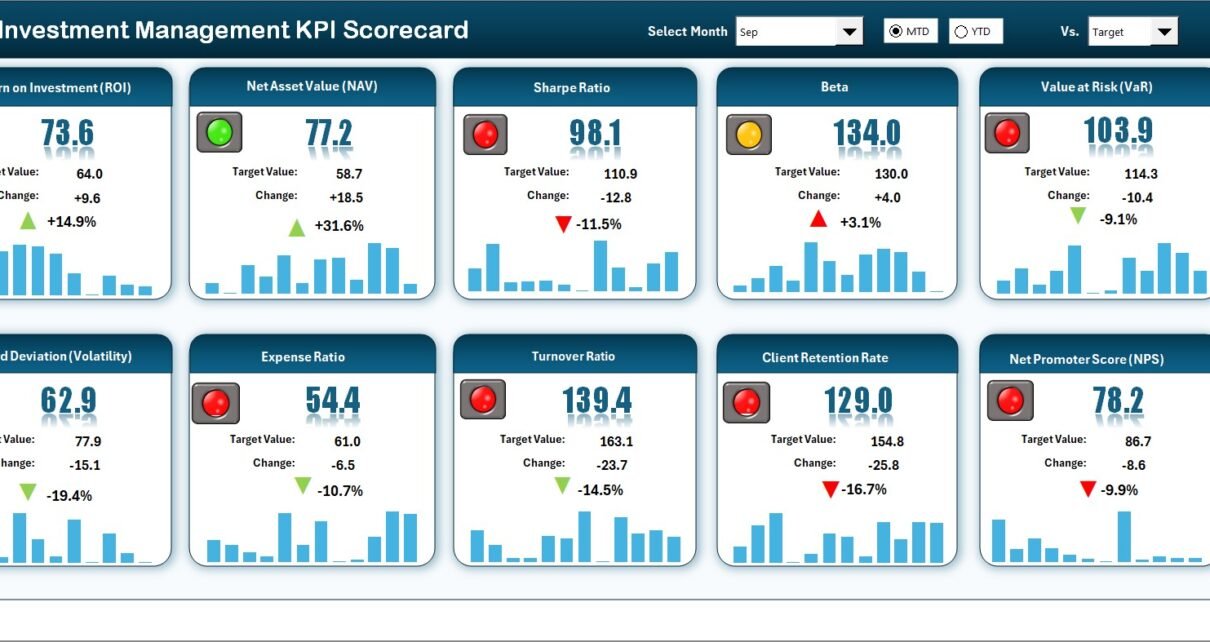
1. Scorecard Sheet (Main Dashboard)

The Scorecard Sheet serves as the central dashboard. It summarizes all the KPIs in a structured and visually engaging layout.
Key Functionalities:
-
Dropdown Menus:
Select the month and choose between MTD or YTD analysis. The dashboard updates automatically to reflect the selected period. -
Actual vs Target Values:
Compare actual performance with target benchmarks for each KPI. The side-by-side comparison offers instant insight into areas of success and underperformance. -
Visual Indicators:
Color-coded conditional formatting and arrow symbols instantly highlight performance status — for example, green for above target, yellow for near target, and red for below target. -
Comprehensive KPI Overview:
Display KPI names, units, actual and target values, and MTD/YTD comparisons. The structured layout ensures easy interpretation and consistent tracking.
This tab acts as your “control center,” showing the complete investment health snapshot in a single view.
2. KPI Trend Sheet

The KPI Trend Sheet helps visualize performance progression over time.
Key Functionalities:
-
KPI Selection Dropdown:
In cell range C3, users can choose a specific KPI name to view its trend analysis. -
KPI Metadata Display:
Once selected, the sheet automatically shows KPI Group, Unit, Type (Lower the Better or Upper the Better), Formula, and Definition. -
MTD and YTD Trend Charts:
Visualize the Actual, Target, and Previous Year (PY) metrics for both MTD and YTD values.
These trend charts help analysts quickly identify growth patterns or deviations across months.
This sheet supports visual storytelling — turning raw data into a performance narrative that reveals patterns, consistency, and improvement areas.
3. Input Data Sheet

This is the data engine of the scorecard.
Key Functionalities:
-
Data Entry for All KPIs:
Input actual performance, targets, and historical figures for each month and KPI. -
Dynamic Updates:
As new results become available, simply update the relevant cells to refresh the entire scorecard automatically. -
Structured Data Management:
Maintain a clean and organized table with proper column headers for easy maintenance and review.
This design ensures that even users with limited Excel knowledge can manage and update the dashboard confidently.
4. KPI Definition Sheet

The KPI Definition Sheet acts as a reference library for all performance metrics.
Key Functionalities:
-
Define each KPI clearly with its Name, Group, Unit, Formula, and Definition.
-
Distinguish between financial (e.g., ROI, AUM Growth Rate) and non-financial KPIs (e.g., Client Retention, Compliance Score).
-
Classify KPIs as Lower the Better (LTB) or Upper the Better (UTB) for accurate trend interpretation.
-
Create a standardized understanding of every metric used across the organization.
This ensures consistency and transparency in how each performance indicator is measured and interpreted.
Click to Purchases Investment Management KPI Scorecard in Excel
Common KPIs Used in Investment Management
When setting up your scorecard, choosing the right KPIs is crucial. Here are some popular ones:
Financial KPIs
-
Return on Investment (ROI): Measures profitability against invested capital.
-
Assets Under Management (AUM): Tracks total funds managed by the firm.
-
Portfolio Turnover Ratio: Indicates the frequency of buying and selling assets.
-
Expense Ratio: Measures operational cost efficiency.
-
Alpha and Beta: Assess risk-adjusted performance relative to benchmarks.
Operational KPIs
-
Trade Execution Accuracy: Monitors precision in order execution.
-
Compliance Rate: Measures adherence to investment guidelines.
-
Research Efficiency: Tracks time and accuracy of investment research processes.
-
Client Reporting Timeliness: Ensures reports are delivered promptly.
Client and Relationship KPIs
-
Client Retention Rate: Reflects customer loyalty and satisfaction.
-
New Client Acquisition: Tracks growth in client base.
-
Customer Satisfaction Index: Measures feedback and experience quality.
These KPIs collectively help organizations evaluate performance from every angle — profitability, compliance, and customer engagement.
How the Scorecard Improves Investment Decision-Making
The Investment Management KPI Scorecard transforms performance tracking into actionable intelligence. Here’s how it empowers better decision-making:
-
Real-Time Performance Visibility:
Managers gain instant access to live KPI metrics, allowing quicker responses to underperforming areas. -
Benchmark Comparison:
The Actual vs Target visualization makes it easy to assess whether investment strategies meet expectations. -
Historical Trend Analysis:
By viewing YTD and PY data, you can identify seasonal trends or recurring issues. -
Enhanced Accountability:
Each KPI can be assigned to a responsible department or individual, promoting ownership of results. -
Data-Driven Strategy Refinement:
Continuous tracking allows teams to adapt strategies proactively, rather than reactively. -
Simplified Reporting:
The dashboard format replaces lengthy manual reports with concise visuals that stakeholders can understand at a glance.
Advantages of Investment Management KPI Scorecard in Excel
A well-structured KPI scorecard provides tangible benefits for every financial institution.
1. Centralized Performance View
All KPIs are consolidated into one dashboard, reducing the need to review multiple reports or files.
2. Data Accuracy and Transparency
Each KPI is clearly defined and formula-driven, ensuring reliability and eliminating ambiguity.
3. Improved Decision-Making
Instant access to actual, target, and previous data helps leaders make informed decisions with confidence.
4. Increased Accountability
Assigning responsibility for each KPI fosters ownership and motivates consistent performance improvement.
5. Easy Customization
Modify the dashboard, add new KPIs, or adjust calculations based on changing business goals without any coding.
6. Cost-Effective Solution
Unlike advanced analytics platforms, Excel-based dashboards require no subscriptions or technical setup.
7. Better Visual Communication
Conditional formatting, progress bars, and trend charts help simplify complex financial data into clear visuals.
8. Scalable for All Business Sizes
From small investment firms to large asset managers, the Excel scorecard adapts to varying data scales and reporting needs.
Best Practices for Using the Investment Management KPI Scorecard
To get the most out of this Excel-based tool, follow these best practices:
-
Define SMART KPIs:
Ensure every KPI is Specific, Measurable, Achievable, Relevant, and Time-bound. -
Maintain Data Consistency:
Use standardized data entry formats (dates, numbers, currency) to prevent formula errors. -
Update Regularly:
Refresh data at regular intervals — daily, weekly, or monthly — based on your reporting cycle. -
Visualize with Clarity:
Use charts and conditional formatting that enhance readability, not clutter the dashboard. -
Validate Source Data:
Always cross-check actual performance data from reliable sources before updating. -
Track Both MTD and YTD:
This ensures you monitor short-term progress while keeping sight of long-term goals. -
Separate Input and Output Sheets:
Protect your formulas by locking calculation sheets and allowing data entry only in designated tabs. -
Review and Refine KPIs:
Over time, evaluate which KPIs truly reflect business value and adjust them accordingly.
How to Customize the Scorecard for Your Organization
The Investment Management KPI Scorecard in Excel is highly adaptable. Here’s how you can tailor it:
-
Add New KPIs:
Extend the KPI list by adding more rows to the KPI Definition and Input Data sheets. -
Integrate with External Data:
Link Excel to financial databases, trading software, or API feeds for automated updates. -
Modify Layout:
Reorganize dashboard visuals to highlight the KPIs most important to your business. -
Add Filters and Slicers:
Include filters for department, fund type, or portfolio manager to make analysis more interactive. -
Include Conditional Icons:
Use arrows, stars, or flags to indicate performance levels.
By customizing it, firms can align the scorecard closely with their internal performance management frameworks.
Click to Purchases Investment Management KPI Scorecard in Excel
Conclusion
The Investment Management KPI Scorecard in Excel bridges the gap between complex investment data and actionable business insight. It empowers portfolio managers, analysts, and executives to monitor financial performance with precision and clarity.
By centralizing all KPIs, providing visual comparisons, and simplifying reporting, this scorecard turns data into strategy. Excel’s flexibility ensures you can modify, expand, or automate the dashboard to meet your evolving needs — making it an indispensable tool for modern investment professionals.
If you want to boost efficiency, accountability, and transparency in your investment operations, adopting an Excel-based KPI scorecard is the smartest step forward.
Frequently Asked Questions (FAQs)
1. What is the purpose of an Investment Management KPI Scorecard?
The purpose is to track, analyze, and visualize investment performance metrics such as ROI, AUM growth, and client retention. It enables professionals to make data-driven decisions and align outcomes with strategic goals.
2. How does the Excel scorecard differ from advanced BI tools?
Unlike complex tools like Power BI or Tableau, the Excel version is cost-effective, requires no additional setup, and is easier to customize. It’s ideal for quick deployment and smaller teams.
3. Can I automate data updates in the scorecard?
Yes, you can link the Input Data sheet with external Excel files, databases, or APIs using Power Query or VBA automation for real-time updates.
4. What are the best KPIs to include?
Common choices include ROI, AUM, Portfolio Turnover, Expense Ratio, Compliance Rate, and Client Retention Rate. These KPIs give a balanced view of financial and operational efficiency.
5. Is this scorecard suitable for both individuals and firms?
Absolutely. Independent portfolio managers, small investment startups, and large asset management firms can all use and customize this scorecard effectively.
6. Can I add charts or graphs to enhance the dashboard?
Yes, the KPI Trend sheet supports dynamic charts. You can insert additional visuals like bar, line, or combo charts to show performance variations.
7. How often should I update my KPI data?
Most organizations update data monthly, but high-frequency trading or short-term funds might require weekly or even daily updates for better accuracy.
8. Can the scorecard track qualitative metrics?
Yes, you can include non-financial KPIs like “Client Feedback Score” or “Compliance Review Timeliness” to measure qualitative aspects of investment performance.
Click to Purchases Investment Management KPI Scorecard in Excel
Visit our YouTube channel to learn step-by-step video tutorials