The retail industry thrives on accurate data, especially in the competitive footwear and accessories sector, where inventory turnover, seasonal demand, and customer preferences constantly change. To stay ahead, retailers must track performance efficiently across multiple areas such as sales, stock management, and profitability.
The Footwear & Accessories KPI Dashboard in Excel is a ready-to-use, data-driven tool that empowers managers to measure success and identify improvement opportunities with precision and clarity.
Click to Purchases Footwear & Accessories KPI Dashboard in Excel
What Is a Footwear & Accessories KPI Dashboard in Excel?
A Footwear & Accessories KPI Dashboard is an analytical tool built in Excel that helps retail businesses monitor their key performance indicators (KPIs) — including sales, returns, profit margins, and stock movement — in one interactive interface.
This Excel-based system provides both Month-to-Date (MTD) and Year-to-Date (YTD) tracking, enabling decision-makers to:
-
Evaluate progress toward business goals.
-
Compare current results against targets and previous years.
-
Visualize trends for better planning and forecasting.
-
Improve operational efficiency through data insights.
It is a comprehensive yet easy-to-use solution ideal for footwear brands, retail outlets, e-commerce sellers, and distributors.
Click to Purchases Footwear & Accessories KPI Dashboard in Excel
Why Use Excel for Retail KPI Tracking?
Excel remains the most versatile reporting platform for retailers because it offers:
-
Customizable templates without needing coding skills.
-
Automated formulas that eliminate manual calculations.
-
Dynamic charts and visuals to represent trends clearly.
-
Affordability for all business sizes — no subscription fees.
-
Accessibility across devices for collaborative updates.
The Footwear & Accessories KPI Dashboard in Excel combines simplicity with sophistication — giving small boutiques and large retail chains alike a professional dashboard for accurate decision-making.
Key Features of the Footwear & Accessories KPI Dashboard
This Excel dashboard includes seven interconnected worksheet tabs, each serving a dedicated purpose for data entry, analysis, and visualization.
1. Home Sheet – The Central Navigation Hub
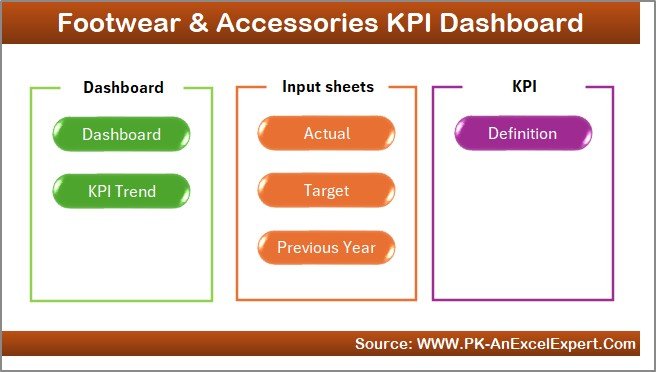
The Home Sheet acts as the main menu for the dashboard. It includes six clickable buttons to quickly navigate between the dashboard’s core sections — Dashboard, KPI Trend, Actual Input, Target, Previous Year, and KPI Definition.
This user-friendly design saves time and ensures smooth workflow across different worksheets.
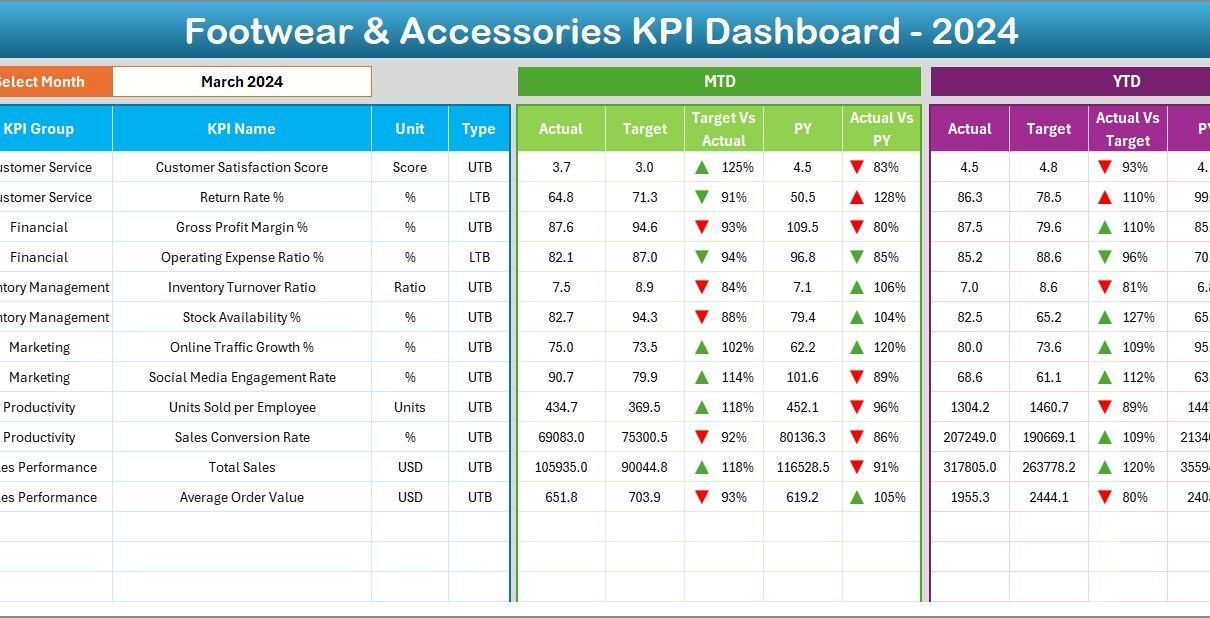
2. Dashboard Sheet – The Performance Summary
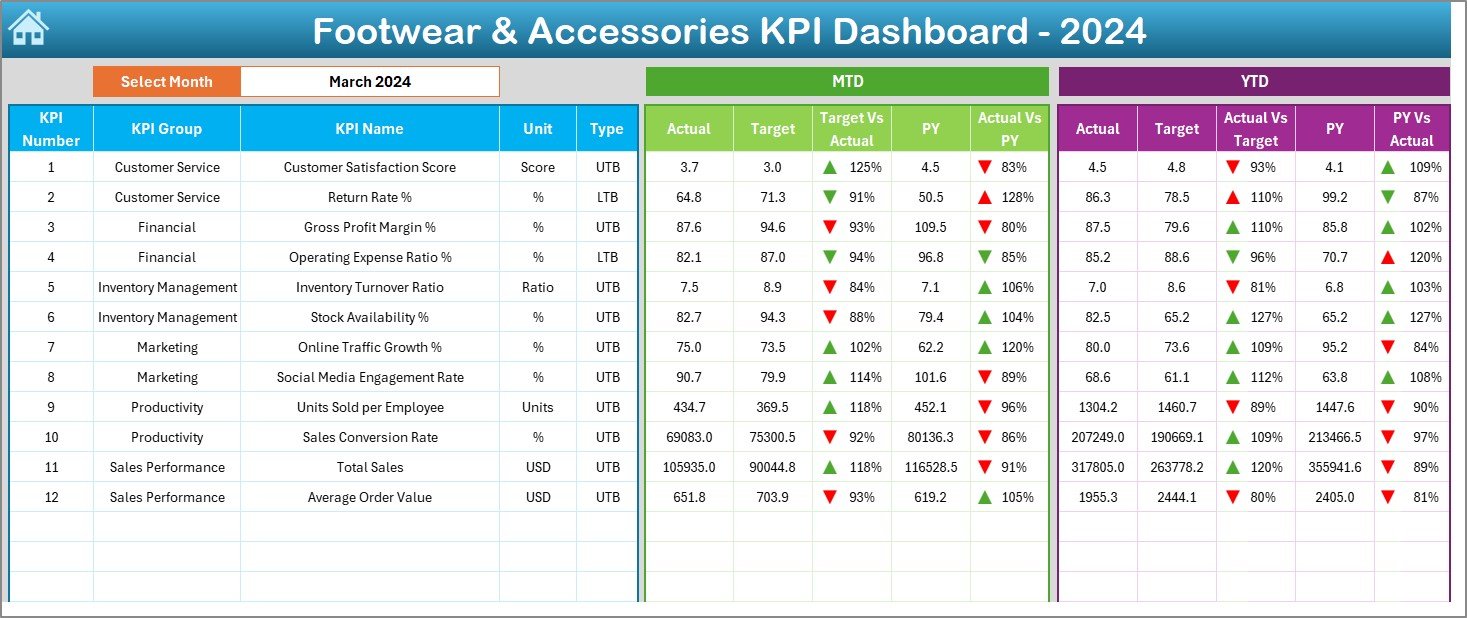
The Dashboard Sheet is the main analytical view where the complete business picture comes together.
Key Functionalities:
-
Month Selection (Cell D3): Choose any month from the dropdown to refresh all KPIs instantly.
-
Automated Calculations: Displays both MTD and YTD data for Actual, Target, and Previous Year figures.
-
Performance Indicators: Visual arrows (▲▼) with color codes indicate improvement or decline.
-
Comparative Analysis: Shows Target vs Actual and Previous Year vs Actual comparisons side-by-side.
This visual summary helps retailers quickly assess whether sales, profitability, and inventory are moving in the right direction.
3. KPI Trend Sheet – Tracking Long-Term Performance
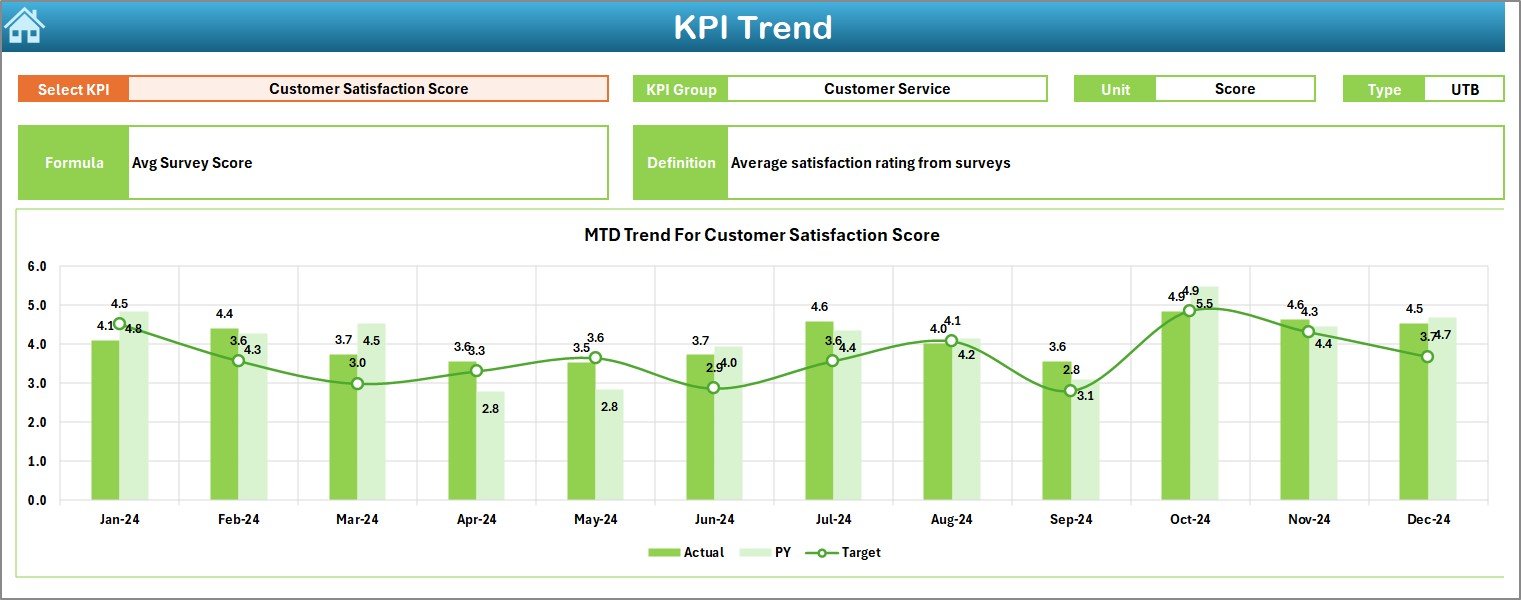
The KPI Trend Sheet provides an in-depth look at how each KPI evolves month over month.
Features Include:
-
Dynamic Dropdown (Cell C3): Select any KPI for detailed trend visualization.
-
KPI Information: Displays KPI Group, Unit, Type (UTB – Upper the Better or LTB – Lower the Better), Formula, and Definition.
-
Interactive Charts: Compare Actual, Target, and Previous Year data through dynamic MTD and YTD charts.
This sheet helps managers spot seasonal fluctuations, best-performing months, and improvement areas.
4. Actual Numbers Input Sheet – The Data Engine
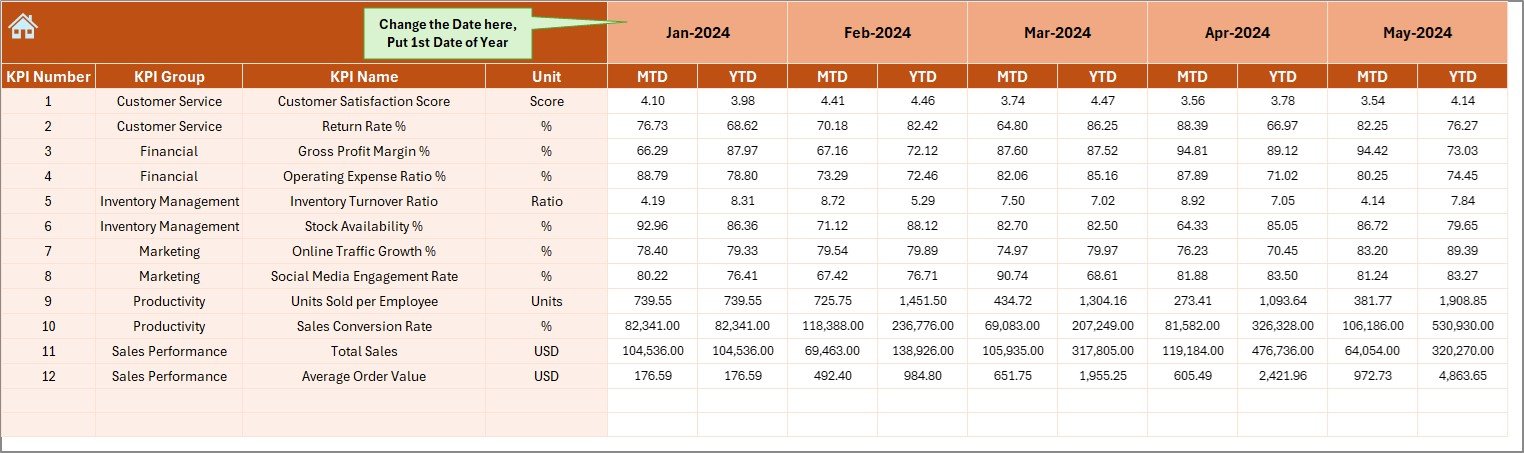
The Actual Numbers Input Sheet is where all operational data is entered.
How It Works:
-
Input Actual MTD and YTD values for each KPI.
-
Define the starting month in Cell E1 for automated calculations.
-
All data automatically flows into the dashboard and trend views.
This ensures real-time accuracy and consistency across all calculations.
5. Target Sheet – Setting Monthly and Annual Goals
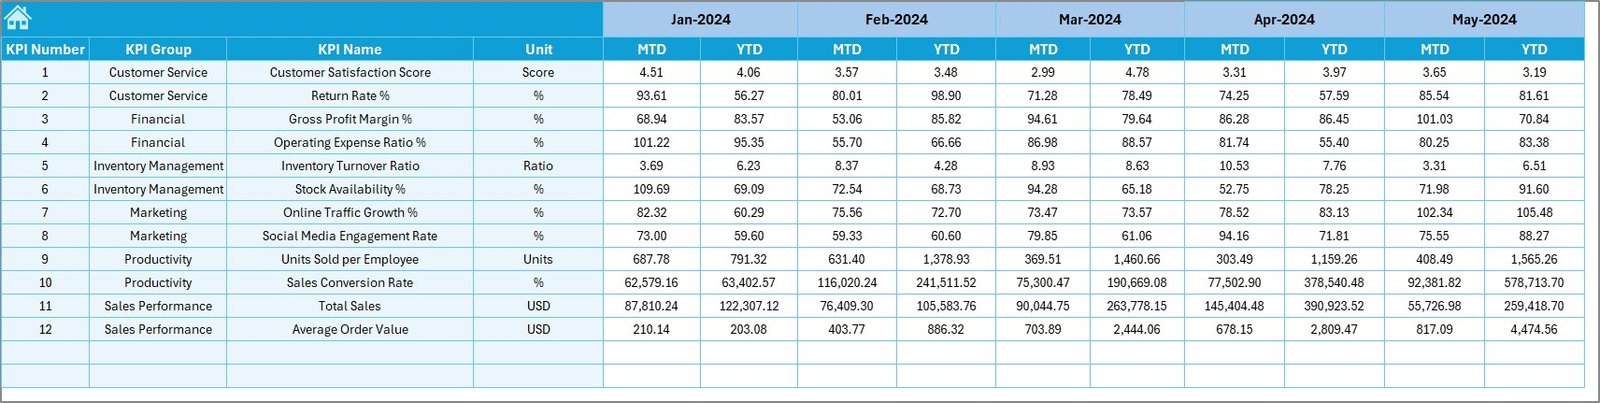
Targets serve as benchmarks for measuring success.
In the Target Sheet, you enter:
-
Monthly (MTD) targets for each KPI.
-
Yearly (YTD) cumulative targets.
This allows the dashboard to dynamically compare actual performance against planned expectations — highlighting achievements or shortfalls.
6. Previous Year Numbers Sheet – Historical Benchmarking
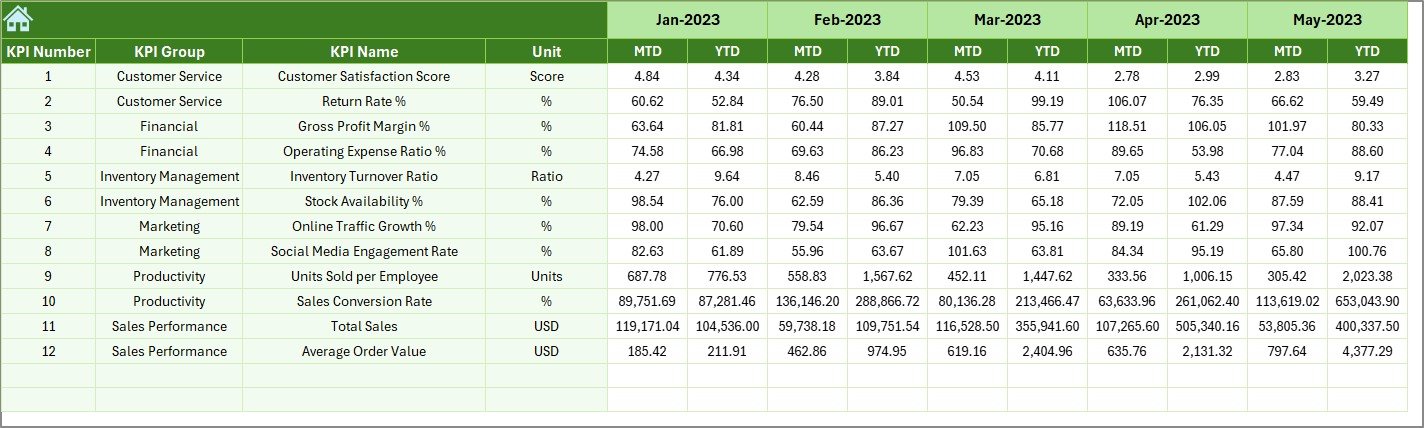
Tracking historical data provides context for growth and efficiency.
By recording Previous Year MTD and YTD data in this sheet, you can:
-
Compare year-on-year progress.
-
Identify improvement patterns.
-
Set realistic goals based on past performance.
7. KPI Definition Sheet – Maintaining Consistency
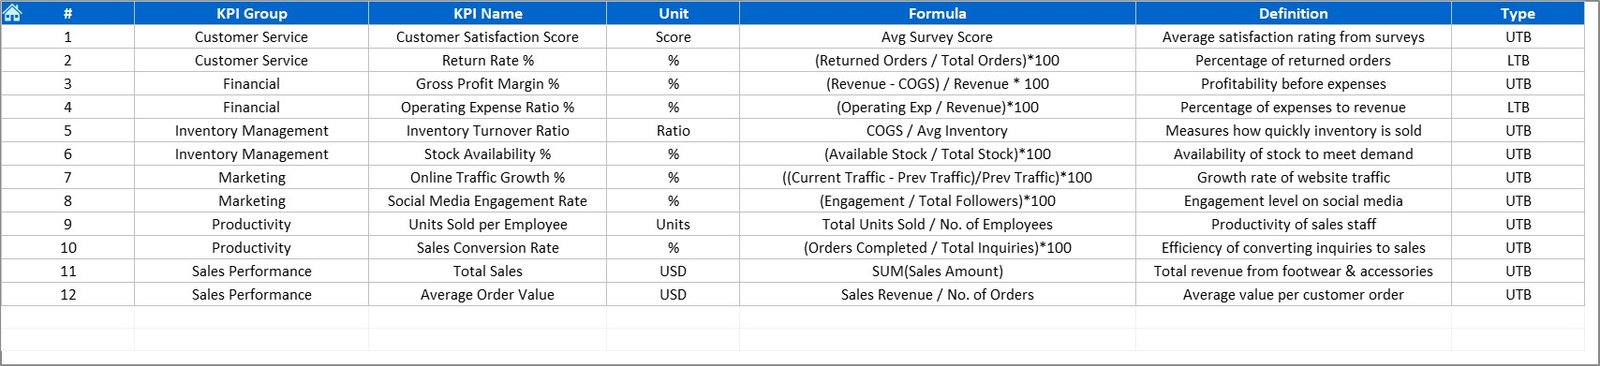
This sheet ensures that every KPI is clearly understood across departments.
Columns Include:
-
KPI Name
-
KPI Group (Sales, Inventory, Finance, Customer, Operations, etc.)
-
Unit of Measurement
-
Formula Used
-
Definition of KPI
It serves as a reliable reference manual, promoting clarity and alignment across all users.
Click to Purchases Footwear & Accessories KPI Dashboard in Excel
How to Use the Footwear & Accessories KPI Dashboard in Excel
Follow these simple steps to get started:
-
Open the Template.
Download and open the Excel file. -
Customize KPI Definitions.
Add your business-specific KPIs, units, and formulas. -
Enter Data.
Populate Actual, Target, and Previous Year sheets monthly. -
Select the Month.
On the Dashboard sheet, use the dropdown in Cell D3 to view any month’s results. -
Review Performance.
Use MTD and YTD comparisons with visual arrows to gauge progress. -
Analyze Trends.
Open the KPI Trend Sheet to view month-wise charts. -
Refine Strategy.
Take action based on insights gained from performance data.
Advantages of Using the Footwear & Accessories KPI Dashboard
👟 1. All-in-One Performance View
Monitor sales, inventory, and finance from one central dashboard.
👟 2. Improved Decision-Making
Identify top-performing products, months, or categories instantly.
👟 3. Increased Accountability
Assign KPIs to departments or team members for clear responsibility.
👟 4. Time-Saving Automation
Eliminate manual calculations with pre-built formulas and charts.
👟 5. Historical Comparisons
Track progress over years for accurate forecasting and benchmarking.
👟 6. Customization Flexibility
Easily add or modify KPIs based on evolving business needs.
How the Dashboard Enhances Retail Performance
The Footwear & Accessories KPI Dashboard enables retailers to:
-
Forecast seasonal demands accurately.
-
Optimize inventory levels to avoid overstocking or shortages.
-
Boost profitability by identifying top-margin products.
-
Measure campaign performance and conversion rates.
-
Enhance customer satisfaction by analyzing return rates and feedback.
This tool turns data into decisions — helping retailers make every sale and every product count.
Click to Purchases Footwear & Accessories KPI Dashboard in Excel
Best Practices for Using the KPI Dashboard
✅ 1. Keep KPIs Relevant
Focus on measurable metrics that align with business goals.
✅ 2. Ensure Data Accuracy
Double-check data entry for consistency across all months.
✅ 3. Review Regularly
Hold monthly review meetings using the dashboard visuals.
✅ 4. Update Targets Annually
Adjust targets based on new product launches and seasonal trends.
✅ 5. Protect Formulas
Lock formula cells to avoid accidental overwrites.
✅ 6. Visualize Clearly
Use conditional formatting and charts for easy interpretation.
✅ 7. Maintain Historical Data
Keep backups to compare multi-year performance.
Common Mistakes to Avoid
-
Ignoring Previous Year data when analyzing performance.
-
Using inconsistent units (e.g., mixing USD and INR).
-
Forgetting to update month selection in Cell D3.
-
Overloading the dashboard with unnecessary KPIs.
-
Editing formula cells manually without backups.
Avoiding these mistakes ensures reliable and actionable results.
Conclusion
The Footwear & Accessories KPI Dashboard in Excel is an essential solution for tracking retail performance. It brings together sales, finance, customer, and operational data into one streamlined, visual, and interactive format.
By leveraging this dashboard, businesses can make faster, more informed decisions — increasing profitability, improving customer satisfaction, and achieving sustainable growth.
Whether you manage a single boutique or a nationwide chain, this Excel dashboard equips you with the tools to analyze, optimize, and succeed in today’s retail landscape.
Click to Purchases Footwear & Accessories KPI Dashboard in Excel
Frequently Asked Questions (FAQs)
1. What is the purpose of the Footwear & Accessories KPI Dashboard?
It helps track essential retail KPIs such as sales, margins, and stock efficiency to enhance business performance.
2. Who can use this dashboard?
Store managers, retail analysts, and brand owners in the footwear and accessories industry.
3. Can I customize the KPIs?
Yes, the KPI Definition Sheet allows you to add or modify KPIs easily.
4. How often should I update the dashboard?
Update monthly for MTD and quarterly or annually for YTD summaries.
5. Does it require advanced Excel knowledge?
No — it’s beginner-friendly with automated calculations and dropdowns.
6. Can I link it to Power BI?
Yes, you can connect the Excel data to Power BI for advanced visualization.
7. Is it suitable for online and offline stores?
Absolutely. The template supports both e-commerce and brick-and-mortar retail operations.
Click to Purchases Footwear & Accessories KPI Dashboard in Excel
Visit our YouTube channel to learn step-by-step video tutorials