In the fast-paced world of printing and publishing, efficiency, quality, and profitability define long-term success. Managing multiple processes — from prepress production and printing operations to distribution and sales — demands accurate tracking and performance evaluation. That’s where the Printing and Publishing KPI Scorecard in Excel comes in.
This article explains everything you need to know about this ready-to-use Excel-based tool — its structure, features, advantages, and best practices — helping you make data-driven decisions to enhance productivity and profitability across your publishing operations.
Click to Purchases Printing and Publishing KPI Scorecard in Excel
📘 What Is a Printing and Publishing KPI Scorecard in Excel?
A Printing and Publishing KPI Scorecard in Excel is an interactive performance management tool designed to monitor, measure, and visualize the key performance indicators (KPIs) of the printing and publishing industry.
Whether you manage a digital publishing house, a print media agency, or a large-scale printing operation, this scorecard helps you evaluate how efficiently your business performs in areas such as production, turnaround time, quality, sales, and cost management.
The Excel-based scorecard uses dropdowns, conditional formatting, and automated formulas to display your Month-to-Date (MTD) and Year-to-Date (YTD) results for quick analysis and comparison.
Click to Purchases Printing and Publishing KPI Scorecard in Excel
🧩 Structure of the Printing and Publishing KPI Scorecard Template
This pre-built Excel scorecard includes four worksheets, each designed for a specific role in performance tracking and visualization.
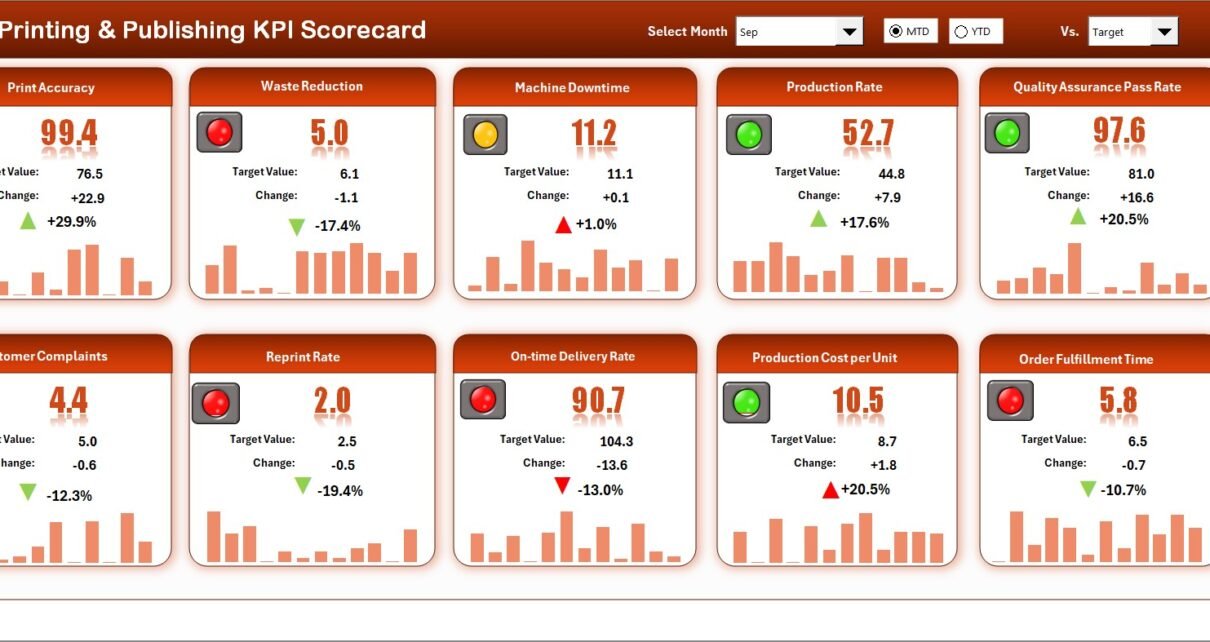
1. 📊 Scorecard Sheet — The Main Dashboard
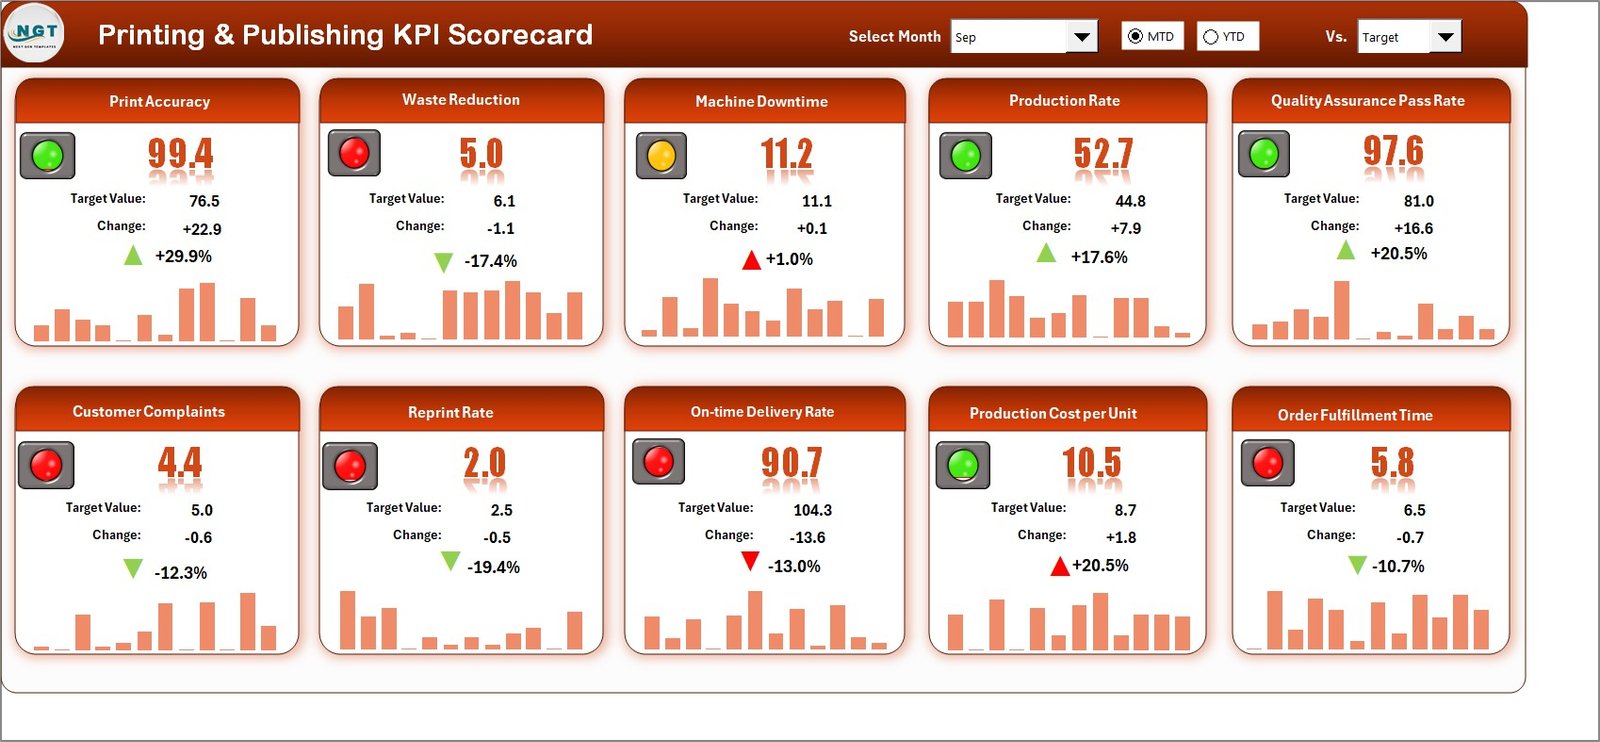
The Scorecard Sheet acts as the central interface of the tool. It gives you a clear snapshot of organizational performance across all KPIs.
Key Features:
-
Dropdown Menus: Choose any month or toggle between MTD and YTD for real-time performance insights.
-
Actual vs Target Comparison: See how each KPI performs compared to its target.
-
Visual Indicators: Use color-coded formatting (red, yellow, green) to instantly identify areas that need attention.
-
Compact Display: View multiple KPIs simultaneously for a holistic performance overview.
This is the primary sheet for managers and analysts, helping them quickly identify trends and make informed decisions.
2. 📈 KPI Trend Sheet — Track Progress Over Time
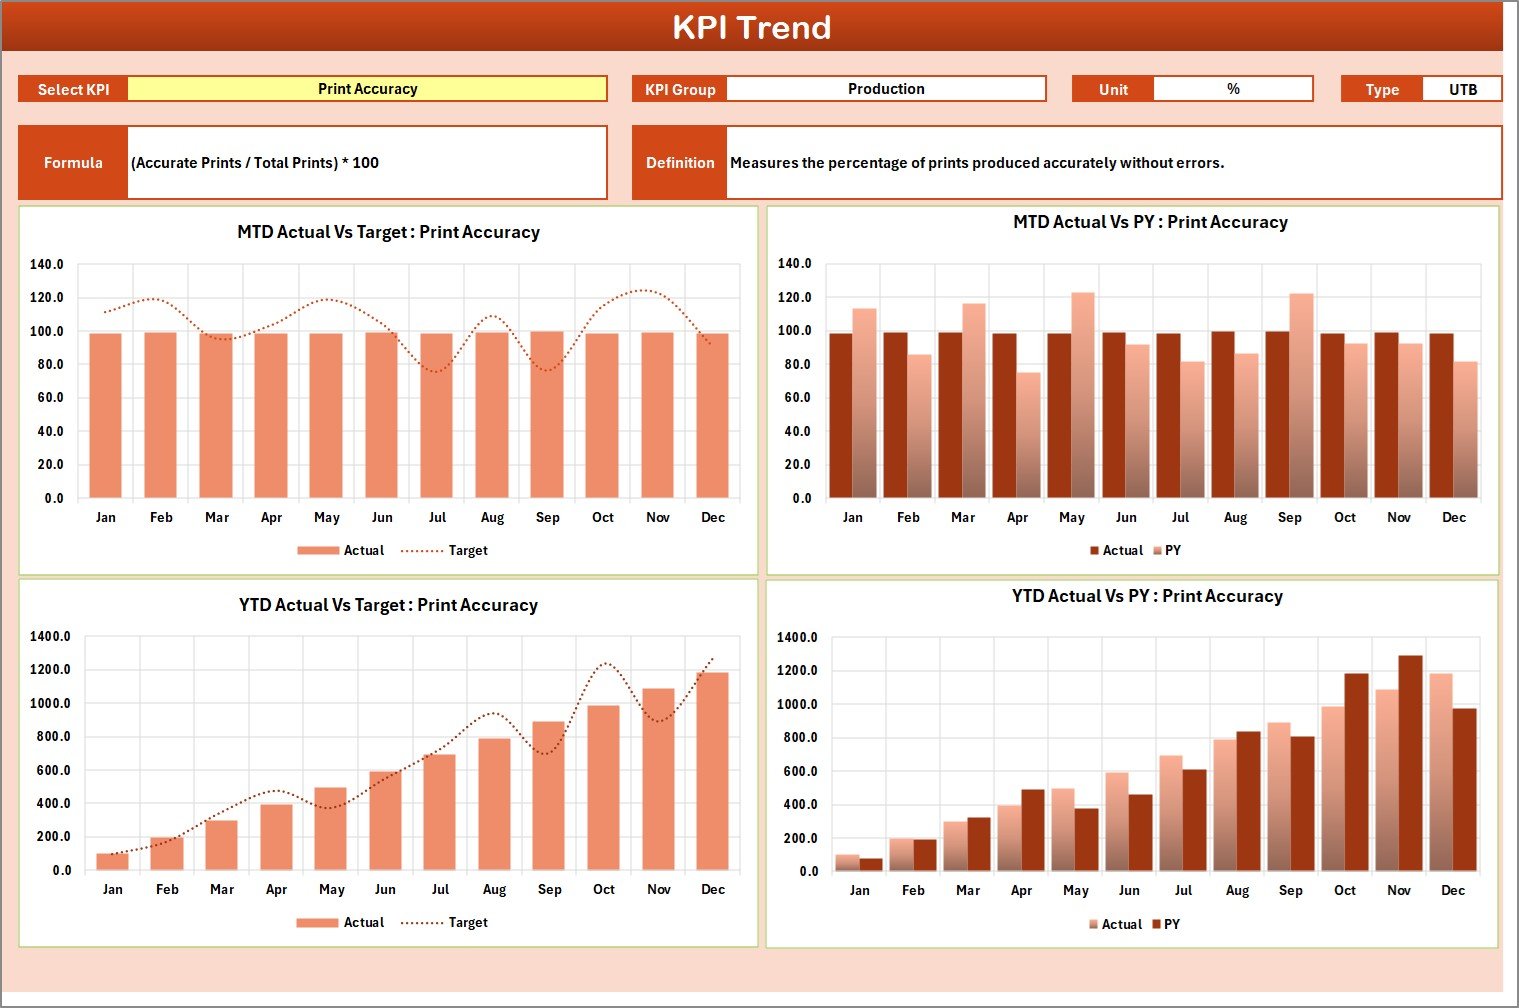
The KPI Trend Sheet allows users to explore detailed performance patterns for individual KPIs.
Key Highlights:
-
Dropdown Selector (Cell C3): Choose a KPI name to view its performance history.
-
Automatic Details: Displays the KPI Group, Unit, Type (Lower-the-Better or Upper-the-Better), Formula, and Definition.
-
Trend Charts: MTD and YTD graphs compare Actual, Target, and Previous Year (PY) data.
-
Performance Analysis: Helps you assess improvement, stability, or decline in key areas.
This worksheet is ideal for reporting and long-term performance assessment.
3. 🧾 Input Data Sheet — The Data Engine
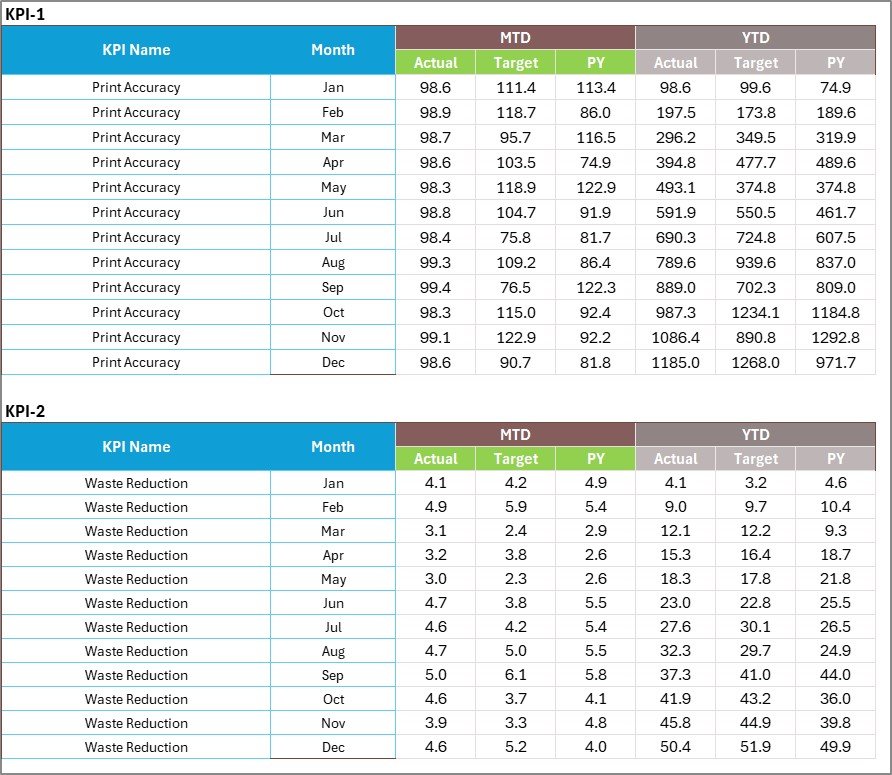
The Input Data Sheet is where all raw KPI data is entered or imported. It forms the foundation for dashboard calculations.
Features:
-
Simple Data Entry: Add monthly actual, target, and PY data for each KPI.
-
Automatic Calculations: MTD and YTD values update dynamically.
-
Editable and Flexible: You can modify or extend data as your operations evolve.
This sheet ensures your dashboard always reflects the latest and most accurate performance information.
4. 📘 KPI Definition Sheet — Clarity and Consistency
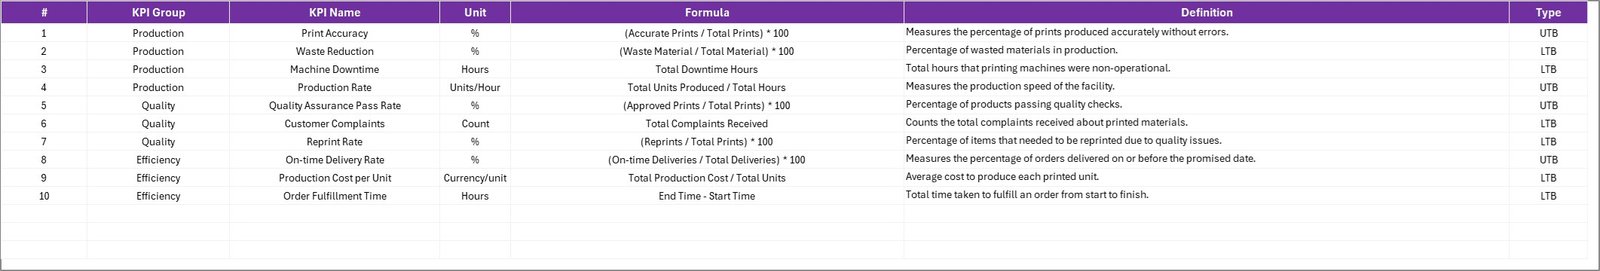
The KPI Definition Sheet lists all KPIs along with their details to ensure consistent understanding across the organization.
Included Fields:
-
KPI Name and KPI Group
-
Unit of Measurement (e.g., %, Hours, Units, USD)
-
Formula Used
-
Definition and Calculation Logic
Maintaining clear definitions prevents confusion and aligns teams toward shared goals.
🏭 Why Use a KPI Scorecard for Printing and Publishing?
The printing and publishing sector involves multiple processes — from creative design and production to marketing and sales. Monitoring them manually can be time-consuming and prone to errors.
A KPI Scorecard simplifies this by providing:
-
A centralized performance view for all departments
-
Instant comparisons between actual results and targets
-
Early alerts when performance deviates from expected levels
By using this tool, managers gain real-time insights into operational efficiency, cost control, and quality performance — all crucial for maintaining profitability in a competitive industry.
Click to Purchases Printing and Publishing KPI Scorecard in Excel
⚙️ How to Use the Printing and Publishing KPI Scorecard
Using the template is quick and straightforward:
-
Open the Excel Template.
-
Enter KPI Data: Add actual, target, and previous year values in the Input Data sheet.
-
Review the Scorecard Sheet: Analyze KPI performance month-wise.
-
Switch Views: Toggle between MTD and YTD for short-term and cumulative analysis.
-
View Trends: Explore KPI trends over time in the KPI Trend sheet.
-
Update Definitions: Modify KPI names or groups in the KPI Definition sheet as needed.
This intuitive process ensures everyone — from production heads to financial controllers — can evaluate performance without advanced Excel knowledge.
🌟 Advantages of Using the Printing and Publishing KPI Scorecard in Excel
Implementing this scorecard brings measurable improvements across departments.
✅ 1. Real-Time Visibility
Quickly identify performance gaps and strengths with live updates.
✅ 2. Improved Efficiency
Automated calculations and visuals reduce manual reporting time.
✅ 3. Enhanced Decision-Making
Managers get actionable insights to optimize production, costs, and sales.
✅ 4. Centralized Data Tracking
All KPIs, definitions, and targets are stored in one unified Excel file.
✅ 5. Visual Performance Indicators
Color-coded symbols and arrows make data interpretation faster and easier.
✅ 6. Cost-Effective Tool
Unlike complex business software, Excel provides similar functionality at minimal cost.
✅ 7. Customizable and Scalable
Add or remove KPIs as your business priorities evolve.
💡 Why Excel Is Ideal for KPI Tracking
Excel remains a trusted performance management platform because it’s accessible, powerful, and flexible.
Key Reasons:
-
Widely used across industries
-
No expensive software subscription needed
-
Fully customizable for unique KPI structures
-
Integration with Power BI and Google Sheets for advanced reporting
-
Dynamic charts and pivot tables for quick visualization
This makes Excel a perfect fit for both small publishers and large print houses.
🧠 Best Practices for Using the KPI Scorecard
To ensure accurate and actionable insights, follow these best practices:
-
Keep KPIs Simple and Relevant. Focus on metrics that directly impact performance.
-
Set Clear Targets. Base them on realistic historical data.
-
Update Monthly. Keep MTD and YTD data fresh for timely decisions.
-
Validate Data Sources. Check the accuracy of figures before analysis.
-
Use Color Coding Wisely. Ensure visual indicators communicate clearly.
-
Conduct Regular Reviews. Evaluate monthly and quarterly performance.
-
Document All KPIs. Maintain consistency across departments.
-
Train Team Members. Everyone should know how to interpret results.
-
Automate Where Possible. Use formulas and dropdowns to reduce manual errors.
-
Back Up Files. Always save a copy of the latest version.
⚠️ Common Mistakes to Avoid
Even experienced teams sometimes mismanage scorecards. Avoid these pitfalls:
-
Tracking too many KPIs at once
-
Inconsistent target-setting
-
Ignoring visual performance cues
-
Using outdated data for analysis
-
Overcomplicating charts or formulas
A well-structured, simple dashboard always delivers better clarity and engagement.
📘 Example Use Case: A Printing Press Success Story
A mid-sized printing press used this Excel KPI Scorecard to monitor production and sales performance.
Within four months, they achieved:
-
15% improvement in on-time deliveries by tracking delivery KPIs
-
20% reduction in paper wastage using the efficiency metrics
-
Higher profitability by identifying high-margin publications
-
Streamlined reporting, saving several hours of manual data compilation
This case proves that tracking KPIs visually drives real results across printing and publishing workflows.
Click to Purchases Printing and Publishing KPI Scorecard in Excel
🧮 Customizing the KPI Scorecard Template
The template is fully editable, letting you align it with your company’s unique needs.
You can:
-
Add new KPIs and groups
-
Modify formulas for specific metrics
-
Update chart formats and colors
-
Integrate data with Power BI for advanced visuals
-
Protect sheets to prevent accidental edits
Excel’s flexibility makes it simple to adapt the template for digital publishing, offset printing, or online content operations.
🧾 Review and Reporting Frequency
To maximize value, monitor and report performance consistently:
-
Monthly: For MTD comparisons and immediate corrective actions.
-
Quarterly: For trend analysis and cumulative YTD review.
-
Annually: For strategic assessment and future goal setting.
Regular tracking ensures sustainable improvements in productivity and profitability.
📈 Benefits for Different Roles
👨💼 Managers
Get a 360° view of company performance and quick decision insights.
👩💻 Analysts
Access historical trends and identify performance bottlenecks.
🧾 Finance Teams
Track cost per publication and revenue margins for budgeting.
📦 Operations Staff
Monitor production output, downtime, and efficiency ratios.
📢 Marketing Teams
Measure campaign impact and customer acquisition rates.
Each department can use the scorecard differently — yet all share a single source of truth for data.
🔧 Practical Tips for Smooth Implementation
-
Start with 10–12 KPIs, then expand gradually.
-
Involve cross-functional teams to define metrics collaboratively.
-
Use pivot tables for department-specific reports.
-
Create monthly KPI meetings to review results together.
-
Celebrate improvements to motivate teams.
When teams see progress visually, performance accountability improves automatically.
🏁 Conclusion
The Printing and Publishing KPI Scorecard in Excel is a powerful yet user-friendly solution for measuring, managing, and improving performance.
By organizing critical data into one interactive interface, it empowers organizations to boost efficiency, reduce costs, and enhance quality — all without investing in complex business intelligence tools.
Whether you manage offset printing, magazine production, or digital content publishing, this Excel scorecard ensures your performance stays transparent, measurable, and actionable.
With consistent use, your business can move from reactive to proactive — making every print, every page, and every process count.
Click to Purchases Printing and Publishing KPI Scorecard in Excel
❓ Frequently Asked Questions (FAQs)
1. What is the purpose of the Printing and Publishing KPI Scorecard?
It helps monitor production, quality, and sales KPIs in one place, improving decision-making and operational efficiency.
2. How many KPIs can I track?
You can start with 10–15 KPIs and expand as your business evolves.
3. Is this template suitable for small printing businesses?
Yes, it’s designed for organizations of all sizes — from small print shops to large media houses.
4. How do I update the dashboard each month?
Enter actual and target values in the Input Data sheet; the Scorecard updates automatically.
5. Can I add new KPIs or change formulas?
Absolutely. The template is fully customizable in Excel.
6. What does MTD and YTD mean?
MTD stands for Month-to-Date, and YTD means Year-to-Date — both help track progress over different time frames.
7. How does color coding work?
Conditional formatting automatically changes cell colors to show if performance meets, exceeds, or falls short of targets.
8. Does it support previous year comparisons?
Yes, you can compare Actual, Target, and Previous Year data in both Scorecard and Trend sheets.
9. Can I share this scorecard with others?
Yes, it can be shared via Excel or OneDrive for collaborative performance tracking.
10. Why use Excel instead of specialized software?
Excel is affordable, easy to use, flexible, and doesn’t require coding or subscription fees — perfect for publishing operations.
Click to Purchases Printing and Publishing KPI Scorecard in Excel
Visit our YouTube channel to learn step-by-step video tutorials