In the luxury retail world, precision and presentation matter as much as performance. The jewellery and watches industry thrives on craftsmanship, customer experience, and operational efficiency. To stay competitive, businesses must track performance indicators that reflect both financial health and customer satisfaction.
That’s where the Jewellery and Watches KPI Dashboard in Excel comes in — a smart, ready-to-use analytics tool that brings clarity, structure, and insight to your business performance.
This guide explains everything you need to know about this Excel-based KPI dashboard — including its structure, benefits, and best practices — to help you make data-driven decisions that drive sustainable growth.
Click to Purchases Jewellery and Watches KPI Dashboard in Excel
💡 What Is a Jewellery and Watches KPI Dashboard in Excel?
A Jewellery and Watches KPI Dashboard in Excel is an interactive and data-driven tool designed to monitor, analyze, and visualize key performance indicators (KPIs) in the jewellery and luxury watch sector.
It consolidates critical data — such as sales, margins, inventory turnover, customer satisfaction, and marketing effectiveness — into a single, easy-to-use Excel file.
Using dropdowns, formulas, and charts, the dashboard automatically displays Month-to-Date (MTD) and Year-to-Date (YTD) performance. It compares results with targets and previous years, providing instant visual insights through arrows and conditional formatting.
Whether you’re a retail manager, brand owner, or regional sales director, this dashboard simplifies complex data into actionable insights.
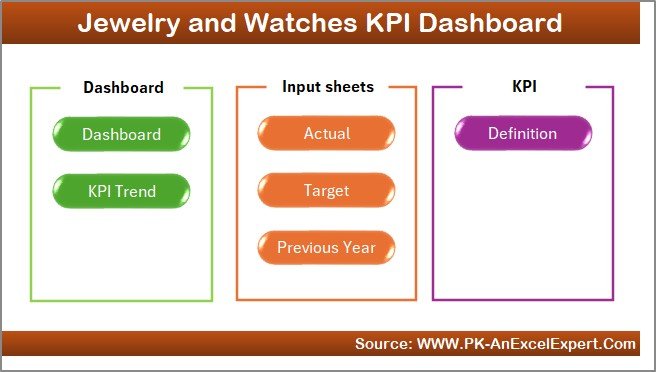
🧩 Structure of the Jewellery and Watches KPI Dashboard Template
This template is designed with seven worksheets, each serving a distinct function in your data management and analysis process.
1. 🏠 Home Sheet – The Navigation Hub
The Home Sheet serves as your main control panel.
It includes six clickable buttons that allow you to jump directly to the key worksheets in the file.
-
Provides a user-friendly layout.
-
Helps new users quickly navigate to KPI dashboards and data sheets.
-
Keeps the file organized and easy to use.
2. 📊 Dashboard Sheet – The Central Performance View
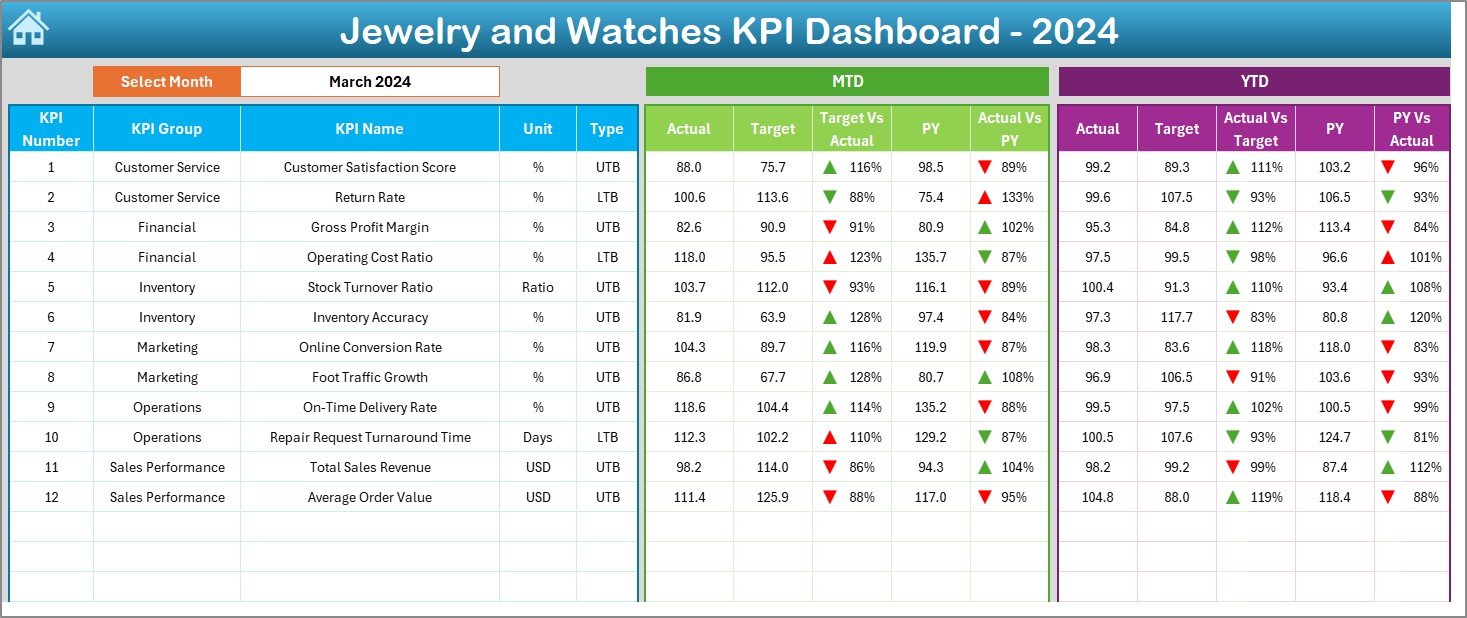
The Dashboard Sheet is where all your performance insights come together.
Features:
-
Month Selection Dropdown (Cell D3): Choose any month and the dashboard instantly updates.
-
MTD and YTD Metrics: Track Actual, Target, and Previous Year data side by side.
-
Conditional Formatting: Visual indicators (arrows and colors) highlight performance trends.
-
Target vs Actual Comparison: See where your KPIs are exceeding or missing expectations.
-
Comprehensive Overview: Displays multiple KPIs with clarity for quick executive summaries.
This is the main page used for management reviews and decision-making.
3. 📈 KPI Trend Sheet – Tracking Progress Over Time
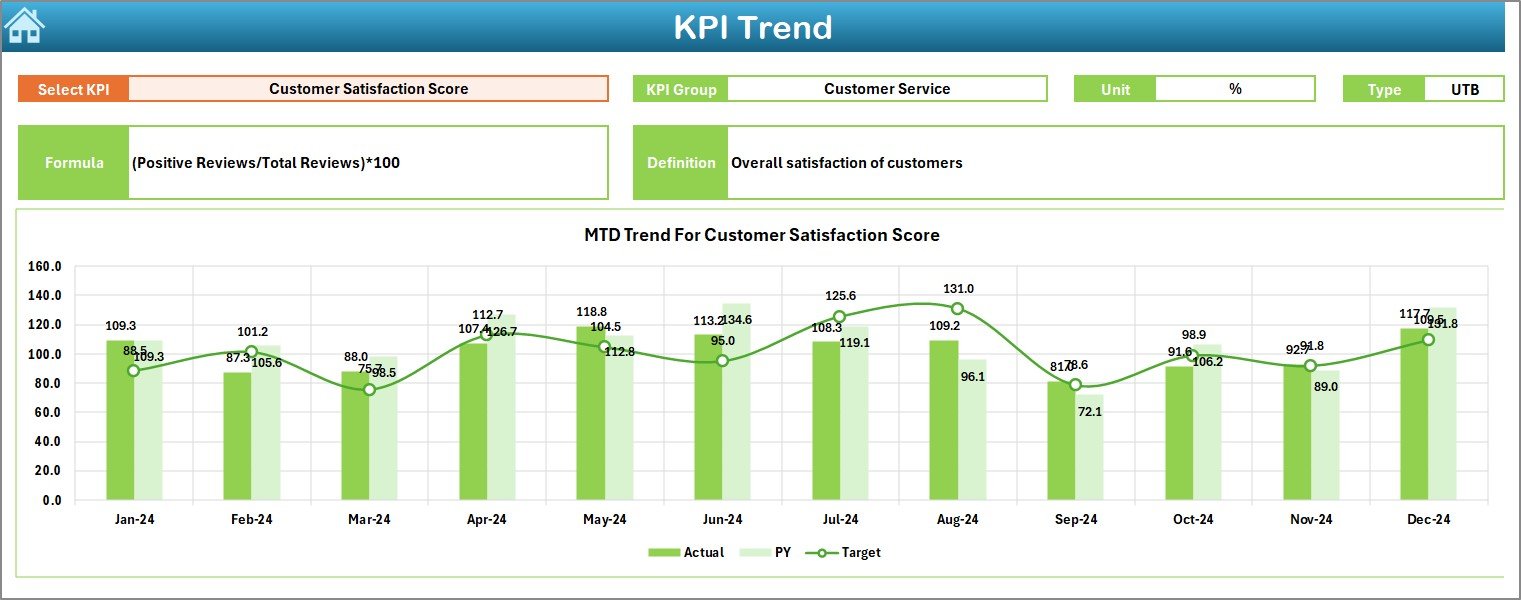
The KPI Trend Sheet is built for detailed performance tracking.
Functions:
-
Dropdown (Cell C3): Select a KPI to view its historical trend.
-
Displays KPI Group, Unit, Type (Upper-the-Better or Lower-the-Better), Formula, and Definition.
-
Charts: Shows MTD and YTD trend lines for Actual, Target, and Previous Year values.
-
Provides a clear view of performance patterns and seasonal fluctuations.
This sheet is ideal for identifying growth opportunities and recurring challenges.
4. 🧾 Actual Numbers Input Sheet – Your Data Source
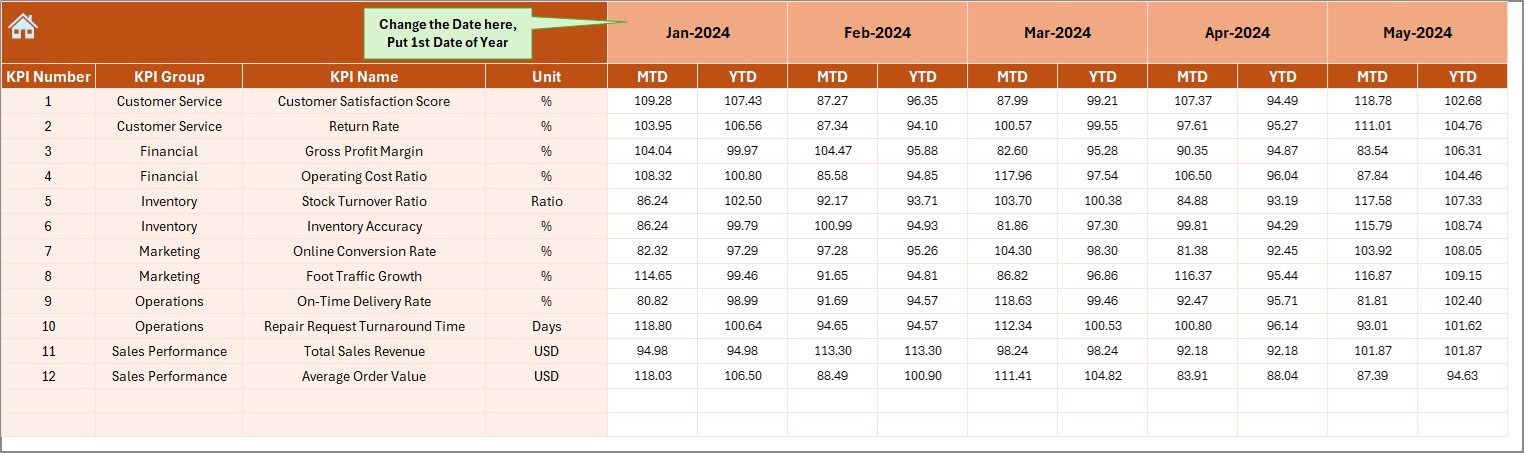
The Actual Numbers Input Sheet is where you record all real performance values.
Key Details:
-
Input both MTD and YTD numbers for each KPI.
-
Use Cell E1 to define the first month of the financial year.
-
Data automatically feeds into dashboard visuals and trend analysis.
This sheet ensures data accuracy and eliminates manual calculations.
5. 🎯 Target Sheet – Setting Your Goals
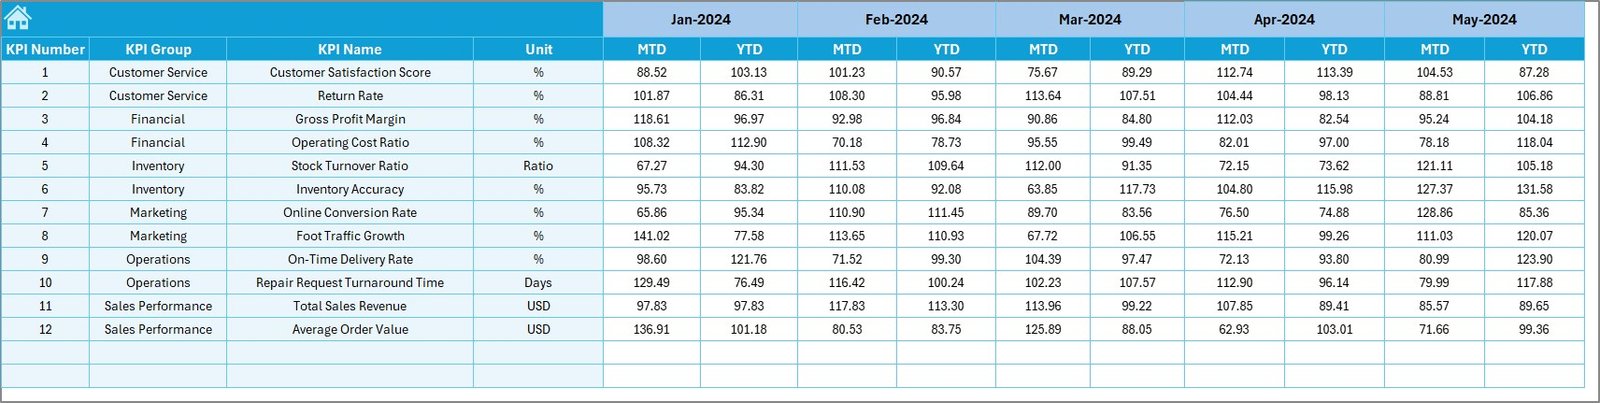
This sheet is where you define the target values for every KPI.
Benefits:
-
Create MTD and YTD targets per month.
-
Align performance expectations across teams.
-
Enable clear comparison with actual and previous year figures.
Consistent goal-setting helps maintain accountability across your organization.
6. 🕰️ Previous Year Numbers Sheet – Benchmarking Performance
Historical data is essential for understanding growth.
In this sheet, you record the previous year’s KPI values.
Purpose:
-
Track year-over-year improvements.
-
Identify recurring sales trends or dips.
-
Support long-term forecasting and budgeting.
This historical reference is the backbone for performance benchmarking.
7. 📘 KPI Definition Sheet – Consistency and Clarity
The KPI Definition Sheet maintains a clear reference for all performance metrics.
It includes:
-
KPI Name
-
KPI Group (e.g., Sales, Inventory, Customer Experience, Finance)
-
Unit of Measurement
-
Formula
-
KPI Definition
This structure ensures that all team members evaluate performance using consistent parameters.
Click to Purchases Jewellery and Watches KPI Dashboard in Excel
⚙️ How to Use the Jewellery and Watches KPI Dashboard
Here’s how to get started with this Excel dashboard:
-
Open the Template: Launch the Excel file.
-
Enter Actual Data: Go to the Actual Numbers Input sheet and fill in monthly values.
-
Set Targets: Define MTD and YTD goals in the Target sheet.
-
Add Historical Data: Record last year’s performance in the Previous Year Numbers sheet.
-
Review Dashboard: Switch between months to view real-time updates.
-
Analyze Trends: Use the KPI Trend Sheet for long-term performance evaluation.
With just a few clicks, you can analyze every aspect of your jewellery and watch business.
🌟 Advantages of Using the Jewellery and Watches KPI Dashboard in Excel
✅ 1. Centralized Performance Tracking
View all key metrics — from sales to inventory — in one unified dashboard.
✅ 2. Real-Time Insights
Automatically update and visualize data month by month.
✅ 3. Strategic Decision-Making
Instantly identify profitable product lines and underperforming categories.
✅ 4. Accurate Target Monitoring
Compare actual vs. target values with clear conditional indicators.
✅ 5. Cost-Effective Solution
No need for expensive analytics software — Excel does it all.
✅ 6. Customizable Template
Add or modify KPIs according to your retail strategy.
✅ 7. Historical Benchmarking
Compare current year results with past data for better forecasting.
💼 Why Jewellery and Watch Retailers Need KPI Dashboards
The jewellery and luxury watch industry depends on fine margins and impeccable timing. Performance dashboards provide transparency and control in five critical areas:
-
Sales Performance: Measure daily, monthly, and yearly sales by product category.
-
Customer Experience: Track satisfaction scores and repeat purchase rates.
-
Inventory Control: Prevent overstocking or stockouts of high-value items.
-
Marketing ROI: Evaluate campaign success and conversion rates.
-
Financial Efficiency: Monitor costs, profits, and revenue growth.
With accurate KPI tracking, managers can optimize store operations and maximize return on investment.
Click to Purchases Jewellery and Watches KPI Dashboard in Excel
🧠 Best Practices for Using the Dashboard
Follow these best practices to achieve the best results:
-
Keep KPIs Relevant: Focus on metrics that directly impact your business goals.
-
Update Monthly: Regular updates ensure timely insights.
-
Validate Data Sources: Check that numbers match POS or ERP systems.
-
Use Visual Cues Wisely: Arrows and colors should clarify — not clutter — the dashboard.
-
Review Yearly Trends: Use the trend sheet for long-term strategy development.
-
Empower Teams: Share performance reports during review meetings.
-
Protect Data Integrity: Lock key sheets or formulas to prevent accidental edits.
-
Maintain Historical Data: Keep previous years’ results for benchmarking.
-
Integrate for Growth: Export Excel data into Power BI for interactive visuals.
-
Train Key Users: Ensure all staff understand KPI definitions and usage.
⚠️ Common Mistakes to Avoid
Avoid these pitfalls for accurate reporting:
-
Tracking too many irrelevant KPIs.
-
Ignoring regular updates to data sheets.
-
Mixing inconsistent data units (e.g., $ and €).
-
Overcomplicating visuals with excessive formatting.
-
Neglecting to review YTD and PY comparisons.
Consistency ensures clarity — the key to actionable analytics.
📘 Example Case: Jewellery Chain Performance Improvement
Click to Purchases Jewellery and Watches KPI Dashboard in Excel
A regional jewellery chain implemented this Excel KPI dashboard across five stores. Within six months:
-
Sales increased by 14% due to improved product category insights.
-
Inventory holding cost dropped by 10% after identifying slow-moving SKUs.
-
Customer retention rose by 8%, driven by focused engagement metrics.
-
Reporting time reduced by 70%, thanks to automated data updates.
This proves that even small businesses can achieve measurable impact using Excel-based KPI dashboards.
🔍 Why Excel Is Ideal for Jewellery and Watches KPI Tracking
-
Accessible and Familiar: Every team member can use Excel without training.
-
Completely Customizable: Add, delete, or modify KPIs effortlessly.
-
Cost-Efficient: No expensive software licenses required.
-
Data Integration: Connect Excel with CRM or ERP systems easily.
-
Visual Analytics: Use charts, slicers, and conditional formatting for instant clarity.
Excel remains the most flexible platform for performance analysis across all business sizes.
🧾 Reporting and Review Schedule
For effective monitoring, follow this review schedule:
-
Weekly: Check sales and inventory movement.
-
Monthly: Evaluate MTD and YTD results.
-
Quarterly: Analyze trend patterns and customer engagement.
-
Annually: Assess full-year performance and plan targets for the next year.
Regular reviews ensure sustained performance and growth.
🏁 Conclusion
The Jewellery and Watches KPI Dashboard in Excel is more than just a spreadsheet — it’s a comprehensive business intelligence tool designed for the luxury retail world.
It helps you track sales, monitor profitability, optimize inventory, and enhance customer engagement — all from one place.
By leveraging Excel’s simplicity and power, this dashboard transforms data into decisions, allowing your business to shine as brightly as your products.
Start tracking your KPIs today — and turn insights into measurable growth.
Click to Purchases Jewellery and Watches KPI Dashboard in Excel
❓ Frequently Asked Questions (FAQs)
1. What is the purpose of this dashboard?
It helps jewellery and watch retailers monitor performance across sales, inventory, and customer satisfaction metrics.
2. How many KPIs can I include?
You can start with 12–15 KPIs and expand as needed.
3. Is it suitable for small stores?
Yes, it’s ideal for both single boutiques and multi-store operations.
4. Can I modify KPIs or add new ones?
Yes, the dashboard is fully customizable in Excel.
5. What do MTD and YTD mean?
MTD means Month-to-Date, and YTD stands for Year-to-Date.
6. How are performance comparisons shown?
Conditional arrows and color coding display Target vs Actual and PY vs Actual results.
7. Does it require coding or macros?
No, it works entirely with Excel formulas and dropdowns.
8. Can I track multiple stores?
Yes, you can add columns or filters for store-wise performance.
9. How do I ensure data accuracy?
Regularly validate data against sales or ERP systems before updating.
10. Why should I use Excel for KPI tracking?
It’s affordable, easy to use, and offers robust analytical features for all business sizes.
Click to Purchases Jewellery and Watches KPI Dashboard in Excel
Visit our YouTube channel to learn step-by-step video tutorials