Content marketing has become one of the most powerful strategies for building brand awareness, generating leads, and increasing customer engagement. However, many marketing teams struggle to measure the real impact of their content efforts. When teams track metrics using scattered reports or manual spreadsheets, they often miss valuable insights.
Therefore, organizations increasingly rely on KPI scorecards to monitor content marketing performance in a structured and measurable way. A well-designed KPI scorecard allows marketers to track content performance metrics, compare targets with results, and identify improvement opportunities.
That is exactly where the Content Marketing KPI Scorecard in Excel becomes a valuable analytics tool.
This ready-to-use Excel template helps marketing teams monitor key performance indicators related to content marketing campaigns, website traffic, engagement metrics, and lead generation. Instead of analyzing multiple reports, teams can evaluate content marketing performance through a single interactive scorecard.
In this detailed guide, you will learn:
-
What a Content Marketing KPI Scorecard in Excel is
-
Why businesses need content marketing KPI tracking
-
Key features of this Excel scorecard template
-
Advantages of using the scorecard
-
Best practices for managing content marketing KPIs
-
Frequently asked questions
Let’s explore everything step by step.
Click to Purchases Content Marketing KPI Scorecard in Excel
What Is a Content Marketing KPI Scorecard in Excel?
A Content Marketing KPI Scorecard in Excel is a structured performance monitoring tool that tracks key metrics related to content marketing activities.
Instead of reviewing different reports from various marketing tools, this scorecard consolidates all important content performance metrics into a single dashboard.
The scorecard helps teams track metrics such as:
-
Website traffic from content
-
Blog engagement rates
-
Social media interactions
-
Lead generation from content campaigns
-
Content conversion rates
-
Content publishing frequency
Because the template compares Actual values, Target values, and Previous Year performance, marketers can easily evaluate whether their content strategies perform effectively.
Moreover, Excel’s interactive features such as dropdown filters, conditional formatting, and charts allow marketing teams to analyze KPI performance quickly.
Why Do Businesses Need a Content Marketing KPI Scorecard?
Content marketing involves multiple activities including blog publishing, SEO optimization, social media promotion, email marketing, and audience engagement.
Without a structured KPI tracking system, marketing teams often face several challenges such as:
-
Difficulty measuring campaign performance
-
Lack of visibility into marketing results
-
Poor alignment with marketing goals
-
Inefficient decision-making
However, when businesses use a Content Marketing KPI Scorecard, they gain valuable insights into marketing performance.
For example, the scorecard helps marketers:
-
Track content marketing performance
-
Compare results with targets
-
Monitor campaign effectiveness
-
Identify high-performing content
-
Improve marketing strategies
Consequently, businesses can make smarter marketing decisions based on data.
Click to Purchases Content Marketing KPI Scorecard in Excel
Key Features of the Content Marketing KPI Scorecard in Excel
This ready-to-use Excel template includes several powerful features that simplify KPI monitoring.
The template contains four worksheets, each designed for a specific purpose.
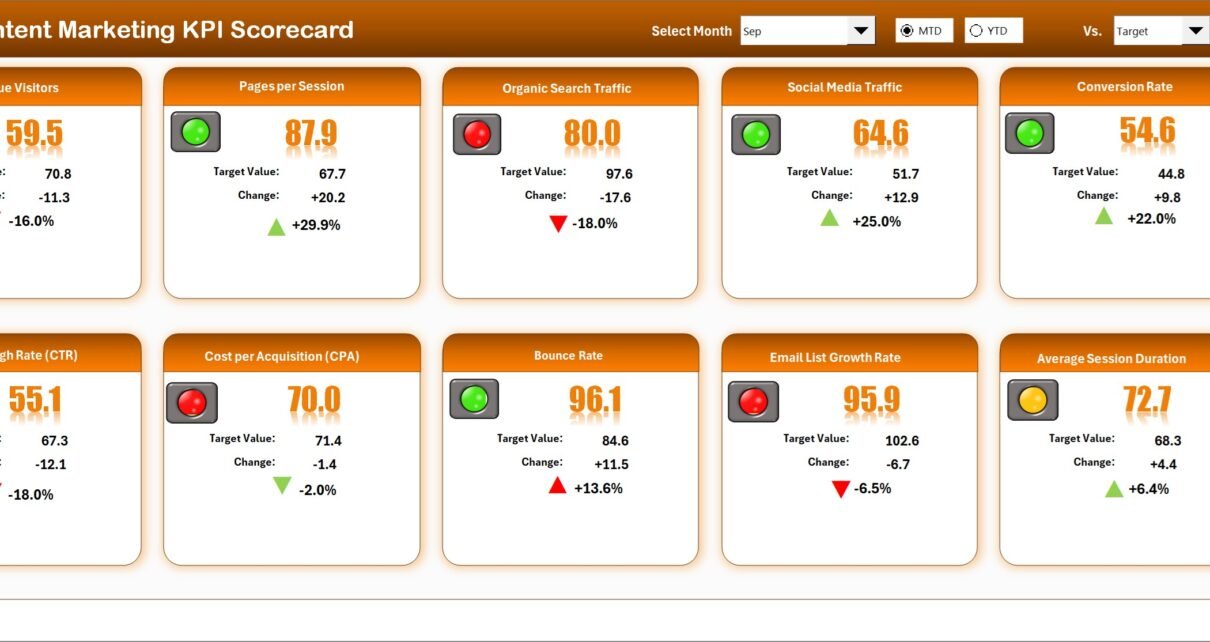
1. Scorecard Sheet – Main KPI Monitoring Page
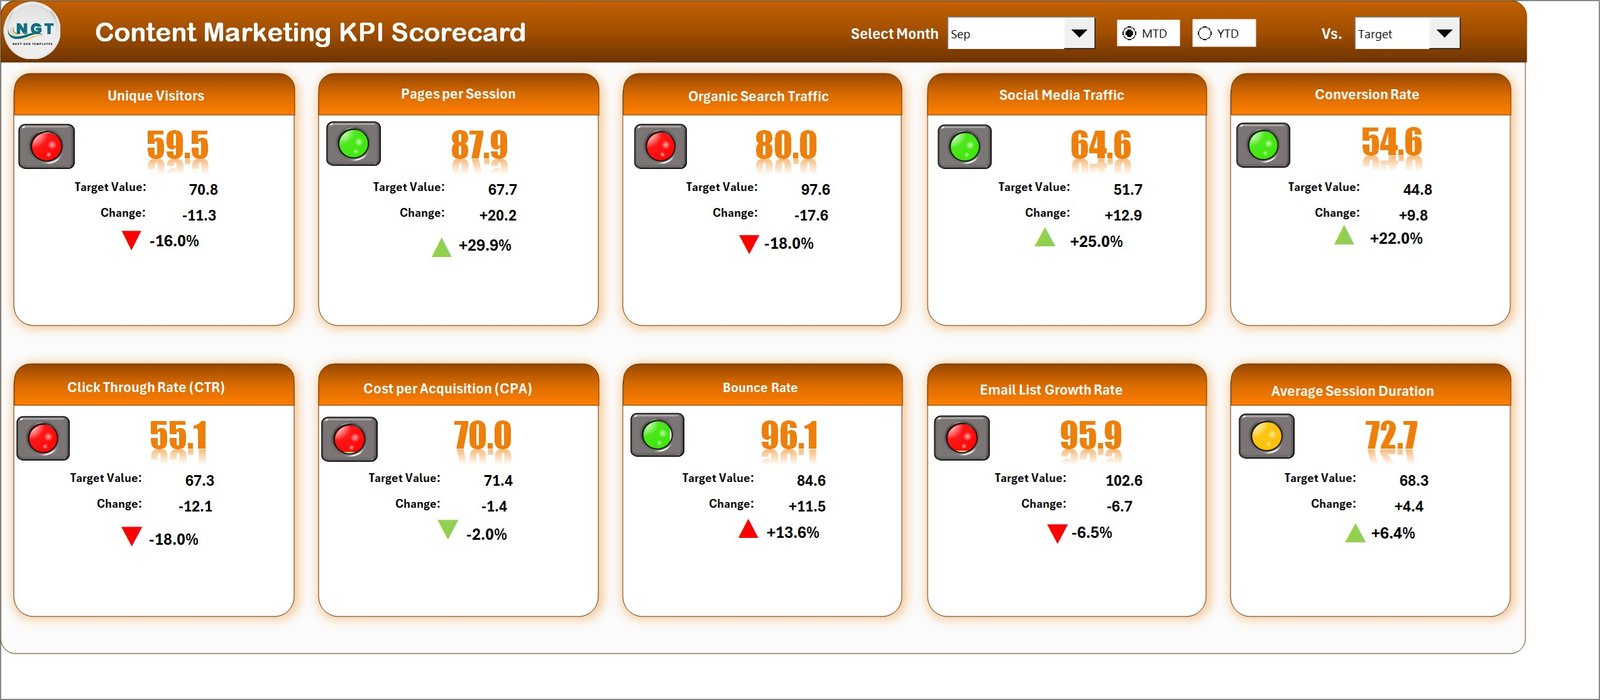
The Scorecard Sheet acts as the central interface of the template.
This page allows users to view the overall performance of content marketing KPIs.
Dropdown Menus for Performance Analysis
At the top of the sheet, users can select performance filters.
These dropdown menus allow users to choose:
-
The Month
-
MTD (Month-to-Date)
-
YTD (Year-to-Date)
Once a selection is made, the scorecard automatically updates the KPI metrics.
Actual vs Target Comparison
The scorecard displays both Actual values and Target values for each KPI.
This comparison helps marketing teams determine whether their content campaigns meet performance expectations.
For example, teams can easily see whether:
-
Blog traffic meets the monthly target
-
Content engagement exceeds expectations
-
Lead generation meets campaign goals
Visual Performance Indicators
The template uses conditional formatting and color-coded indicators to highlight KPI performance.
These indicators help users quickly identify performance status.
For example:
-
Green indicators represent strong performance
-
Red indicators highlight areas needing improvement
Therefore, marketing teams can immediately identify which KPIs require attention.
Comprehensive KPI Overview
The scorecard displays complete KPI information including:
-
KPI group
-
KPI name
-
Unit of measurement
-
MTD performance
-
YTD performance
This centralized overview helps teams analyze content marketing performance quickly.
Click to Purchases Content Marketing KPI Scorecard in Excel
2. KPI Trend Sheet – Performance Trend Analysis
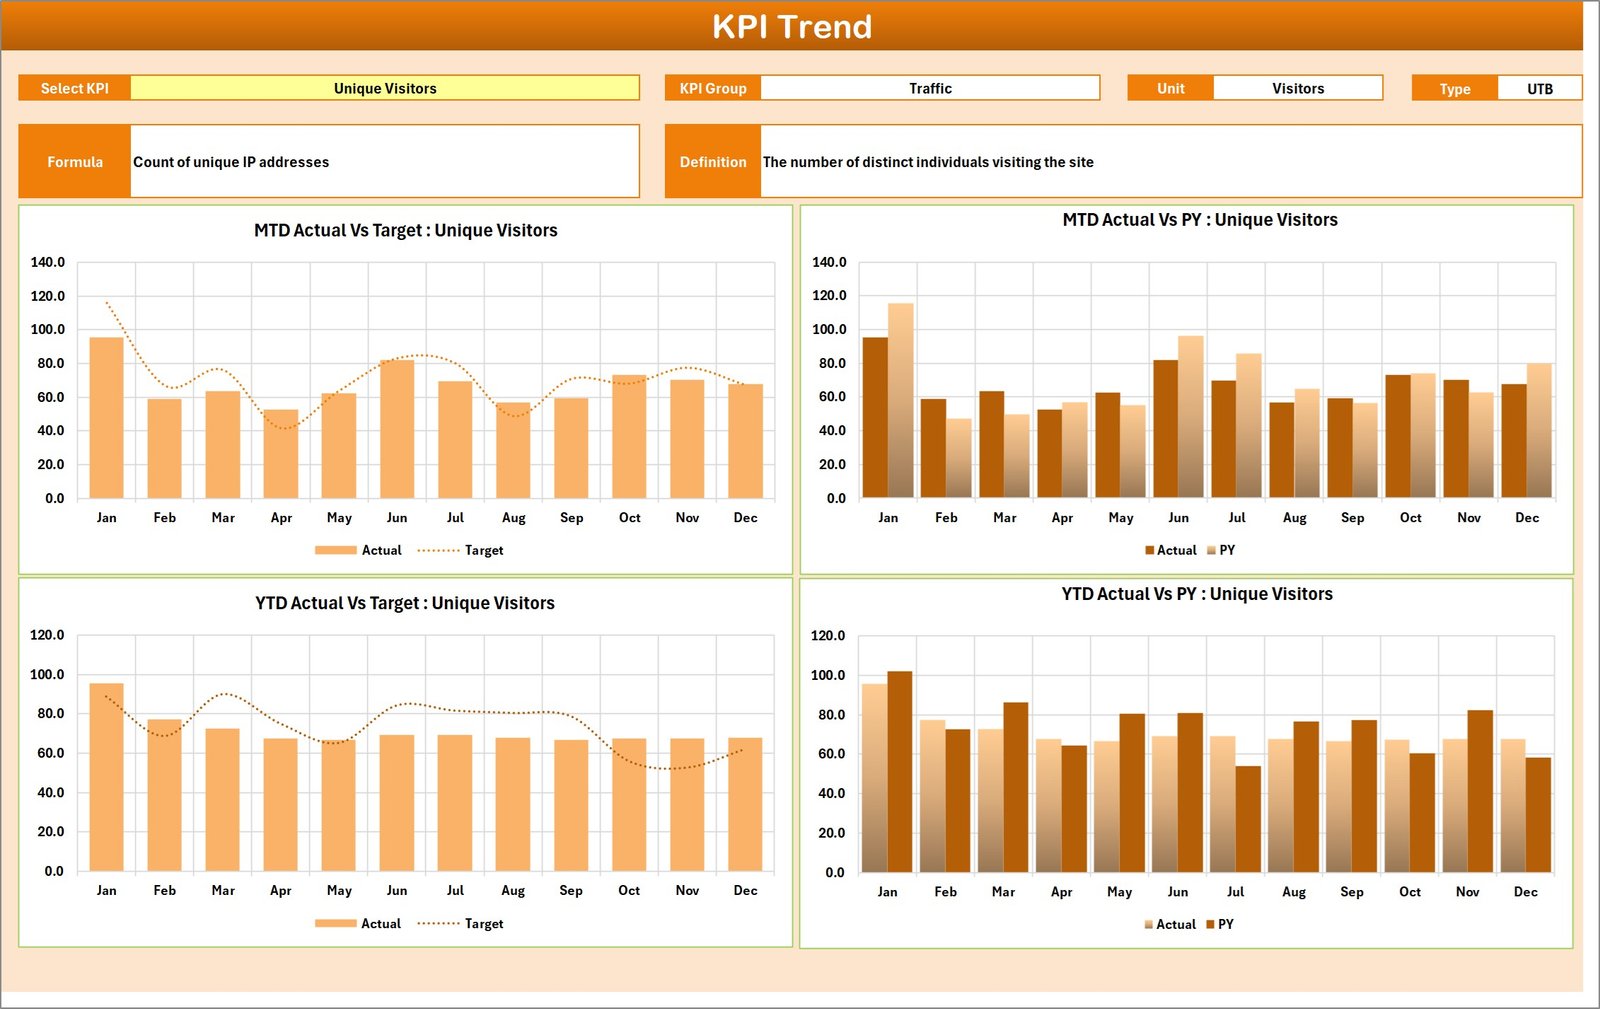
The KPI Trend Sheet helps users analyze how KPI performance changes over time.
Users can select a KPI from the dropdown menu available in cell C3.
Once selected, the sheet displays detailed KPI information such as:
-
KPI Group
-
Unit of KPI
-
KPI Type (Lower the Better or Upper the Better)
-
KPI Formula
-
KPI Definition
Trend Charts for KPI Monitoring
The sheet includes two important charts:
MTD Trend Chart
This chart shows monthly performance trends for the selected KPI.
It compares:
-
Actual performance
-
Target performance
-
Previous year performance
YTD Trend Chart
The YTD chart displays cumulative KPI performance throughout the year.
This allows marketing teams to evaluate long-term performance trends.
Consequently, teams can identify whether their marketing strategies improve over time.
Click to Purchases Content Marketing KPI Scorecard in Excel
3. Input Data Sheet – Data Entry Section
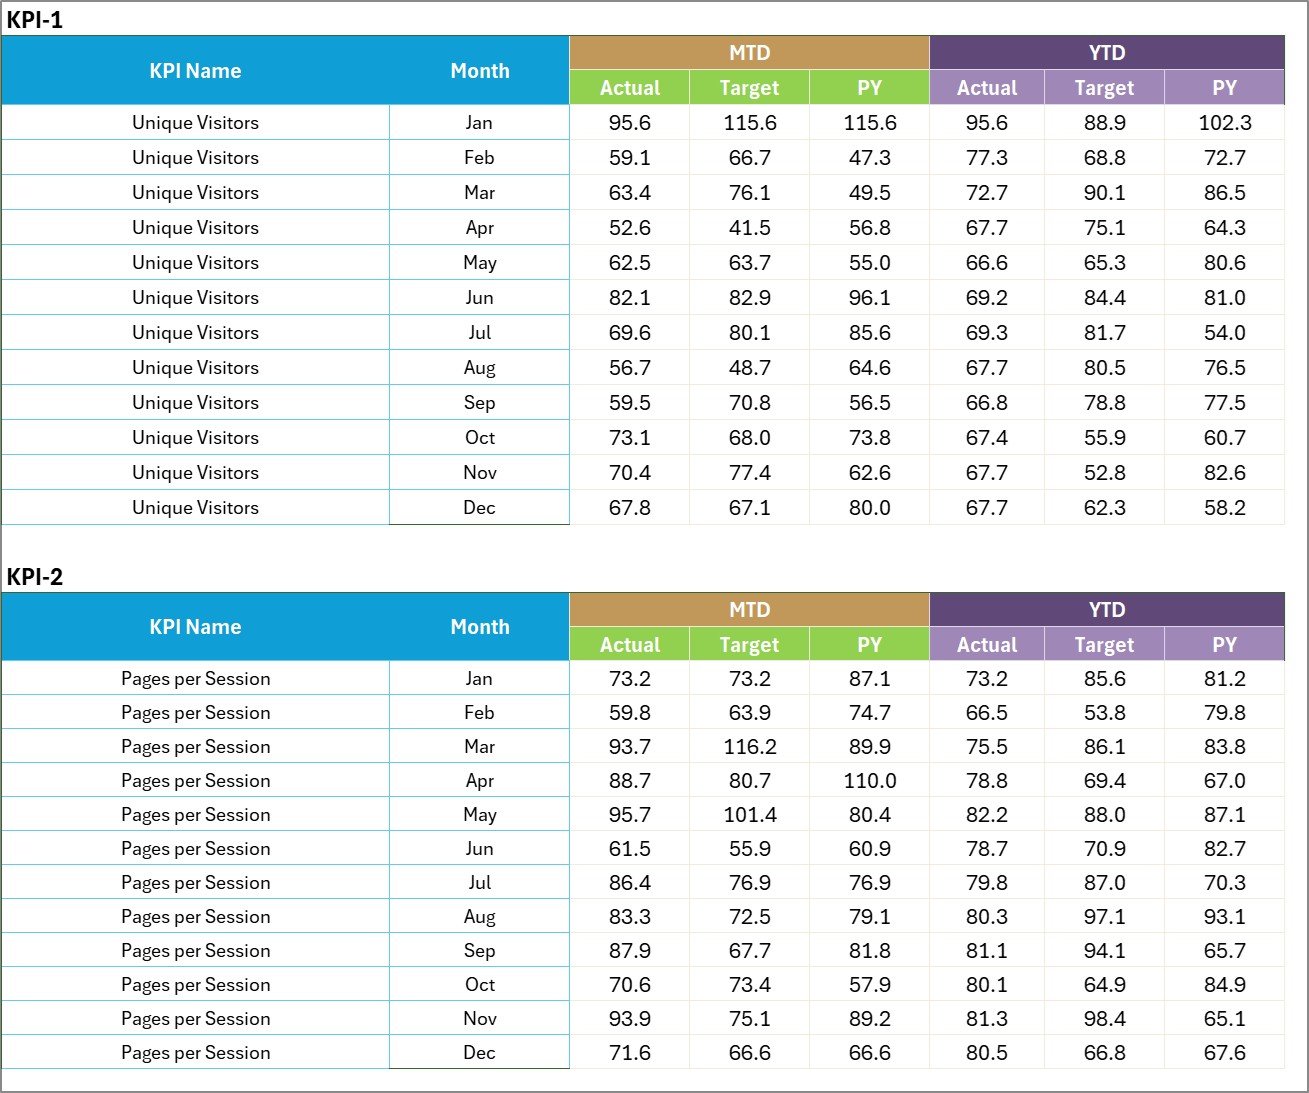
The Input Data Sheet is where users enter all KPI performance data.
This sheet acts as the primary data source for the scorecard.
Users can enter the following information:
-
KPI actual values
-
Target values
-
Monthly results
-
Year-to-date results
Once users update the data, the scorecard automatically refreshes the performance indicators.
Because of this design, teams can easily maintain accurate KPI reports.
Click to Purchases Content Marketing KPI Scorecard in Excel
4. KPI Definition Sheet – KPI Management
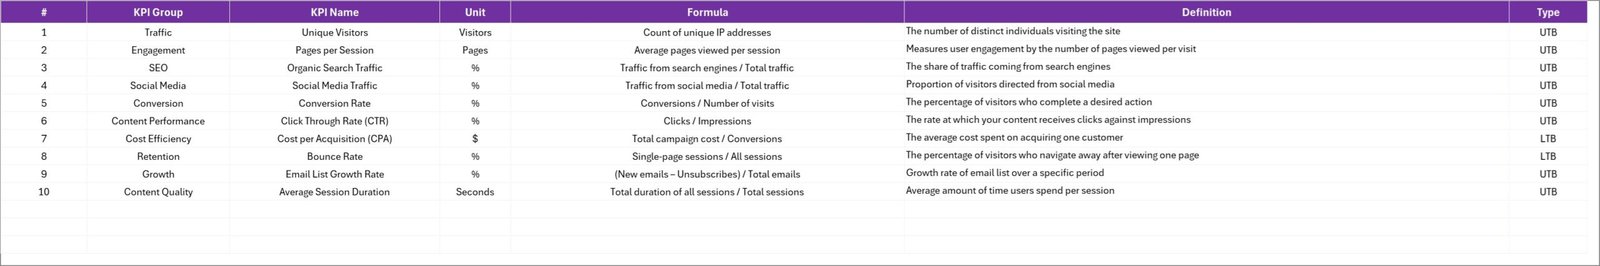
The KPI Definition Sheet stores detailed information about each KPI used in the scorecard.
Users can define:
-
KPI Name
-
KPI Group
-
Unit of measurement
-
KPI Formula
-
KPI Definition
This sheet ensures that every KPI has clear documentation.
As a result, marketing teams understand exactly how each KPI is calculated.
Click to Purchases Content Marketing KPI Scorecard in Excel
Advantages of Content Marketing KPI Scorecard in Excel
Organizations gain many benefits when they use a KPI scorecard for content marketing.
1. Centralized Marketing Performance Monitoring
The scorecard consolidates all marketing performance metrics into one dashboard.
Therefore, teams can analyze campaign performance quickly.
2. Better Marketing Decision Making
When marketers clearly understand performance metrics, they can adjust strategies effectively.
Consequently, marketing campaigns become more data-driven.
3. Improved Content Strategy Optimization
The scorecard highlights high-performing and low-performing content.
Therefore, teams can optimize their content strategy.
4. Clear Performance Visibility
Visual indicators and charts make KPI performance easy to interpret.
This improves reporting and communication within the marketing team.
5. Easy to Use and Customize
Because the scorecard works inside Microsoft Excel, users can customize it easily.
Teams can add new KPIs or modify targets as marketing strategies evolve.
Click to Purchases Content Marketing KPI Scorecard in Excel
Best Practices for the Content Marketing KPI Scorecard
To maximize the benefits of the scorecard, organizations should follow several best practices.
1. Define Clear Content Marketing Goals
Before tracking KPIs, marketing teams should define clear objectives such as:
-
Increasing website traffic
-
Improving engagement rates
-
Generating marketing leads
Clear goals help align KPIs with business outcomes.
2. Select Relevant KPIs
Choose KPIs that directly measure content marketing performance.
Examples include:
-
Blog traffic growth
-
Content engagement rate
-
Social media shares
-
Lead conversion rate
3. Update KPI Data Regularly
Teams should update KPI data frequently.
Regular updates ensure accurate performance monitoring.
4. Analyze KPI Trends
Instead of focusing only on monthly results, teams should review long-term trends.
Trend analysis provides deeper insights into marketing performance.
5. Use KPI Insights to Improve Content Strategy
Marketing teams should use KPI insights to refine content strategies.
This approach improves campaign effectiveness and marketing ROI.
Click to Purchases Content Marketing KPI Scorecard in Excel
How Does This Scorecard Improve Content Marketing Performance?
A structured KPI scorecard transforms the way marketing teams evaluate content performance.
For example, marketing managers can answer critical questions such as:
-
Which content generates the most traffic?
-
Are marketing campaigns meeting engagement targets?
-
Which channels produce the highest leads?
-
Is content performance improving over time?
Because the scorecard provides clear data insights, teams can make informed marketing decisions.
As a result, organizations improve content performance and maximize marketing impact.
Conclusion
Content marketing plays a vital role in modern digital marketing strategies. However, measuring content performance requires structured analytics and reliable reporting.
The Content Marketing KPI Scorecard in Excel provides a powerful solution for monitoring marketing performance.
This ready-to-use template helps marketing teams:
-
Track content marketing KPIs
-
Monitor campaign performance
-
Compare targets with results
-
Analyze performance trends
Because the scorecard consolidates important metrics into one interactive dashboard, marketing teams can easily evaluate campaign success.
Therefore, organizations that use this KPI scorecard can improve content strategies, increase engagement, and achieve better marketing results.
Click to Purchases Content Marketing KPI Scorecard in Excel
Frequently Asked Questions (FAQs)
What is a Content Marketing KPI Scorecard?
A Content Marketing KPI Scorecard is a performance tracking tool used to monitor key metrics related to content marketing campaigns, engagement, and lead generation.
Why should marketing teams track content KPIs?
Tracking KPIs helps marketers measure campaign performance, identify successful content strategies, and improve marketing ROI.
Can Excel handle content marketing analytics?
Yes, Excel provides powerful features such as formulas, charts, and conditional formatting that allow teams to analyze marketing data effectively.
What KPIs are commonly used in content marketing?
Common KPIs include:
-
Website traffic from content
-
Engagement rate
-
Social media shares
-
Content conversion rate
-
Lead generation
Is this KPI scorecard customizable?
Yes, organizations can customize the scorecard by adding new KPIs, adjusting targets, or modifying charts.
Click to Purchases Content Marketing KPI Scorecard in Excel
Visit our YouTube channel to learn step-by-step video tutorials