Running a vocational school involves managing tuition fees, scholarships, attendance, satisfaction, and placement performance — all while maintaining quality education standards.
The Vocational Schools Dashboard in Excel brings all this information together into one interactive and visual platform, helping administrators, educators, and finance teams make data-driven decisions.
This ready-to-use Excel dashboard template gives you real-time insights into every key area of institutional performance — from enrollment and finance to placement and student satisfaction.
Click to Purchases Vocational Schools Dashboard in Excel
🎯 What Is a Vocational Schools Dashboard in Excel?
A Vocational Schools Dashboard in Excel is a performance-tracking tool that consolidates data from multiple departments into one analytical workbook.
It allows institutions to visualize critical metrics such as tuition revenue, scholarships, attendance, exam results, and placement outcomes.
Instead of spending hours preparing reports, school administrators can instantly view trends and summaries using dynamic charts, interactive slicers, and automatic calculations — all inside Microsoft Excel.
Click to Purchases Vocational Schools Dashboard in Excel
🧩 Structure of the Vocational Schools Dashboard
The template contains five main pages, plus supporting data sheets. Each page focuses on a unique dimension of school performance.
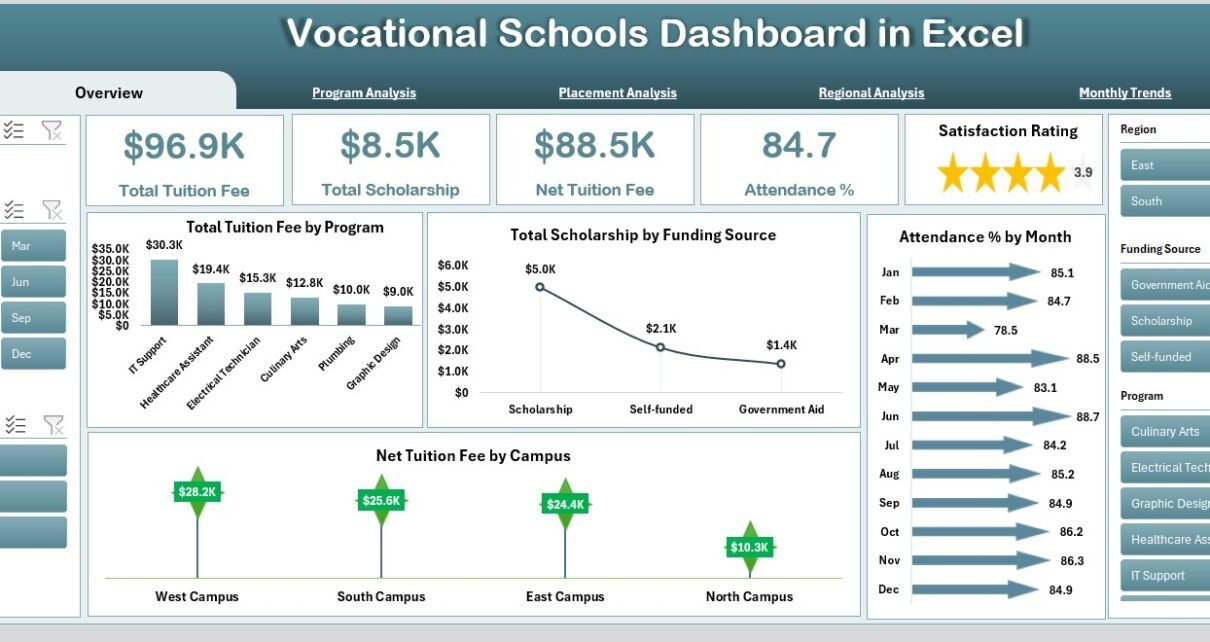
1️⃣ Overview Page — The Main Dashboard
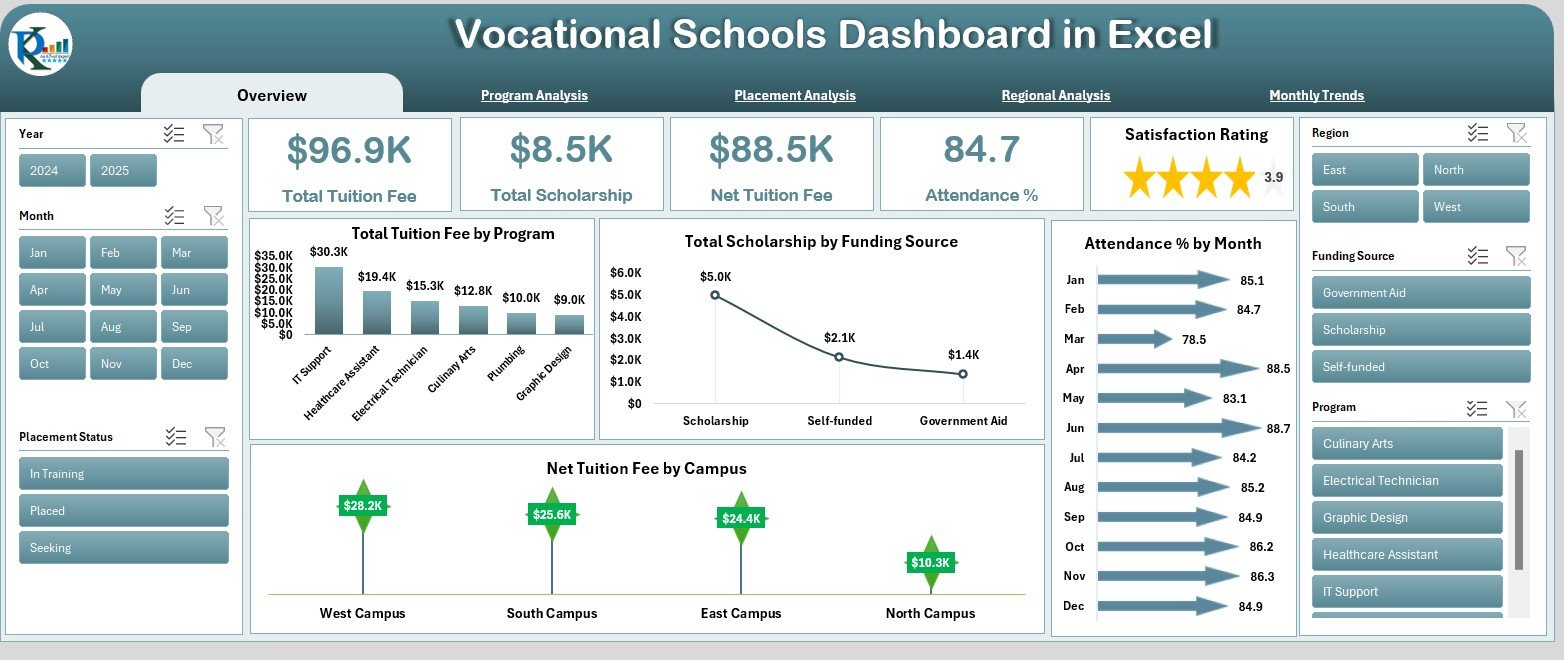
The Overview Page gives a 360° view of overall institutional performance.
Key Features:
-
🎚 Page Navigator on the left for easy navigation.
-
🧾 Cards and KPIs: Displays Total Tuition Fee, Total Scholarships, Net Tuition Fee, and Attendance %.
-
📊 Charts:
-
Total Tuition Fee by Program
-
Total Scholarship by Funding Source
-
Net Tuition Fee by Campus
-
Attendance % by Month
-
This page instantly highlights financial and attendance trends, helping administrators identify areas of growth and improvement.
2️⃣ Program Analysis Page — Academic Performance Insights
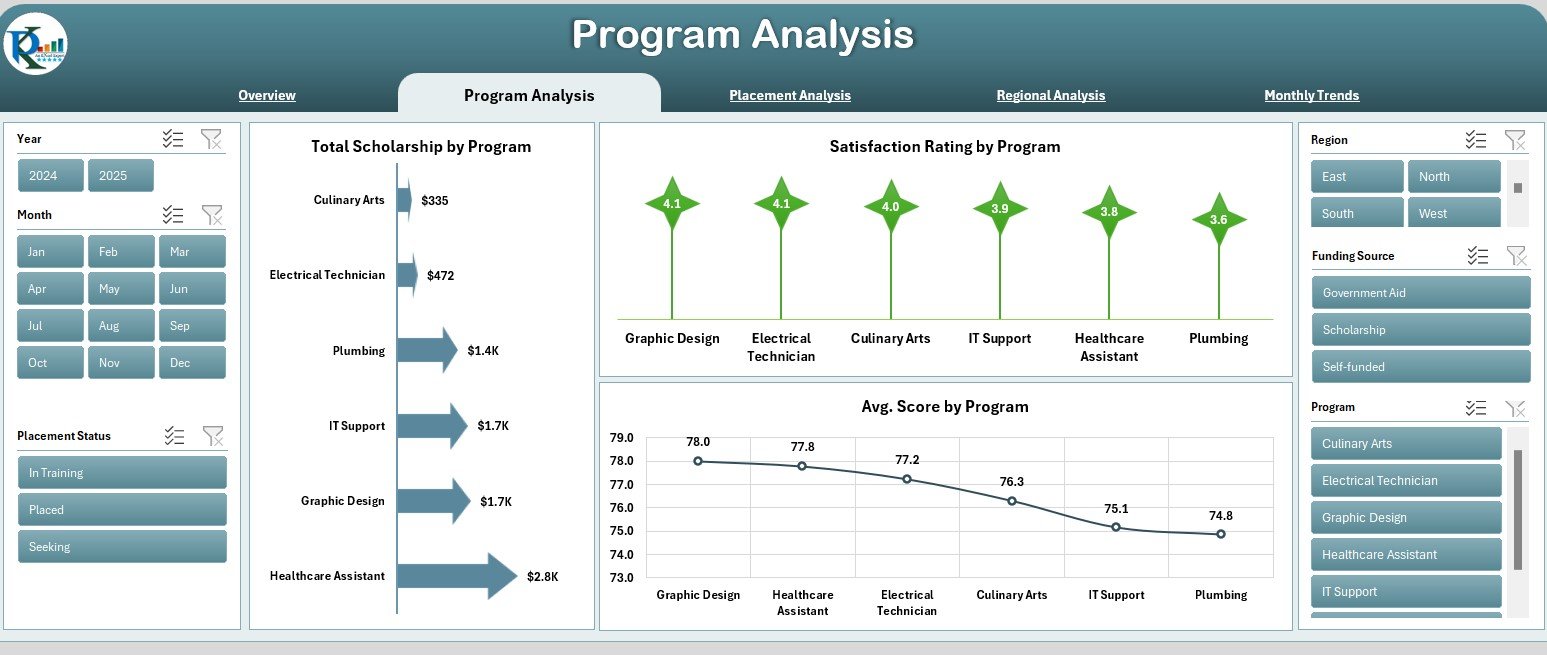
This section focuses on how different programs perform academically and financially.
Charts Include:
-
🎓 Total Scholarship by Program
-
⭐ Satisfaction Rating by Program
-
📈 Average Score by Program
These visuals help academic heads understand which programs are most successful and where to invest resources for improvement.
3️⃣ Placement Analysis Page — Measure Career Outcomes
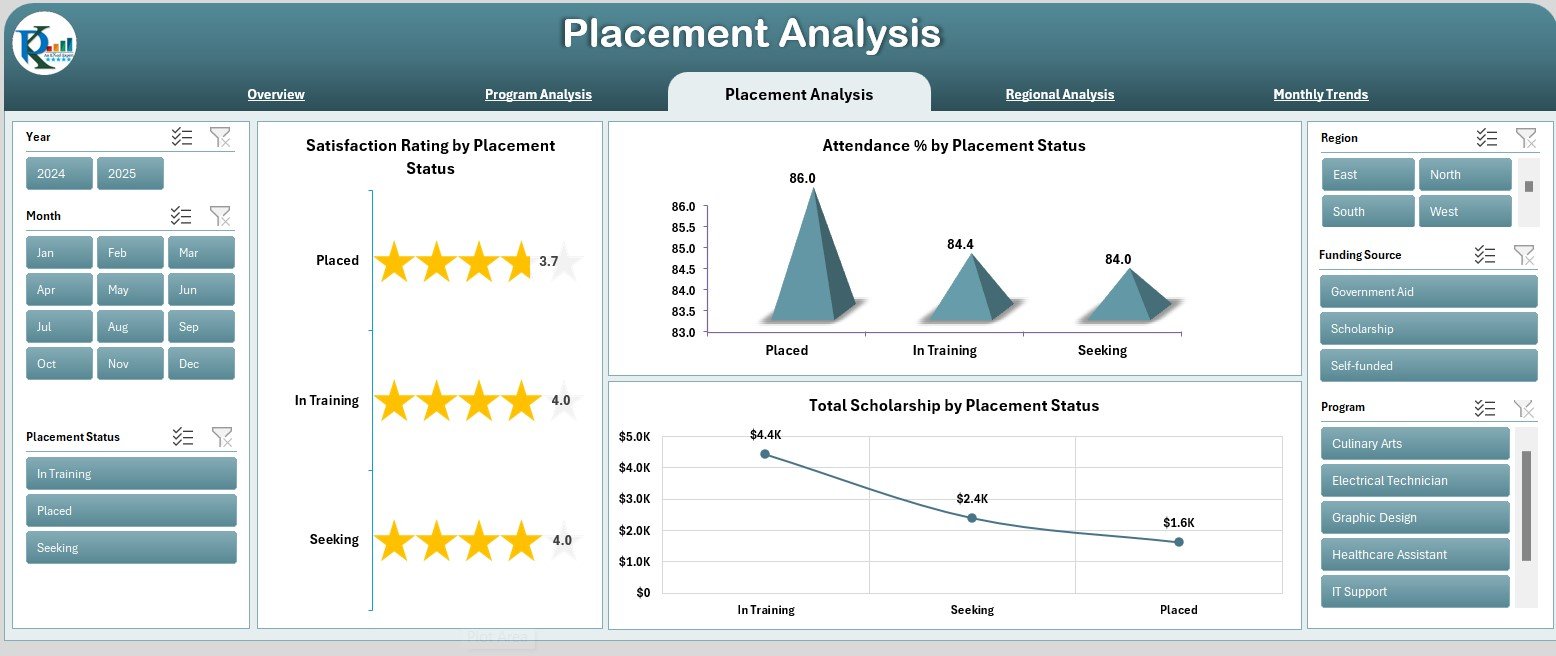
The Placement Analysis Page provides deep insights into student employment and career support results.
Charts Include:
-
💼 Satisfaction Rating by Placement Status
-
📅 Attendance % by Placement Status
-
🎓 Total Scholarship by Placement Status
These metrics help evaluate how well the school’s programs prepare students for real-world careers.
4️⃣ Regional Analysis Page — Geographical Performance View
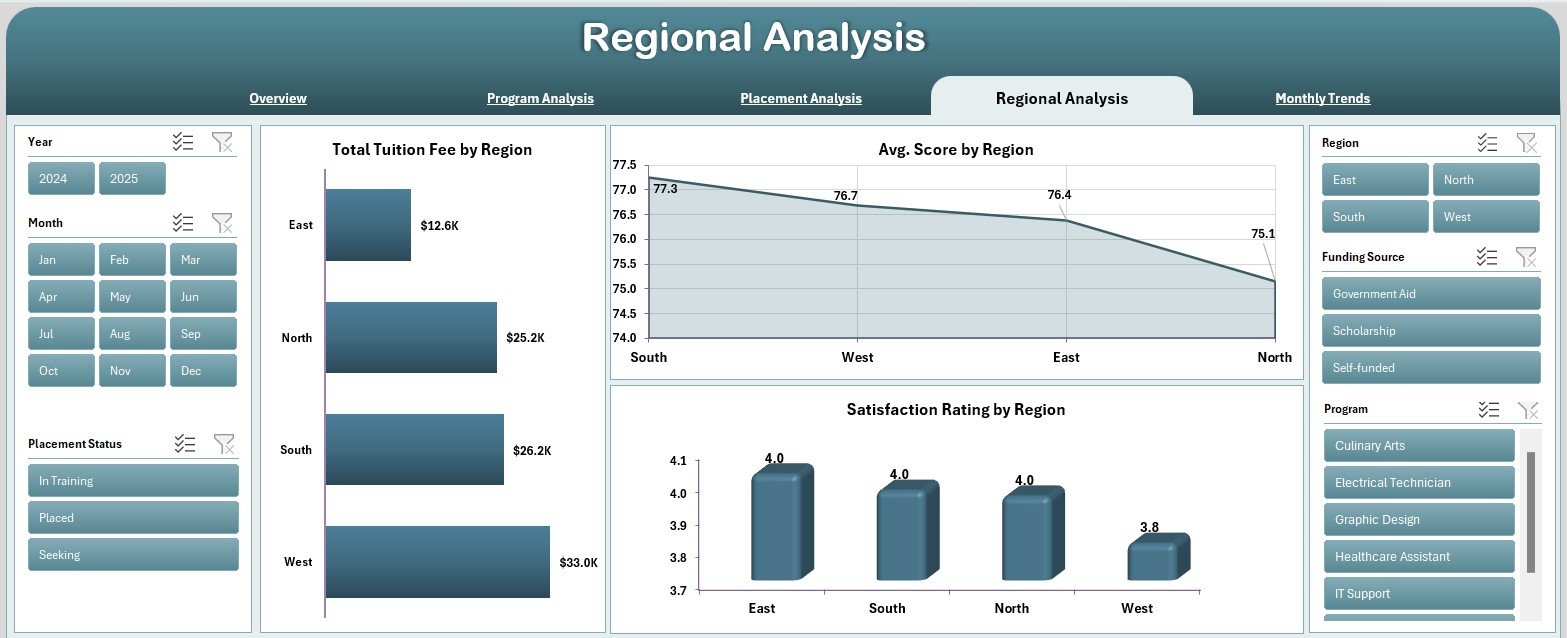
This page helps administrators see how campuses and regions compare in terms of financial and academic performance.
Charts Include:
-
🌍 Total Tuition Fee by Region
-
📊 Average Score by Region
-
⭐ Satisfaction Rating by Region
This analysis supports decision-making around resource allocation and regional program planning.
5️⃣ Monthly Trends Page — Track Progress Over Time
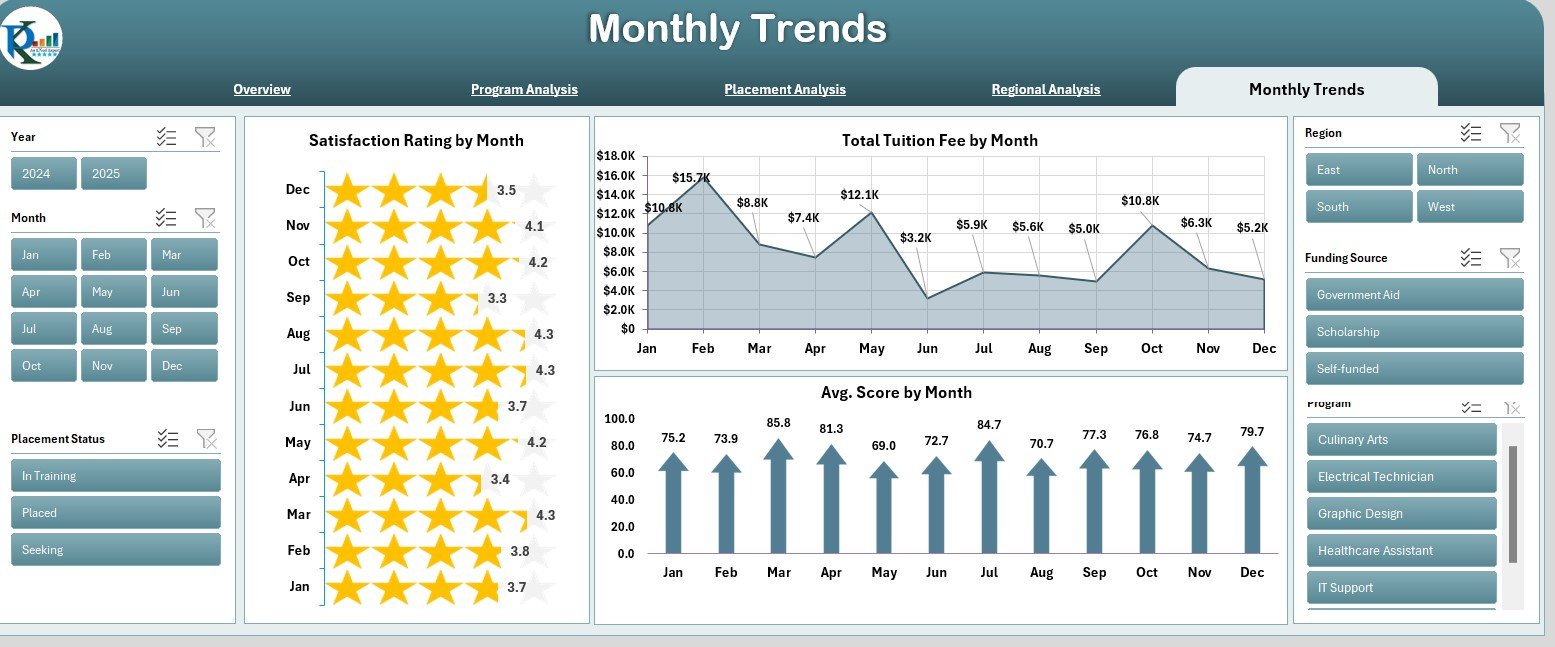
The Monthly Trends Page visualizes month-by-month data for key educational indicators.
Charts Include:
-
📈 Satisfaction Rating by Month
-
💰 Total Tuition Fee by Month
-
🎯 Average Score by Month
This page shows seasonal patterns in attendance, finance, and student experience, helping schools plan better for each term.
Click to Purchases Vocational Schools Dashboard in Excel
🎓 Why Vocational Schools Need a Dashboard
A Vocational School Dashboard in Excel gives decision-makers a data-driven lens for management and growth.
Key Benefits:
-
📊 Centralizes all data in one place.
-
📈 Tracks financial, academic, and placement KPIs.
-
⚡ Provides real-time visual updates.
-
🎯 Helps measure student success objectively.
-
💡 Improves decision-making through data insights.
By combining financial metrics with student feedback, schools can maintain quality education while optimizing revenue and outcomes.
⚙️ Advantages of Vocational Schools Dashboard in Excel
-
✅ Simple and accessible for all users.
-
📈 Dynamic charts and auto-updates with new data.
-
🎨 Modern layout with color-coded indicators.
-
💼 Useful for both academic and finance teams.
-
📚 100 % customizable as per institutional needs.
-
💡 Enhances transparency and reporting accuracy.
💡 Best Practices for Using the Dashboard
-
Regularly update actual data and targets.
-
Define clear KPI benchmarks for each program and campus.
-
Keep visuals clean and focused for quick insights.
-
Validate input data to avoid calculation errors.
-
Review monthly trends to plan semester strategies.
-
Encourage departments to use data for continuous improvement.
📈 Analyses You Can Perform
-
Financial trend analysis for tuition and scholarships.
-
Academic performance comparison by program or region.
-
Attendance and satisfaction pattern tracking.
-
Placement success rate evaluation.
-
Monthly progress review for institutional planning.
🏁 Conclusion — Empower Education with Data-Driven Insights
The Vocational Schools Dashboard in Excel offers a complete solution for monitoring and improving educational performance.
By combining financial, academic, and placement metrics into one interactive tool, it helps schools maximize student success and institutional efficiency.
With its simple design, automation, and visual clarity, this Excel dashboard is the perfect companion for any educational institution looking to make data-driven decisions.
Click to Purchases Vocational Schools Dashboard in Excel
❓ Frequently Asked Questions (FAQs)
1️⃣ What is a Vocational Schools Dashboard in Excel?
It’s an Excel-based tool to track financial, academic, and student performance KPIs.
2️⃣ Who can use it?
School administrators, finance teams, and program managers.
3️⃣ Does it include charts and visuals?
Yes — each page has interactive charts and cards for easy analysis.
4️⃣ Can it be customized?
Yes, you can add more KPIs, departments, or campuses.
5️⃣ Is it suitable for multi-campus institutions?
Absolutely — the Regional Analysis page is built for that.
6️⃣ Do I need advanced Excel skills?
No — it’s fully automated and easy to use.
Click to Purchases Vocational Schools Dashboard in Excel
Visit our YouTube channel to learn step-by-step video tutorials