In today’s rapidly evolving world, biotechnology plays a vital role in advancing healthcare, agriculture, pharmaceuticals, and environmental science. From genetic research to vaccine development, biotech companies manage an incredible amount of data — and turning that data into actionable insights is crucial for progress.
That’s where a Biotechnology Report in Excel comes in. This smart, data-driven reporting system helps biotech professionals, analysts, and researchers visualize key performance indicators (KPIs), analyze R&D investments, monitor project approval rates, and make informed business and scientific decisions.
Click to Purchases Biotechnology Report in Excel
In this comprehensive article, we’ll explore everything about the Biotechnology Report in Excel — what it is, how it works, why it’s essential, its advantages, and best practices for using it effectively. Let’s dive in!
What Is a Biotechnology Report in Excel?
A Biotechnology Report in Excel is a structured, ready-to-use reporting tool designed to help biotech organizations monitor and analyze data related to research, clinical trials, and project performance.
It consolidates raw data into clean, visual summaries — enabling scientists, project managers, and executives to understand results at a glance. The report highlights approval percentages, research and development (R&D) costs, clinical trial expenses, and total spending by region or project type.
Because it’s built in Microsoft Excel, the tool is flexible, customizable, and doesn’t require any specialized software or coding knowledge. It empowers users to manage biotechnology data efficiently, all within a familiar spreadsheet environment.
Structure of the Biotechnology Report in Excel
This Excel-based report template typically includes three major pages (plus one support sheet) — each designed to handle a different layer of analysis.
1️⃣ Summary Page
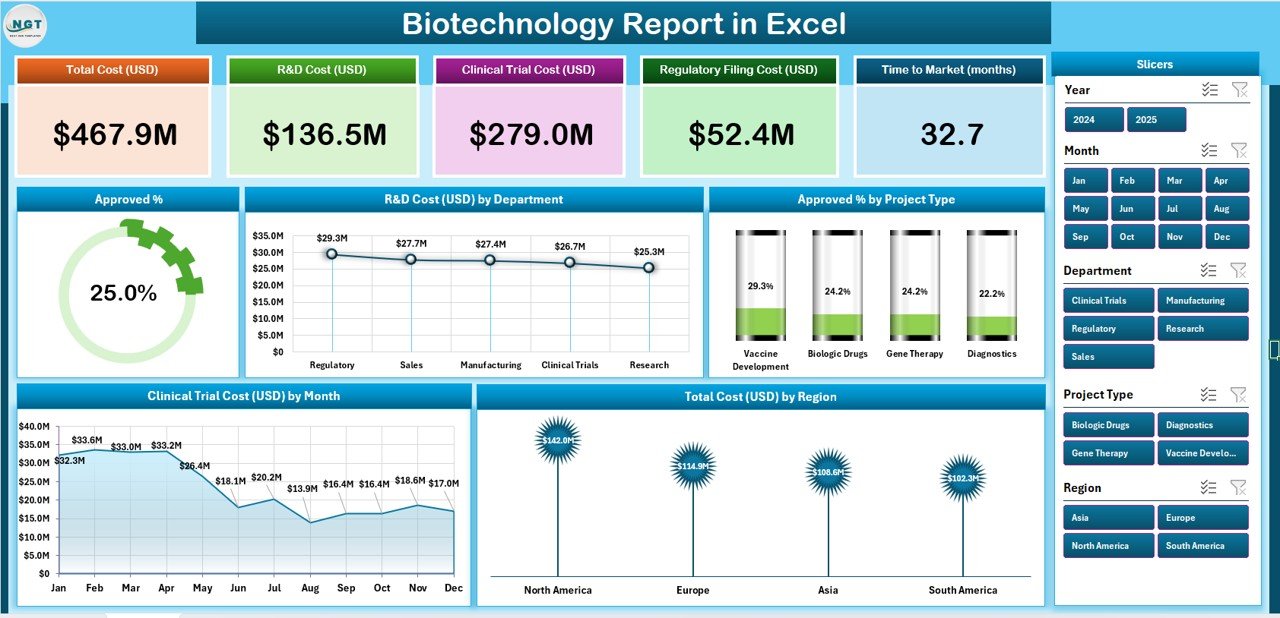
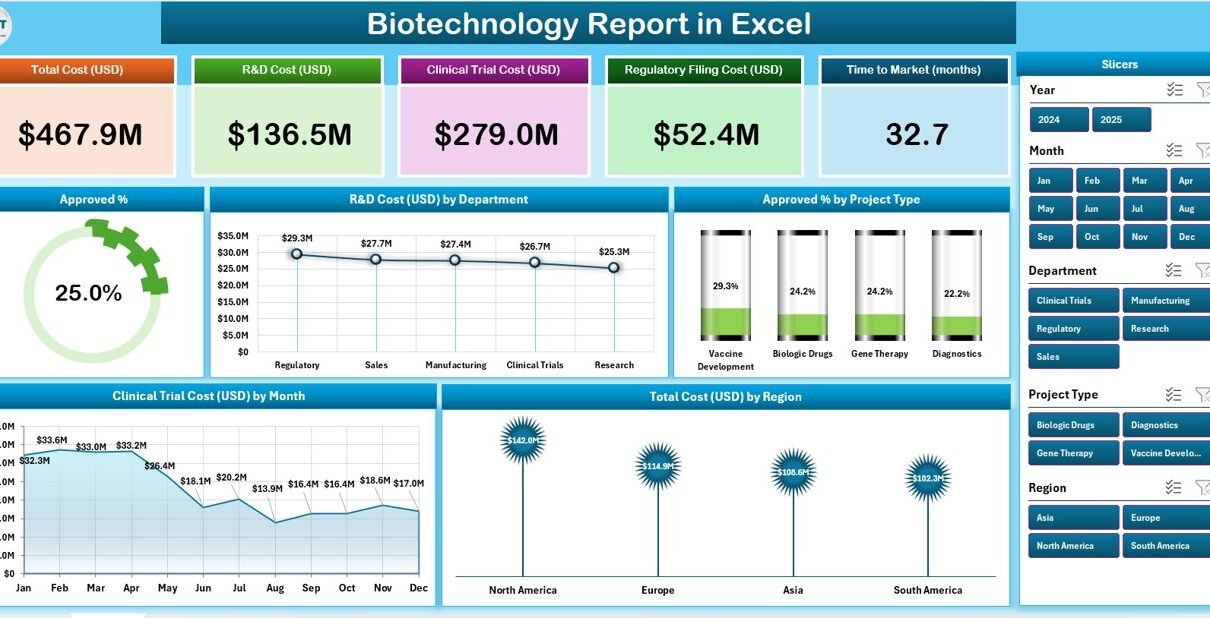
The Summary Page is the main dashboard where high-level insights appear. It serves as a quick snapshot of the biotech organization’s ongoing operations and performance.
Key Components:
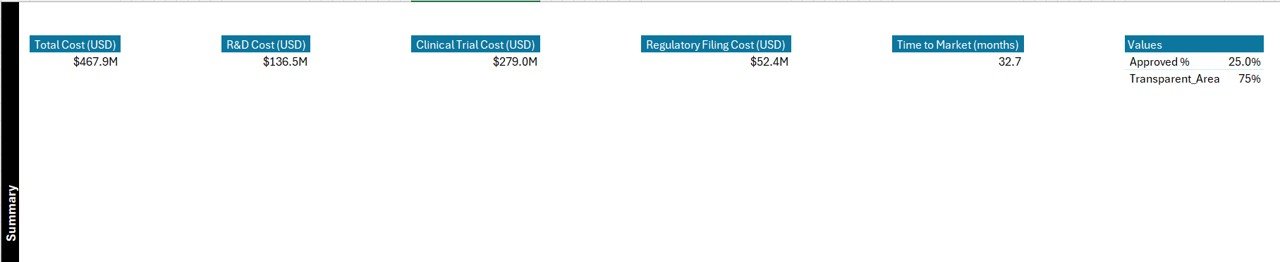
Top 5 KPI Cards:
- Approval Rate (%)
- Total R&D Cost (USD)
- Total Clinical Trial Cost (USD)
- Projects in Pipeline
- Total Regional Cost
-
Right-Side Slicer Panel:
Enables users to filter data by department, region, month, or project type. This makes it easy to focus on specific segments or time periods.
Visual Charts Displayed:
- Approval Percentage (%)
- R&D Cost (USD) by Department
- Approval % by Project Type
- Clinical Trial Cost (USD) by Month
- Total Cost (USD) by Region
These visuals make the Summary Page the most interactive and insightful part of the report. A manager can instantly identify which regions consume the most resources or which project types achieve the highest approval rates.
2️⃣ Report Page
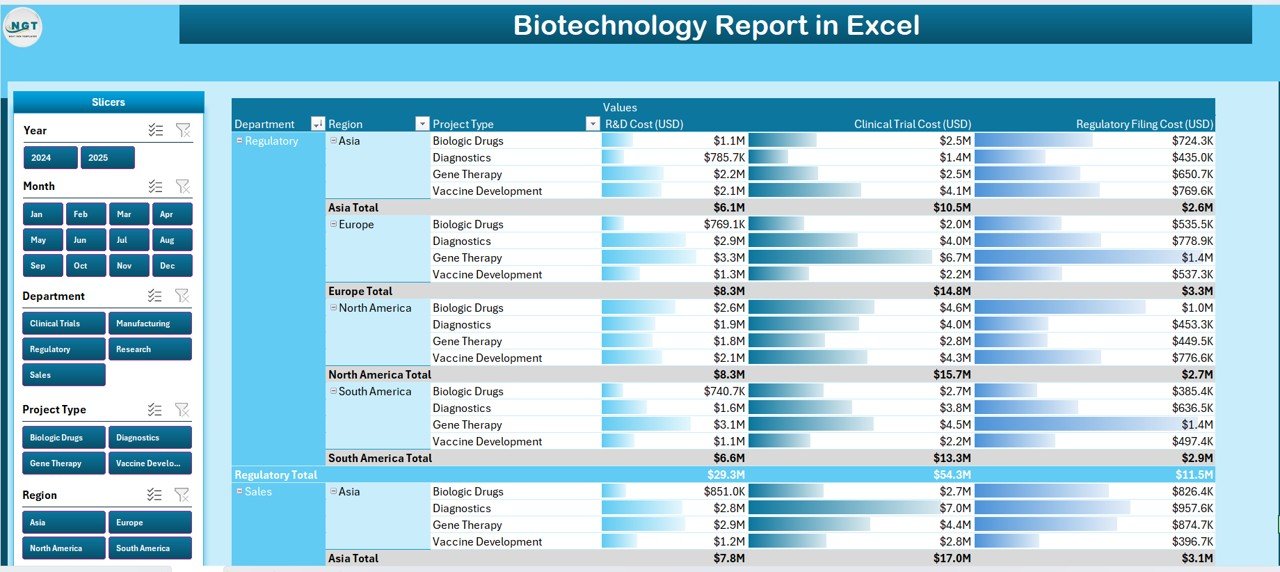
The Report Page provides detailed tabular information and helps users explore data line-by-line.
Key Highlights:
-
Left-Side Slicer:
Users can slice data by department, project, phase, or region.
Information Table:
Displays essential metrics like:
- Project Name
- Department
- Clinical Phase
- Approval Status
- R&D Cost
- Clinical Trial Cost
- Total Cost
- Project Type
Click to Purchases Biotechnology Report in Excel
This view is ideal for analytical users who need deeper insights, such as cross-comparing project costs or evaluating department-wise performance.
3️⃣ Data Sheet
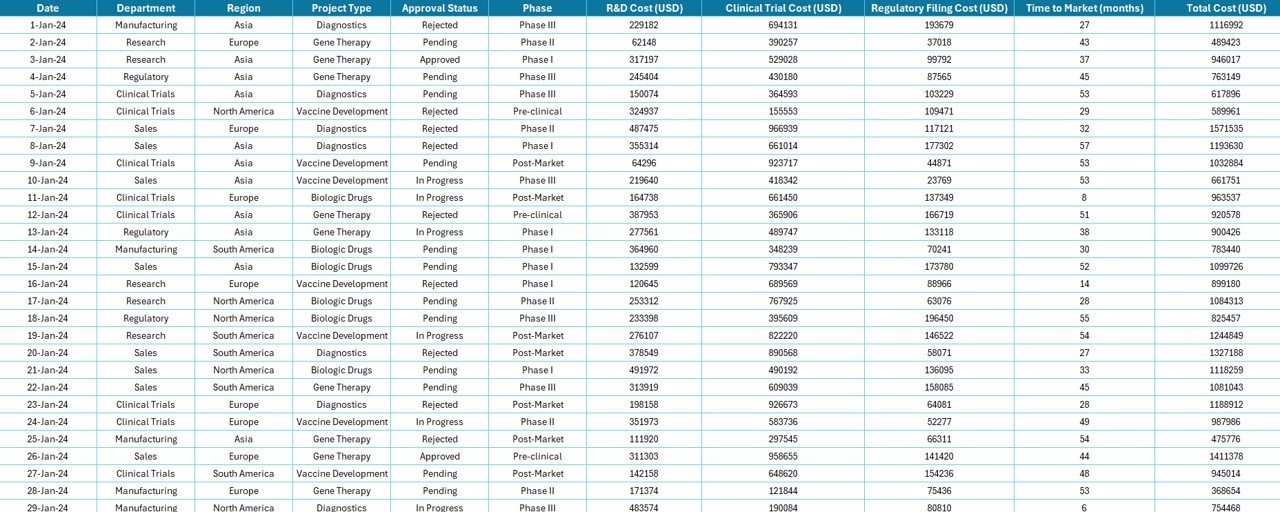
The Data Sheet is the foundation of the report. It stores all raw data — from research costs to project outcomes — which power the charts and tables through Excel formulas and pivot tables.
Typical columns include:
-
Project ID
-
Project Name
-
Department
-
Project Type
-
Clinical Phase
-
Region
-
R&D Cost (USD)
-
Clinical Trial Cost (USD)
-
Approval Status
-
Date of Update
Having structured, clean data ensures that all calculations and visualizations on other pages remain accurate and dynamic.
4️⃣ Support Sheet
The Support Sheet acts as a reference library for dropdown lists and lookups. It may include:
-
Department Names
-
Project Types
-
Clinical Phases
-
Regional Names
-
Status Values
This sheet improves consistency across the workbook and helps automate slicers and filters.
🎯 Why Is a Biotechnology Report Important?
In biotechnology, research and financial data grow exponentially. Without a centralized system, it becomes hard to track performance, expenses, or approval success rates.
Here’s why a Biotechnology Report in Excel is essential:
-
It transforms complex scientific data into simple, visual insights.
-
It improves transparency across R&D, clinical trials, and project management.
-
It allows data-driven decision-making without the need for costly BI tools.
-
It reduces manual reporting time through automation and structured design.
💡 Key Insights You Can Gain from the Report
The Biotechnology Report delivers deep insights through dynamic Excel dashboards. Some valuable analyses include:
-
Department-wise R&D Cost:
Identify which departments require more budget or deliver better returns. -
Approval Rate by Project Type:
Determine which project categories are most successful in getting approvals. -
Monthly Clinical Trial Expenses:
Monitor trends to control costs and improve budget forecasting. -
Regional Performance:
Compare total costs and project outcomes by geographical region. -
Project Success Metrics:
Evaluate efficiency, innovation output, and overall scientific productivity.
🚀 Advantages of Biotechnology Report in Excel
A Biotechnology Report in Excel provides multiple organizational and operational benefits. Let’s look at the top advantages:
1️⃣ Centralized Data Visualization
Instead of navigating through multiple files, the report offers a single dashboard that shows R&D costs, approval trends, and project performance — all in one place.
2️⃣ Cost-Effective Solution
Unlike expensive business intelligence tools, Excel offers a budget-friendly way to manage biotech data using familiar formulas, pivot tables, and charts.
3️⃣ Customizable and Scalable
The report can easily grow with your organization. You can add KPIs, modify formulas, and include new regions or departments without restructuring everything.
4️⃣ Improved Collaboration
Excel files can be shared across departments, enabling scientists, analysts, and management teams to collaborate effectively.
5️⃣ Real-Time Analysis
With dynamic pivot tables and slicers, users can analyze updated data instantly and make timely decisions.
6️⃣ Easy Integration
The report can import or link data from databases, CSV files, or other systems to maintain accuracy and consistency.
🧬 Who Can Use the Biotechnology Report?
This Excel-based report is suitable for:
-
Biotech Companies – Track R&D spending and approval success.
-
Pharmaceutical Firms – Monitor clinical trials and research efficiency.
-
Healthcare Organizations – Manage innovation, vaccine development, and lab performance.
-
Research Institutes – Analyze projects and funding utilization.
-
Government Agencies – Oversee biotech initiatives, funding, and outcomes.
🧮 How to Use the Biotechnology Report in Excel
Follow these simple steps to get started:
-
Go to the Data Sheet:
Enter or import all project data (names, costs, approvals, etc.). -
Check the Support Sheet:
Ensure dropdown lists (like regions or departments) are updated. -
Open the Summary Page:
Explore KPIs and visual charts. Use slicers to filter insights. -
Use the Report Page:
Drill down into specific project or department data. -
Update Monthly:
Refresh pivot tables to ensure the latest data appears.
These steps make it easy even for non-technical users to maintain and update the report regularly.
🧠 Opportunities for Improvement
While the Biotechnology Report in Excel is robust, it can become even more powerful with small enhancements:
-
Automation with VBA Macros:
Add buttons for data refresh, export, and navigation between pages. -
Power Query Integration:
Automate data imports from multiple files or databases. -
Dynamic Charts:
Add interactive visuals using slicers and timelines. -
Conditional Formatting:
Highlight high or low performers using color scales. -
Dashboard Navigation Buttons:
Create a user-friendly experience with clickable links to each page.
🌱 Best Practices for the Biotechnology Report in Excel
To make the most of this tool, follow these professional best practices:
✅ Maintain Clean Data
Keep the data sheet free of blank rows, typos, and duplicate entries. Structured data ensures accurate analysis.
✅ Refresh Regularly
Update pivot tables and charts after every data change to keep visuals current.
✅ Use Consistent Units
Always use the same units (e.g., USD for cost, % for rates) to avoid confusion and miscalculations.
✅ Protect Critical Cells
Lock formulas and KPI definitions to prevent accidental changes.
✅ Backup and Version Control
Maintain backups to track changes over time and prevent data loss.
✅ Visual Clarity
Limit the number of charts on each page and use color coding wisely to improve readability.
✅ Use Meaningful Labels
Every chart and card should clearly mention the metric being displayed.
🧭 Example Analysis Scenarios
Click to Purchases Biotechnology Report in Excel
Here are some real-world examples of how biotech professionals can use the Excel report:
📍 Scenario 1: Monitoring R&D Efficiency
The R&D manager filters data by department to see which units are spending the most. The dashboard instantly highlights which departments are overspending or underperforming.
📍 Scenario 2: Tracking Regional Cost Trends
The finance team uses the “Total Cost by Region” chart to compare expenses across Asia, Europe, and North America. This helps in reallocating funds more efficiently.
📍 Scenario 3: Evaluating Project Approvals
The clinical director checks the “Approval % by Project Type” chart to see which categories (e.g., oncology, genetics) achieve higher success rates. This guides future investment priorities.
🧾 Conclusion
The Biotechnology Report in Excel is more than just a spreadsheet — it’s a smart reporting system for biotech professionals who want to transform data into decisions. It helps researchers, managers, and executives visualize R&D costs, track project performance, and evaluate approvals efficiently.
With its intuitive structure — including the Summary Page, Report Page, and Data Sheet — this Excel template brings clarity, efficiency, and accuracy to complex biotechnology data.
When implemented correctly, it not only simplifies data management but also drives innovation and informed decision-making within your organization.
❓ Frequently Asked Questions (FAQs)
1️⃣ What is a Biotechnology Report in Excel used for?
It’s used to monitor biotechnology projects, analyze research and clinical trial costs, track approvals, and assess performance metrics using Excel dashboards.
2️⃣ Who should use this report?
Biotech companies, pharma firms, healthcare organizations, and research institutes can all benefit from using it for better data visualization and cost management.
3️⃣ Can I customize this Excel report?
Yes! You can add or modify KPIs, departments, regions, and visuals to fit your organization’s unique reporting needs.
4️⃣ Does it require advanced Excel skills?
Not at all. The template uses basic Excel features like pivot tables, slicers, and formulas — no coding or macros are required.
5️⃣ How often should I update the data?
It’s best to update your data monthly or after major project milestones to keep reports accurate and insightful.
6️⃣ Can I link this report to other data sources?
Yes. You can use Excel’s Power Query or external connections to import data automatically from databases or CSV files.
7️⃣ What are the benefits of using Excel instead of specialized software?
Excel is cost-effective, widely used, and easy to learn. It provides high flexibility without expensive licensing or training costs.
Visit our YouTube channel to learn step-by-step video tutorials