In today’s quality-driven business environment, maintaining compliance, accuracy, and transparency in lab testing is critical. Whether you work in pharmaceuticals, construction, food and beverages, or environmental sciences — every certification, approval, or rejection tells a story about your laboratory’s performance.
That’s where the Test Lab Certifications Dashboard in Excel comes in — a smart, data-driven tool designed to simplify certification tracking, reporting, and performance monitoring.
This article explores everything you need to know about this Excel-based dashboard — from its structure and analytical pages to the insights it can deliver for decision-making.
Click to Purchases Test Lab Certifications Dashboard in Excel
🔍 What Is a Test Lab Certifications Dashboard in Excel?
A Test Lab Certifications Dashboard in Excel is a ready-to-use analytical tool that helps organizations visualize and monitor their lab testing certifications.
It consolidates raw data related to approvals, pending requests, rejections, costs, turnaround time, and satisfaction ratings into one powerful dashboard. The goal is to turn complex data into meaningful insights that support faster, data-backed decisions.
With dynamic charts, filters, and interactive visuals, the dashboard helps laboratory managers, quality assurance teams, and compliance officers identify patterns and take corrective actions instantly.
Click to Purchases Test Lab Certifications Dashboard in Excel
🧭 Key Features of the Test Lab Certifications Dashboard in Excel
The Test Lab Certifications Dashboard is designed for intuitive use and powerful analysis. It includes five analytical pages and a support data sheet for smooth operations.
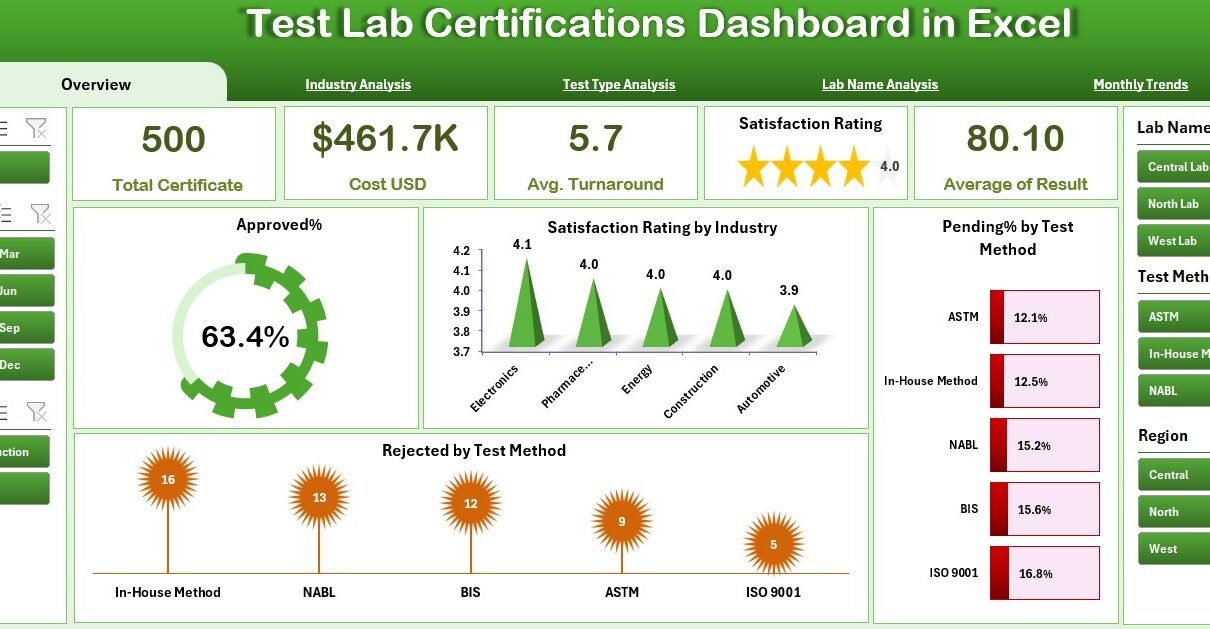
1️⃣ Overview Page
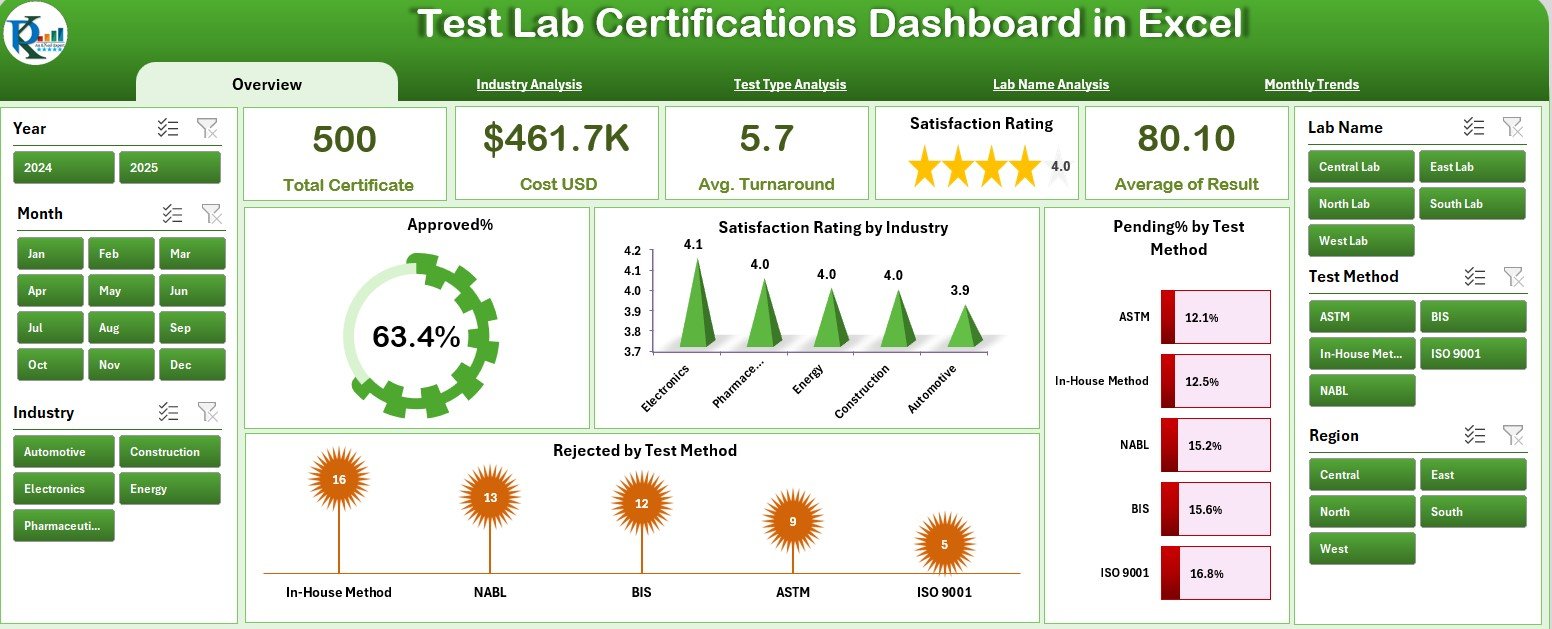
The Overview Page serves as the control center of the dashboard.
-
On the left side, there’s a page navigator that lets users switch between different analytical pages quickly.
-
On the right side, the dashboard displays five interactive cards that highlight key metrics — such as:
-
Total Certificates
-
Approved Percentage (%)
-
Pending Percentage (%)
-
Rejected Percentage (%)
-
Average Satisfaction Rating
-
Below these cards, four dynamic charts provide deeper insights:
-
Approved %
-
Satisfaction Rating by Industry
-
Pending % by Test Method
-
Rejected by Test Method
Together, these visuals present a snapshot of certification performance across industries and testing methods, helping management quickly assess overall performance.
2️⃣ Industry Analysis Page
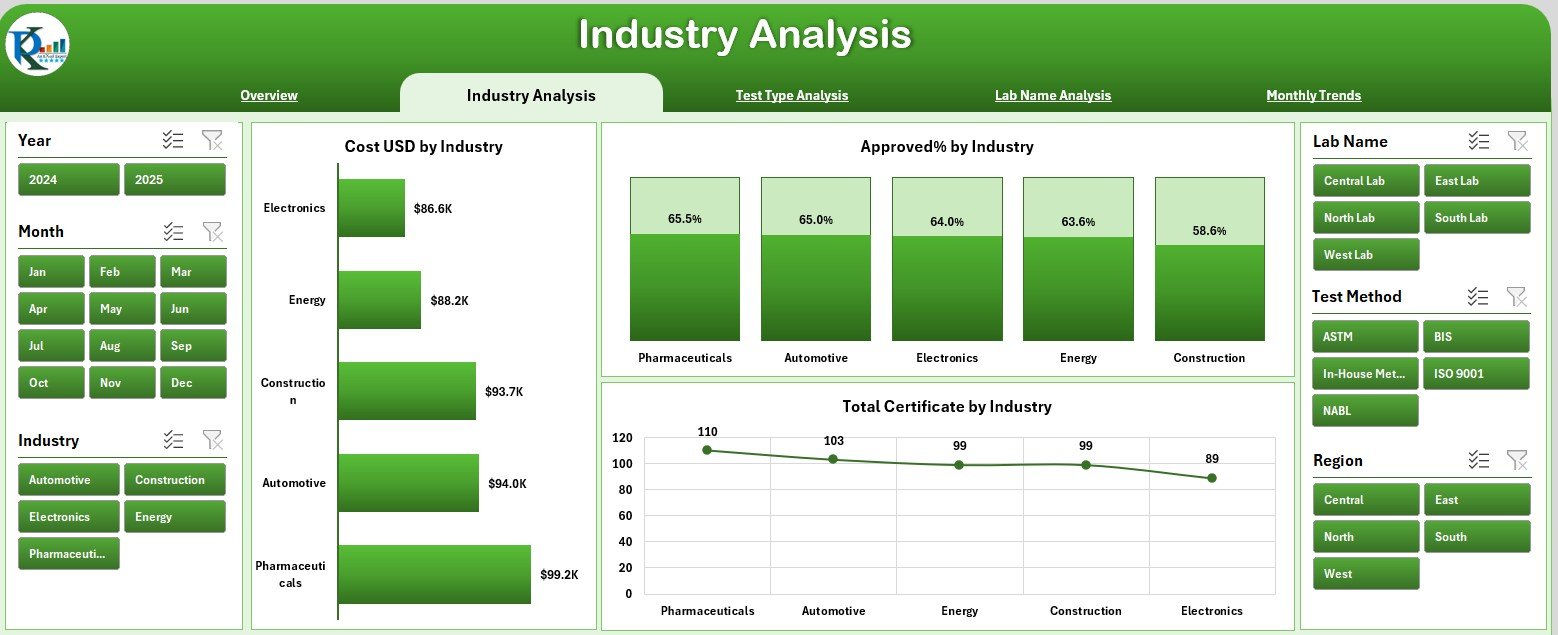
The Industry Analysis Page focuses on how certifications are distributed and performing across different industries.
It includes three insightful charts:
-
Cost (USD) by Industry – Helps identify which sectors contribute most to certification costs.
-
Approved % by Industry – Compares the approval rate for each industry type.
-
Total Certificates by Industry – Shows the total volume of certificates issued, making it easy to pinpoint high-activity industries.
This view is especially useful for business leaders who want to understand profitability and efficiency per industry segment.
3️⃣ Test Type Analysis Page
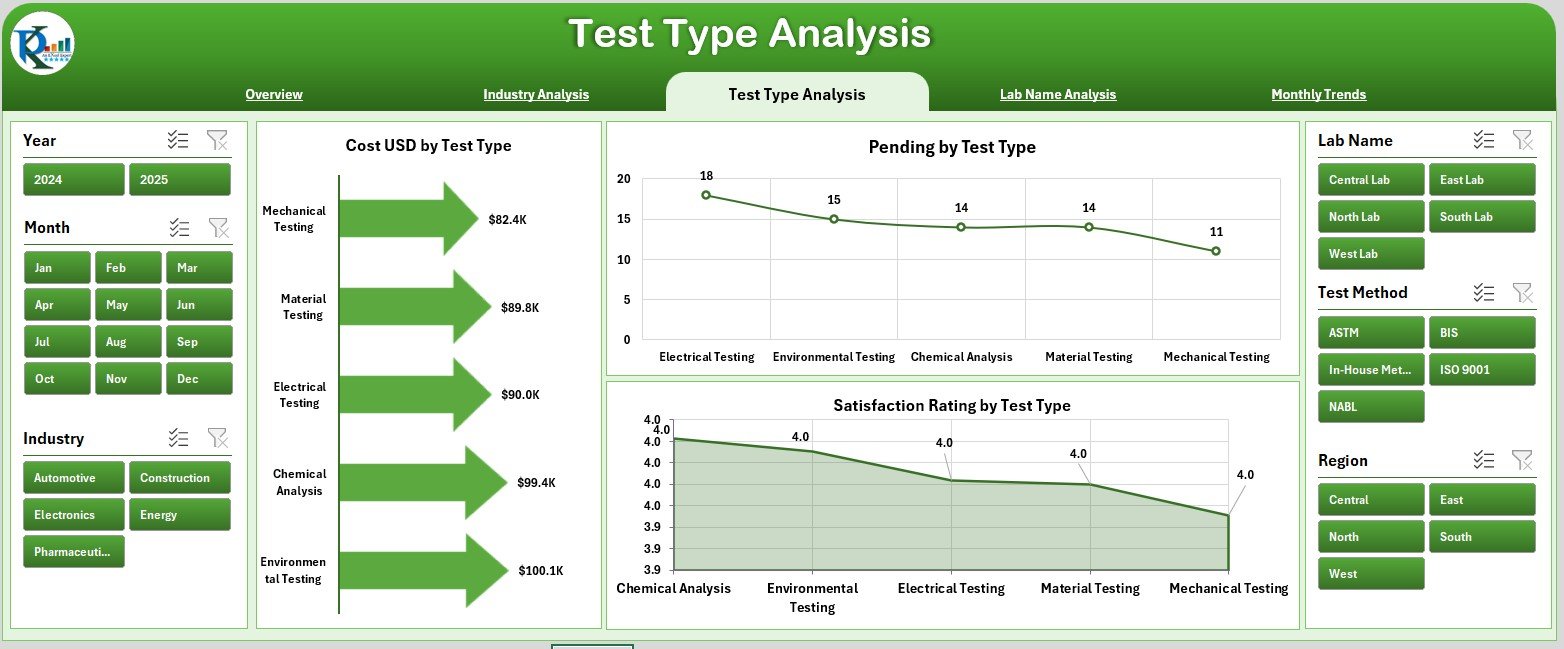
Testing methods vary widely, from chemical testing to mechanical inspection. The Test Type Analysis Page allows users to track certifications by the type of test conducted.
It includes:
-
Cost (USD) by Test Type – Understand where most testing investments occur.
-
Pending % by Test Type – Identify which test categories have delays or bottlenecks.
-
Satisfaction Rating by Test Type – Gauge client feedback and perceived quality per test type.
By analyzing this page, lab managers can identify which test methods need process improvements or cost optimization.
4️⃣ Lab Name Analysis Page
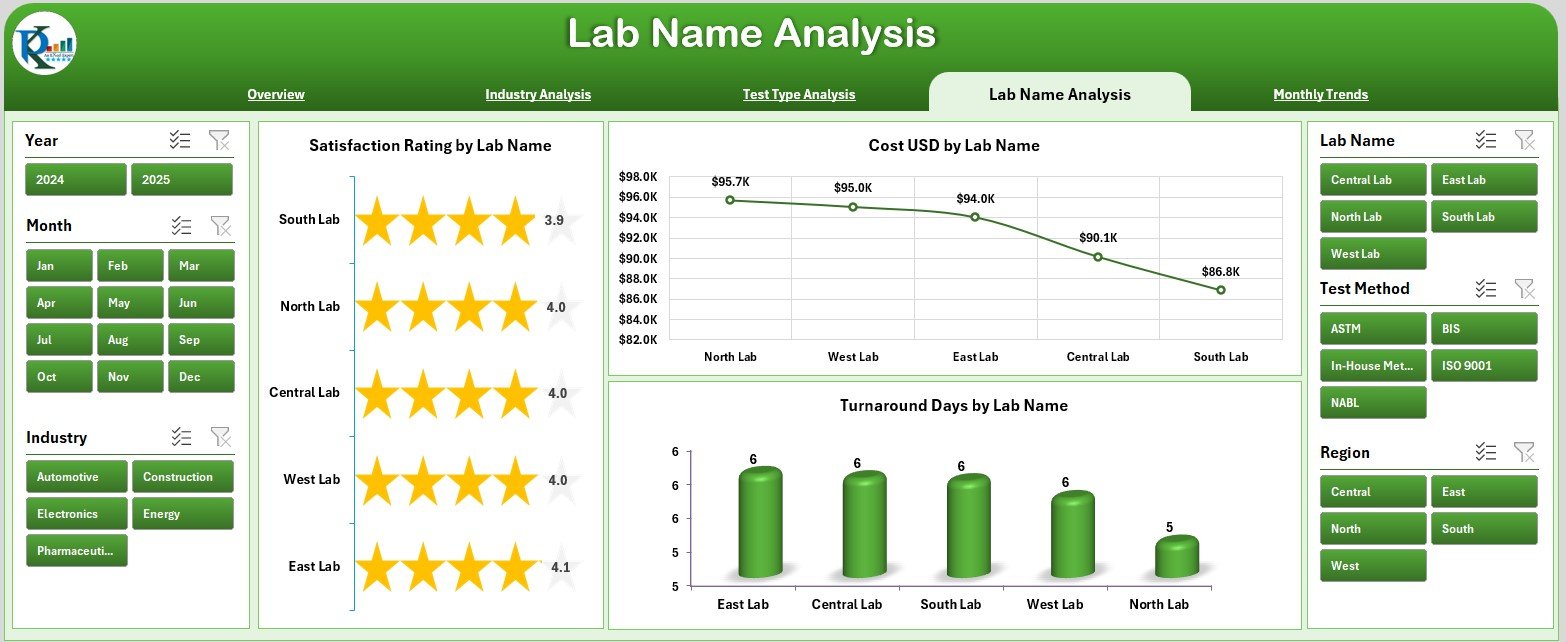
In multi-location or multi-lab environments, comparing performance between labs is essential.
The Lab Name Analysis Page offers:
-
Satisfaction Rating by Lab Name – Highlights which labs deliver the best service experience.
-
Cost (USD) by Lab Name – Tracks how each lab contributes to overall costs.
-
Turnaround Days by Lab Name – Reveals operational efficiency based on average completion time.
This analysis helps decision-makers benchmark performance, allocate resources effectively, and identify labs that may require process enhancement or additional training.
5️⃣ Monthly Trends Page
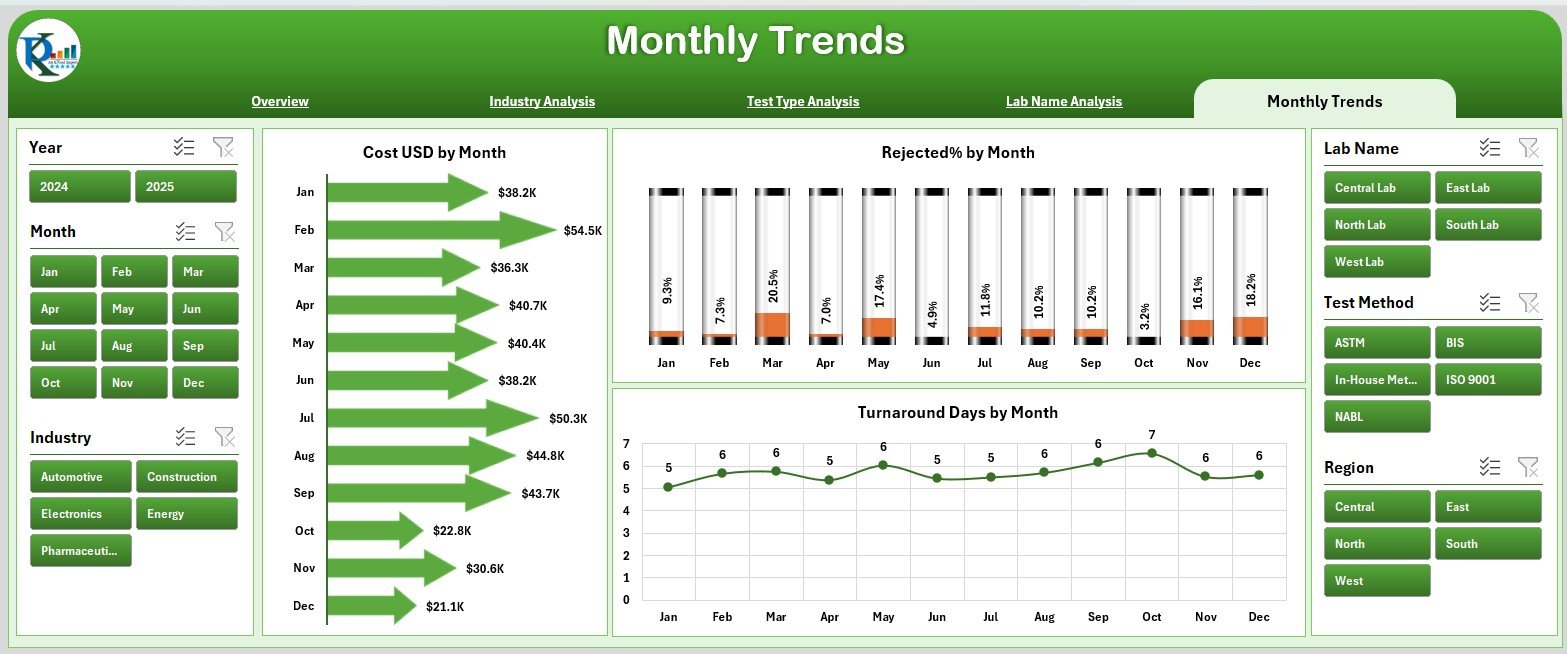
The Monthly Trends Page captures how lab performance changes over time.
It includes:
-
Cost (USD) by Month – Monitors total expenditure trends across months.
-
Rejected % by Month – Identifies months with unusually high rejection rates.
-
Turnaround Days by Month – Analyzes seasonal performance shifts or workload impact.
This page provides a time-series perspective that supports forecasting, budgeting, and operational planning.
6️⃣ Data and Support Sheets
Every dashboard relies on accurate and structured data. The Data Sheet holds all raw records — such as lab name, industry, test type, approval status, cost, turnaround days, and satisfaction score.
The Support Sheet provides controlled lists for dropdowns, KPI groupings, and validation — ensuring consistency and accuracy throughout the workbook.
Click to Purchases Test Lab Certifications Dashboard in Excel
⚙️ How the Test Lab Certifications Dashboard Works
This dashboard is powered entirely by Excel formulas, pivot tables, and charts — no coding or add-ins required.
Here’s how it operates:
-
Data Input: Users record certification data in the Data Sheet.
-
Data Refresh: Excel automatically updates pivot tables connected to the data.
-
Dynamic Filters: Slicers and dropdowns allow users to select industries, months, or labs for instant analysis.
-
Visual Dashboard: Key metrics and charts update dynamically, reflecting real-time insights.
Since the dashboard runs on Excel, it’s easy to share, customize, and use without additional software or licensing.
🌍 Why Every Testing Lab Needs This Dashboard
Testing labs face continuous challenges — meeting deadlines, maintaining accuracy, managing costs, and satisfying clients. Manual tracking through spreadsheets or reports can lead to delays and data inconsistency.
The Test Lab Certifications Dashboard in Excel solves these problems by:
-
Centralizing all certification-related data.
-
Reducing reporting time.
-
Improving visibility across departments.
-
Enhancing data reliability and analysis depth.
When everyone works from the same data source, decisions become faster, clearer, and more confident.
✅ Advantages of Using the Test Lab Certifications Dashboard in Excel
Implementing this dashboard brings several measurable benefits:
1. Centralized Data Management
All certifications, approvals, and rejections are stored in one structured database, ensuring data consistency and easy access.
2. Real-Time Insights
Instantly view key metrics like approval rates, rejection trends, and turnaround times — without manual calculations.
3. Improved Decision-Making
Data-driven visuals help managers identify problem areas and opportunities for optimization quickly.
4. Enhanced Client Transparency
Share visual performance reports with clients or auditors for better trust and accountability.
5. Time and Cost Efficiency
Reduce time spent on manual reporting and rework caused by inaccurate data.
6. Flexibility and Scalability
Easily modify the dashboard for new KPIs, additional labs, or different testing methods as your organization grows.
Click to Purchases Test Lab Certifications Dashboard in Excel
💡 Opportunities for Improvement
Even though the dashboard is powerful, there’s always room to enhance functionality. Here are a few areas for future upgrades:
-
Automation through VBA Macros: Add data import or automated reporting to save more time.
-
Integration with Power BI or Google Sheets: For more advanced analytics and online sharing.
-
KPI Benchmarking: Introduce performance targets for each lab or industry type.
-
Data Validation Enhancements: Improve data input accuracy using drop-down menus or conditional rules.
-
Visual Redesign: Incorporate icons or trend indicators for a more modern look.
These improvements can transform the tool from a performance monitor to a complete business intelligence system.
🧩 Use Cases — Who Can Benefit from This Dashboard?
This dashboard isn’t limited to one industry. It’s valuable across various sectors where certifications are essential for compliance and quality assurance.
🎯 For Quality Managers
Monitor certification approval ratios, turnaround time, and satisfaction scores to maintain ISO or internal quality standards.
🧪 For Lab Supervisors
Track performance across test types, labs, or months to ensure efficient workload distribution.
💼 For Business Leaders
Analyze cost and approval performance by industry to identify high-value markets or underperforming areas.
📊 For Compliance Officers
Simplify audit preparation with visual and structured records of certifications and testing data.
🚀 Best Practices for the Test Lab Certifications Dashboard in Excel
To get the most value out of your dashboard, follow these best practices:
1. Maintain Clean and Accurate Data
Ensure all entries — like costs, dates, and satisfaction scores — are recorded accurately. Inconsistent data can lead to misleading visuals.
2. Refresh Data Regularly
Update your dashboard weekly or monthly to maintain real-time relevance.
3. Define KPI Benchmarks
Set measurable performance goals for approval %, turnaround time, and cost per test.
4. Use Slicers Effectively
Apply slicers to filter results by month, industry, or lab name to gain targeted insights.
5. Monitor Trends and Outliers
Compare monthly trends to detect early warning signs or performance anomalies.
6. Backup Your Data
Keep copies of your data sheet before making structural changes to prevent data loss.
🏁 Conclusion
The Test Lab Certifications Dashboard in Excel is more than just a spreadsheet — it’s a complete management system that helps laboratories track, measure, and improve performance with ease.
By combining interactive visuals, clear metrics, and automated insights, it empowers lab managers and decision-makers to maintain top-quality standards, enhance efficiency, and improve customer satisfaction.
With this dashboard, organizations can transition from reactive problem-solving to proactive quality management — driving better outcomes and higher confidence in every certification they issue.
Click to Purchases Test Lab Certifications Dashboard in Excel
❓ Frequently Asked Questions (FAQs)
1. What type of data do I need to use this dashboard?
You need basic certification data such as lab name, industry, test type, approval status, turnaround time, cost, and satisfaction rating.
2. Can I use this dashboard for multiple labs?
Yes, the dashboard supports multi-lab analysis. You can filter and compare performance across labs easily.
3. Does it require any advanced Excel skills?
Not at all! The dashboard uses pivot tables, charts, and slicers — all built within Excel’s standard features.
4. How often should I update the data?
It’s best to update the data weekly or monthly depending on your reporting needs.
5. Can I modify the dashboard layout or add more KPIs?
Yes, you can customize it freely. You can add new KPIs, modify chart types, or include additional analysis tabs.
6. Is it suitable for non-technical users?
Absolutely. The interface is simple, with clear navigation and pre-built visuals that anyone can understand.
7. Can I connect this dashboard to other systems?
If you’re familiar with Power Query or VBA, you can link this Excel dashboard to external databases or CSV imports for automation.
Click to Purchases Test Lab Certifications Dashboard in Excel
Visit our YouTube channel to learn step-by-step video tutorials