Crowdfunding has transformed the way projects, startups, and social causes raise funds. From creative ventures to community initiatives, crowdfunding platforms empower individuals and organizations to connect directly with supporters. However, managing multiple campaigns, tracking donations, and evaluating platform performance can quickly become overwhelming without a structured analytical system.
That’s where the Crowdfunding Platforms Dashboard in Excel comes in — a ready-to-use solution that helps crowdfunding managers, analysts, and entrepreneurs monitor performance across campaigns, categories, and regions through dynamic visuals and KPIs.
This guide explains everything you need to know about this Excel dashboard — from its structure and pages to its advantages, insights, and practical applications.
Click to Purchases Crowdfunding Platforms Dashboard in Excel
🧭 What Is a Crowdfunding Platforms Dashboard in Excel?
A Crowdfunding Platforms Dashboard in Excel is an analytical tool designed to measure and visualize the key performance indicators (KPIs) of crowdfunding platforms.
It consolidates funding data, donation trends, platform ratings, commissions, and campaign outcomes into one interactive Excel file. By using this dashboard, users can easily compare performance by platform, category, campaign type, or region — and spot opportunities to improve results.
🎯 Core Objectives
-
Monitor platform performance and funding activities.
-
Analyze campaign success rates and donor behavior.
-
Track key financial and operational KPIs like donations, commissions, and satisfaction ratings.
-
Simplify decision-making through intuitive, visual analytics.
🧩 Structure of the Crowdfunding Platforms Dashboard
The dashboard contains five analytical pages — each dedicated to a unique aspect of crowdfunding operations — plus a Support Sheet and Data Sheet for backend management.
📋 The Pages:
1️⃣ Overview Page
2️⃣ Platform Analysis
3️⃣ Category Analysis
4️⃣ Campaign Type Analysis
5️⃣ Monthly Trends
Let’s explore each of these in detail.
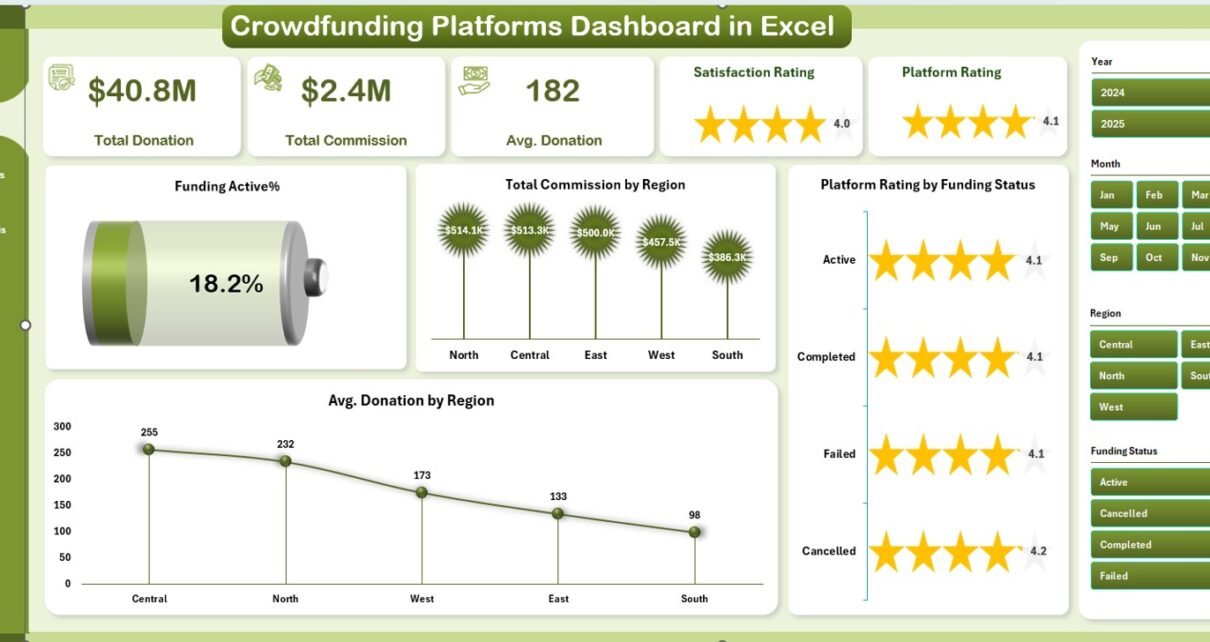
🏠 1. Overview Page – The Command Center
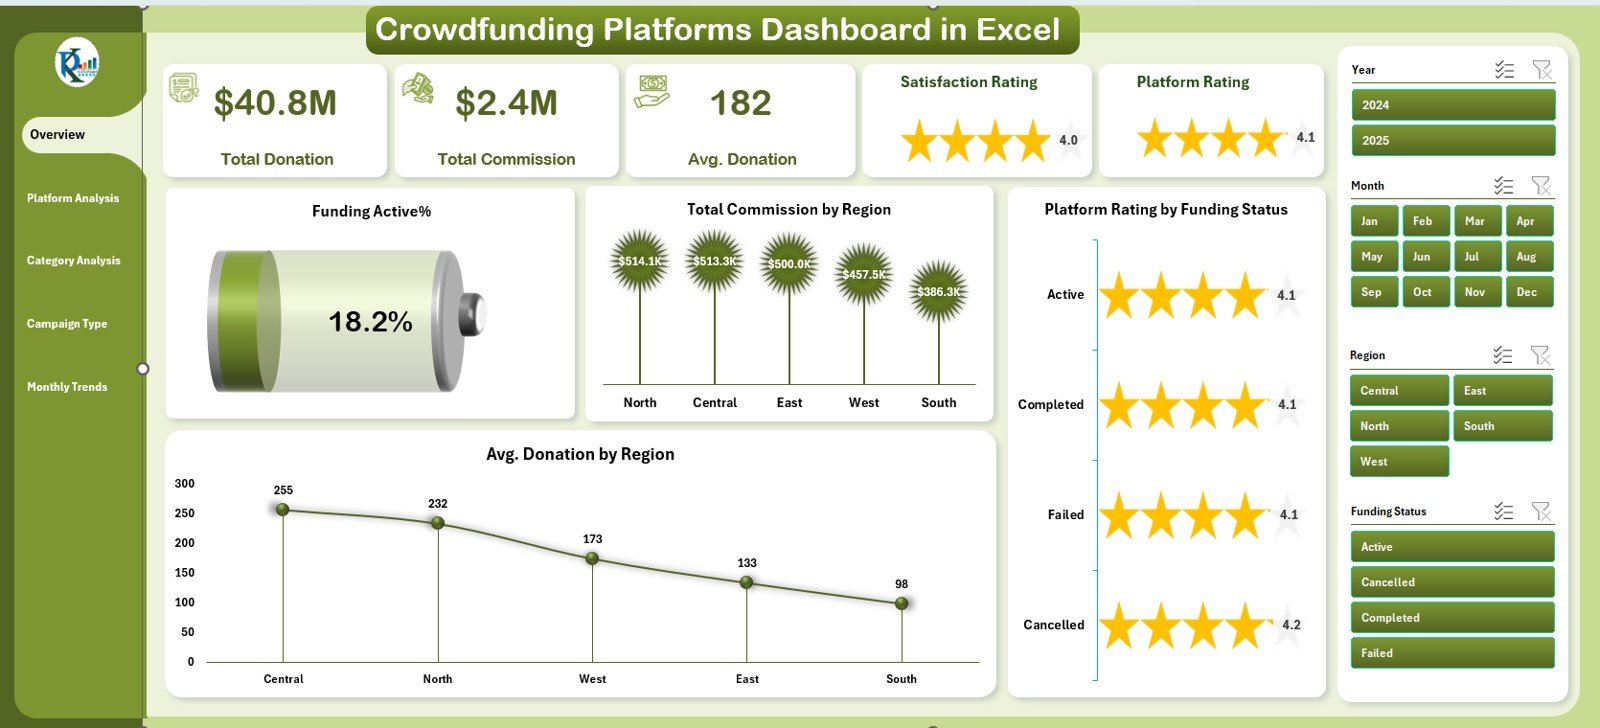
The Overview Page is the main hub of the dashboard. It presents a comprehensive snapshot of overall performance and key metrics.
🔹 Page Navigator
Located on the left side, the Page Navigator allows seamless switching between different analysis sections — making navigation quick and intuitive.
🔹 Filters and Cards
On the right side, you’ll find a slicer to filter data dynamically (by month, platform, or category).
Below the slicer, there are five KPI cards summarizing important metrics such as:
-
Total Campaigns
-
Total Funding Raised
-
Average Donation Amount
-
Platform Rating
-
Active Funding Percentage
🔹 Key Charts Displayed
The Overview Page features four visually rich charts:
-
Funding Active % – Displays the proportion of ongoing campaigns vs. completed ones.
-
Total Commission by Region – Shows revenue distribution across regions.
-
Platform Rating by Funding Status – Highlights customer feedback based on campaign success.
-
Average Donation by Region – Reveals giving patterns across geographical areas.
Together, these visuals provide a quick yet comprehensive view of global crowdfunding activity.
Click to Purchases Crowdfunding Platforms Dashboard in Excel
🧩 2. Platform Analysis – Evaluating Platform Performance
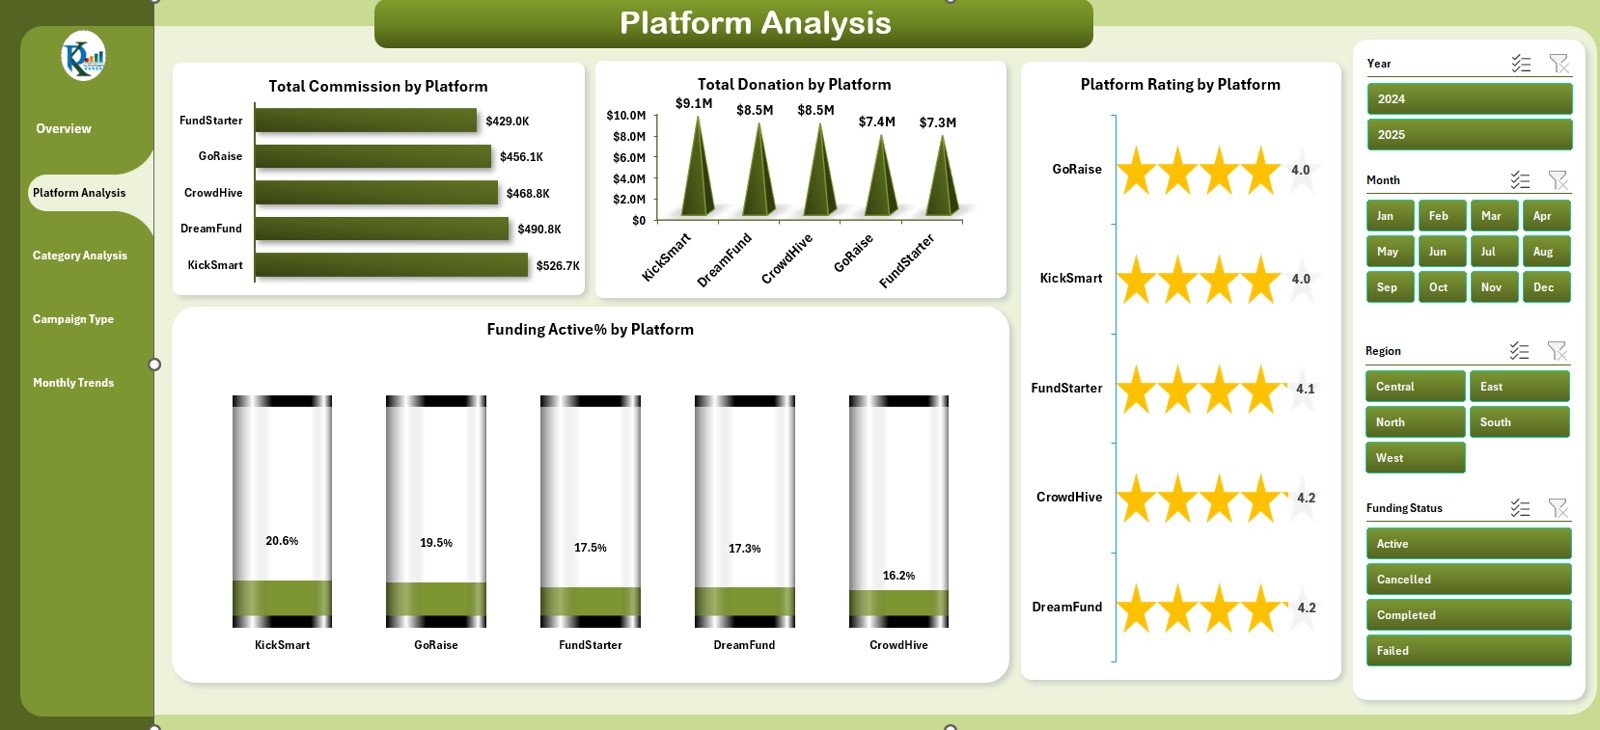
Different crowdfunding platforms perform differently depending on their focus, reach, and audience. The Platform Analysis Page helps you evaluate those variations.
🔹 Filters and Interactivity
On the right side, a slicer lets you filter results by platform, region, or time period.
🔹 Key Charts
This page includes four detailed charts:
-
Total Commission by Platform – Compares revenue contribution from each platform.
-
Total Donation by Platform – Analyzes how much funding each platform has helped generate.
-
Funding Active % by Platform – Identifies which platforms have the highest engagement rates.
-
Platform Rating by Platform – Tracks user satisfaction or ratings for every platform.
These insights help managers identify top-performing platforms and allocate marketing resources more effectively.
🧮 3. Category Analysis – Tracking Success by Project Type
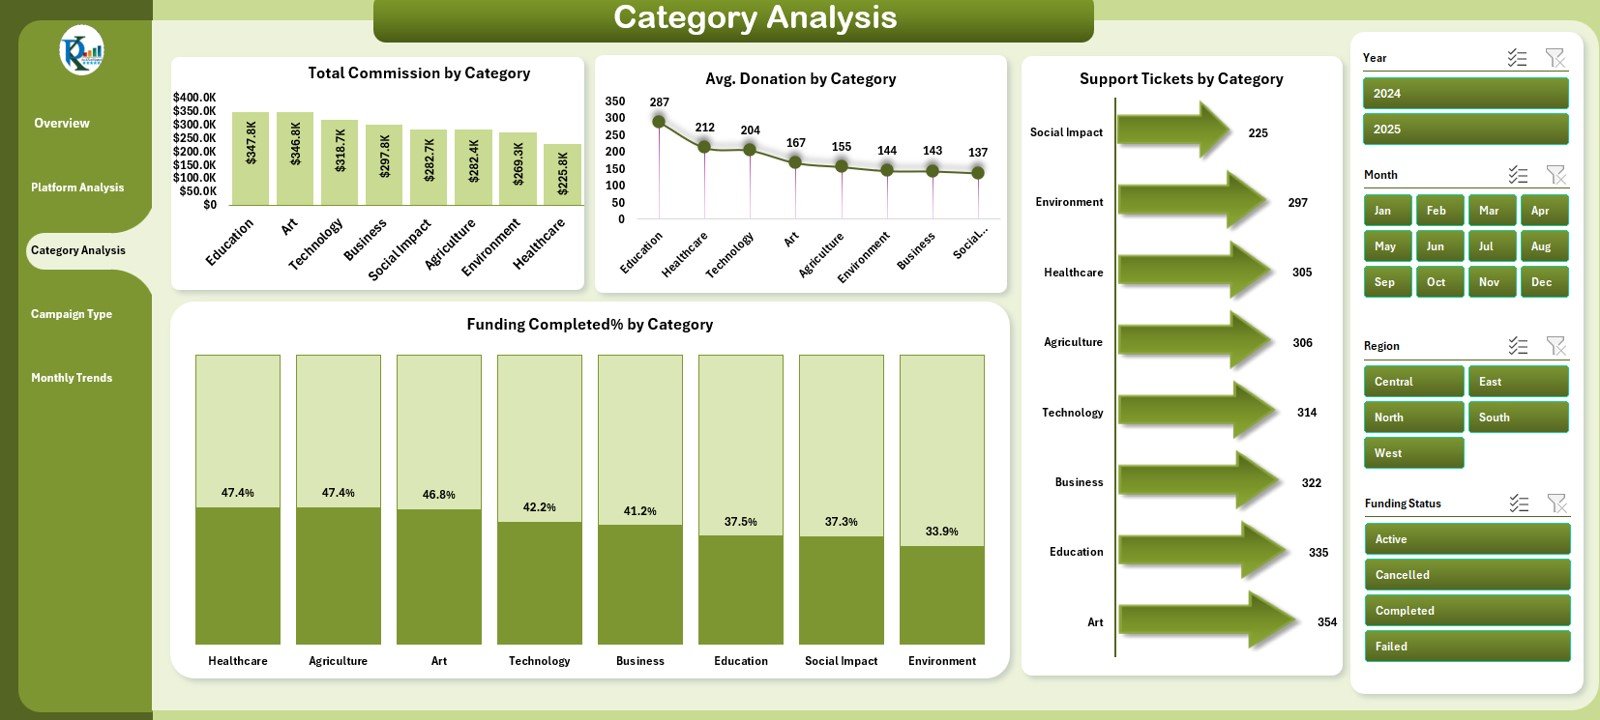
Every crowdfunding platform hosts multiple categories — such as technology, arts, education, or social causes. The Category Analysis Page breaks down performance across these categories.
🔹 Charts Included
-
Total Commission by Category – Shows which project types bring in the most revenue.
-
Average Donation by Category – Reveals donor generosity per category.
-
Funding Completed % by Category – Highlights which types of campaigns reach their targets most often.
-
Support Tickets by Category – Measures operational challenges or customer support volume by project type.
🔹 Use Case Example
A platform manager might discover that “Education Projects” consistently achieve over 95% funding completion, while “Tech Startups” face slower conversion. These insights enable better category prioritization and promotional planning.
💡 4. Campaign Type Analysis – Understanding Fundraising Models
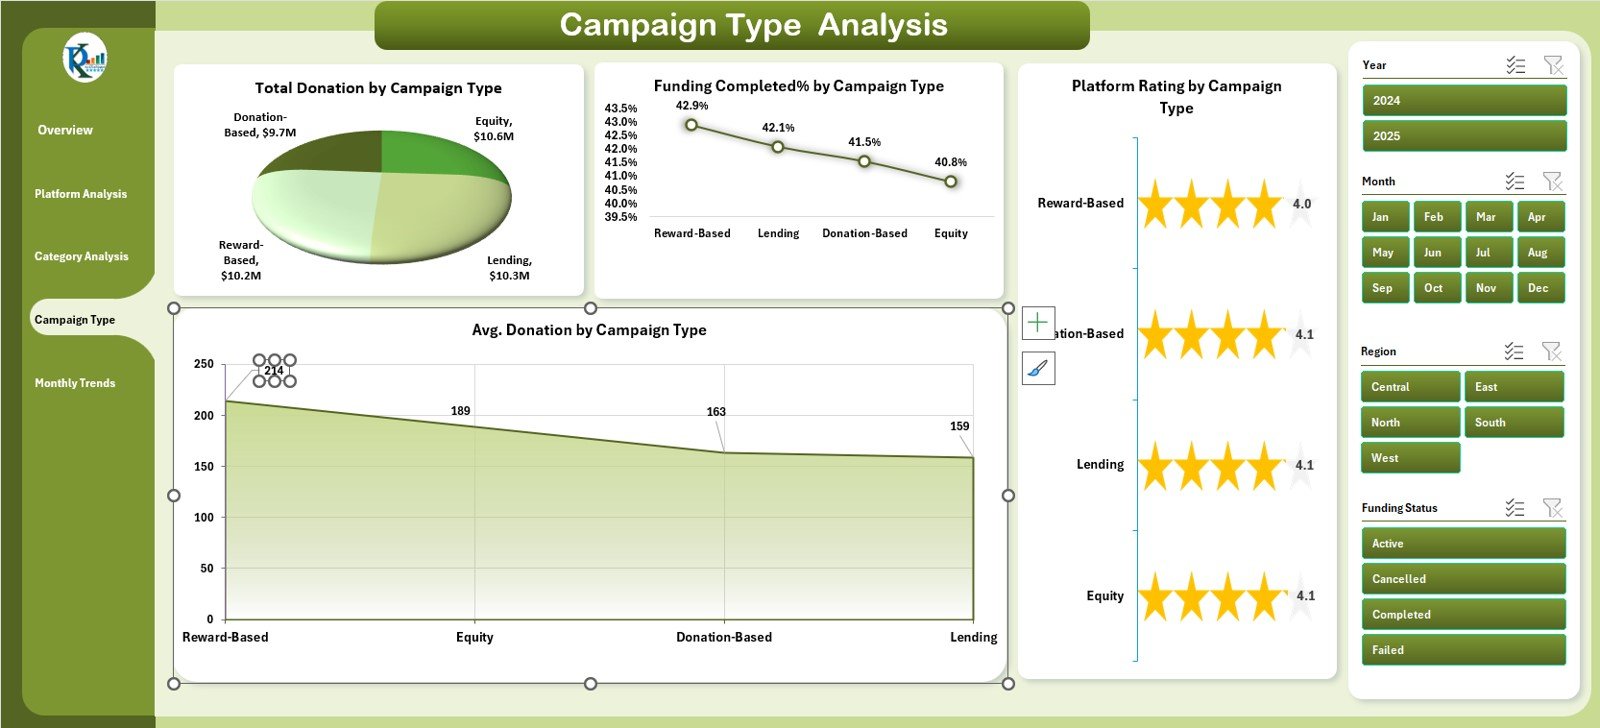
Crowdfunding campaigns operate under different models — such as donation-based, reward-based, or equity-based. The Campaign Type Analysis Page compares these types head-to-head.
🔹 Key Charts
-
Total Donation by Campaign Type – Displays total raised funds by type.
-
Funding Completed % by Campaign Type – Shows completion success across campaign models.
-
Average Donation by Campaign Type – Reveals the average contribution amount for each campaign type.
-
Platform Rating by Campaign Type – Analyzes user ratings and satisfaction for each fundraising model.
This section helps platform administrators or analysts understand which campaign models drive higher engagement and better donor experience.
📅 5. Monthly Trends – Tracking Growth Over Time
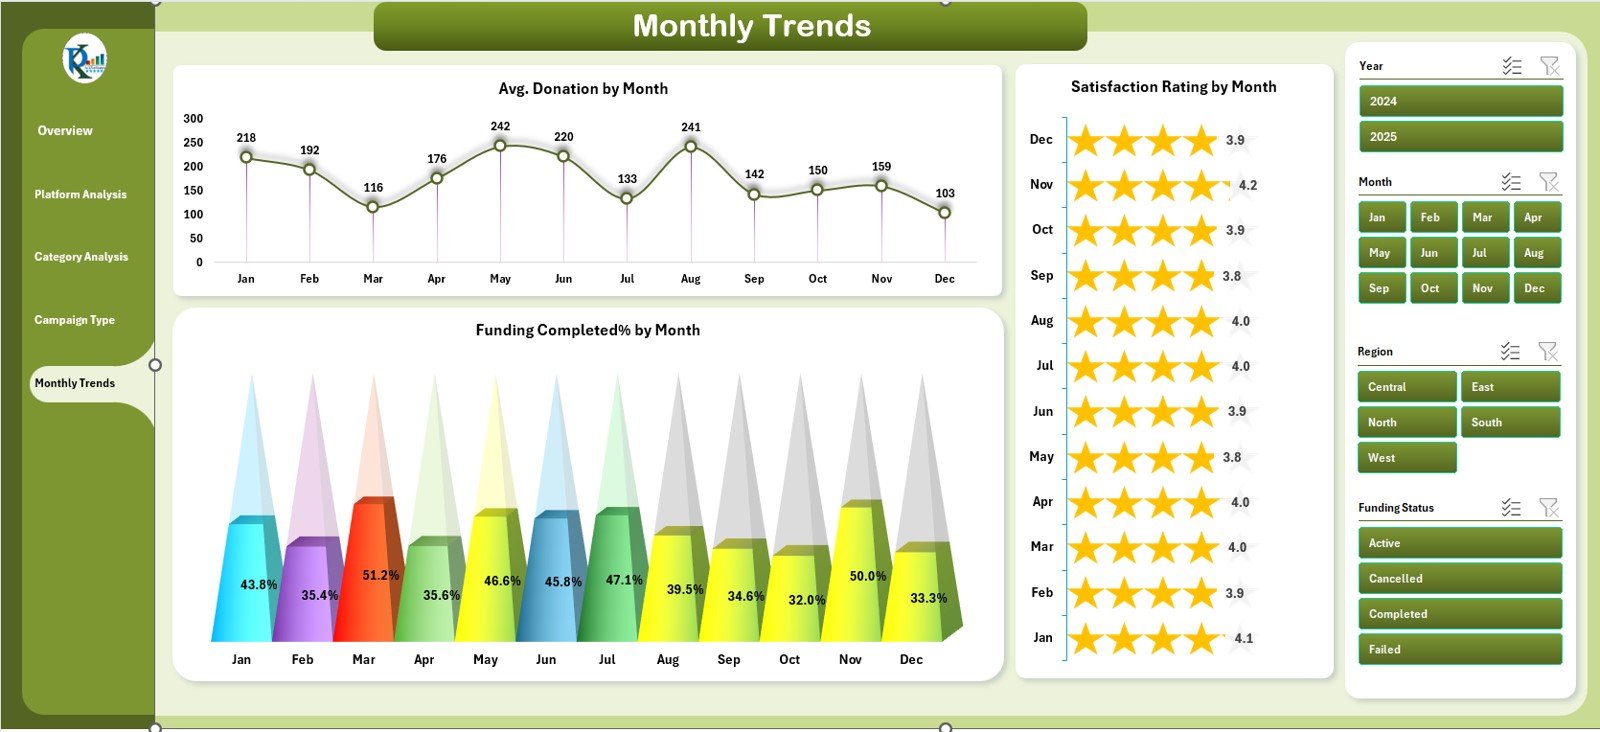
The Monthly Trends Page focuses on long-term performance evaluation. It helps users understand how the platform’s activity, engagement, and satisfaction evolve month by month.
🔹 Charts Included
-
Average Donation by Month – Visualizes donor generosity patterns throughout the year.
-
Satisfaction Rating by Month – Tracks changes in customer or participant satisfaction over time.
-
Funding Completed % by Month – Highlights month-wise performance efficiency.
🔹 Benefits
-
Identify high-performing months or seasonal trends.
-
Measure the impact of promotional campaigns.
-
Forecast future donation cycles and plan resource allocation.
📚 Support Sheet and Data Sheet – The Engine Behind the Dashboard
🧾 Support Sheet
This sheet contains reference data such as:
-
Campaign types
-
Region lists
-
Platform names
-
Category details
It ensures that dropdown menus and filters function smoothly across the dashboard. - Click to Purchases Crowdfunding Platforms Dashboard in Excel
📊 Data Sheet
The Data Sheet holds all raw transactional data — including campaign details, donations, commissions, satisfaction ratings, and regions.
By maintaining this structured data source, the dashboard remains accurate, consistent, and easy to refresh each reporting period.
⚙️ How the Dashboard Works
The Crowdfunding Platforms Dashboard in Excel operates on a simple but effective workflow:
-
Enter or import your campaign data into the Data Sheet.
-
Refresh the dashboard using Excel’s built-in data refresh tools.
-
View results across different analytical pages.
-
Use slicers and dropdowns to focus on specific metrics, platforms, or time periods.
All visuals and KPIs update instantly — no manual recalculations needed.
🌟 Advantages of the Crowdfunding Platforms Dashboard in Excel
Using this dashboard can transform how crowdfunding teams monitor and improve their operations.
✅ Key Advantages
-
Comprehensive View: Monitor campaign, category, and platform data all in one file.
-
Real-Time Insights: Visualize live updates from the data sheet in seconds.
-
Increased Transparency: Provides clear visibility across all fundraising metrics.
-
Time Savings: Reduces manual analysis time through automation.
-
Data-Driven Decisions: Helps optimize campaigns and resource allocation.
-
Visual Clarity: Charts and cards make complex metrics easy to interpret.
-
Customizable Layout: Easily add new KPIs or modify visuals as per business needs.
-
User-Friendly Design: No coding or Power BI required — everything runs in Excel.
🧠 Opportunities for Improvement
While the existing version of this dashboard is robust, a few enhancements could make it even more powerful.
🔹 Suggested Improvements
-
Automate Data Import: Connect live Google Sheets or APIs for real-time campaign updates.
-
Add Profitability Metrics: Include ROI or cost-per-donation tracking.
-
Incorporate Forecasting Models: Use Excel formulas to predict next-month donation trends.
-
Introduce Donor Segmentation: Analyze performance by donor demographics or regions.
-
Add Visual Alerts: Automatically highlight platforms below target performance.
These additions can help expand the dashboard’s utility for professional campaign managers and financial analysts.
Click to Purchases Crowdfunding Platforms Dashboard in Excel
🧭 Best Practices for Using the Dashboard
To get the most out of your Crowdfunding Platforms Dashboard, follow these proven best practices.
🔸 Data Preparation
-
Keep data clean, structured, and validated before importing.
-
Use consistent naming conventions for platforms and categories.
-
Double-check date formats for monthly trends.
🔸 Dashboard Maintenance
-
Refresh data regularly (weekly or monthly).
-
Archive older versions for historical comparison.
-
Protect formula cells to avoid accidental overwriting.
🔸 Analysis and Decision-Making
-
Compare current vs. previous months to detect patterns.
-
Monitor high-performing platforms to replicate success strategies.
-
Use KPIs to identify underperforming categories needing support.
By maintaining data quality and reviewing KPIs consistently, you’ll ensure accurate insights and smarter business decisions.
📊 Use Cases of the Crowdfunding Platforms Dashboard
This Excel dashboard is ideal for:
-
Platform Owners: To monitor revenue and campaign success rates.
-
Marketing Teams: To evaluate donation trends and engagement metrics.
-
Project Managers: To track campaign performance and fundraising efficiency.
-
Investors or Analysts: To assess platform profitability and donor confidence.
Because it’s built entirely in Excel, it requires no special software or technical expertise — making it perfect for startups, NGOs, and research teams.
🧾 Conclusion
The Crowdfunding Platforms Dashboard in Excel is more than just a report — it’s a complete analytical solution for managing and improving crowdfunding performance.
From tracking active funding campaigns to analyzing donations, commissions, and ratings, this dashboard offers a 360-degree view of every metric that matters. With its intuitive design, interactive navigation, and dynamic visuals, even non-technical users can explore insights effortlessly.
Whether you’re managing one platform or analyzing several, this Excel dashboard helps you make informed, data-backed decisions that lead to better fundraising outcomes.
You can download the Crowdfunding Platforms Dashboard in Excel from NextGenTemplates.com and start visualizing your fundraising performance today.
Click to Purchases Crowdfunding Platforms Dashboard in Excel
❓ Frequently Asked Questions (FAQs)
1. What is a Crowdfunding Platforms Dashboard in Excel?
It’s a ready-to-use Excel dashboard that helps monitor donations, commissions, and campaign success across crowdfunding platforms.
2. How many pages does it include?
It includes five analytical pages — Overview, Platform Analysis, Category Analysis, Campaign Type Analysis, and Monthly Trends — plus a Support and Data Sheet.
3. What kind of data is required?
Campaign details such as donation amounts, commission, region, satisfaction ratings, and campaign type.
4. Can I customize this dashboard?
Yes, you can easily add or modify KPIs, charts, or filters as per your analysis needs.
5. Do I need coding knowledge?
No. It’s completely Excel-based and user-friendly.
6. Can it track multiple platforms?
Yes. You can analyze multiple crowdfunding platforms simultaneously.
7. Does it support regional analysis?
Yes. You can compare donations, ratings, and commissions by region or country.
8. How often should I update the data?
You can refresh monthly or weekly depending on the number of campaigns.
9. Can it generate reports for management?
Yes. Charts and visuals can be exported to PDF or PowerPoint.
10. Where can I get it?
You can download it from NextGenTemplates.com and start improving your crowdfunding analytics today.
Click to Purchases Crowdfunding Platforms Dashboard in Excel
Visit our YouTube channel to learn step-by-step video tutorials