In today’s highly regulated business environment, organizations must meet internal policies, industry standards, and legal requirements at all times. However, compliance monitoring becomes difficult when teams rely on scattered Excel files, emails, and manual reports. As a result, leaders struggle to identify risks early, track compliance performance, and take timely action.
That is exactly where a Compliance Monitoring KPI Dashboard in Microsoft Power BI plays a critical role.
This in-depth guide explains what a Compliance Monitoring KPI Dashboard in Power BI is, how it works, and why it is essential for compliance teams, auditors, risk managers, and leadership. Moreover, you will explore its features, advantages, best practices, and frequently asked questions. By the end of this article, you will clearly understand how this ready-to-use dashboard helps organizations maintain compliance with confidence and clarity.
Click to buy Compliance Monitoring KPI Dashboard in Power BI
What Is a Compliance Monitoring KPI Dashboard in Power BI?
A Compliance Monitoring KPI Dashboard in Power BI is an interactive, data-driven reporting solution designed to track, measure, and analyze key compliance-related performance indicators.
Instead of reviewing static reports or manually checking compliance status, this dashboard provides a centralized view of all compliance KPIs. Consequently, decision-makers can instantly see which KPIs meet targets, which ones miss targets, and where corrective actions are required.
Furthermore, the dashboard uses structured Excel-based data sources, dynamic calculations, and interactive visuals. As a result, users gain real-time insights without complex technical effort.
Why Do Organizations Need a Compliance Monitoring KPI Dashboard?
Compliance failures can lead to penalties, reputational damage, and operational disruption. Therefore, organizations must continuously monitor compliance performance rather than reacting after issues occur.
A Compliance Monitoring KPI Dashboard helps because it:
- Centralizes all compliance KPIs in one place
- Improves transparency across departments
- Enables proactive risk identification
- Supports data-driven decision-making
- Reduces manual reporting effort
Moreover, leadership teams can easily track performance trends over time. Consequently, they can act faster and maintain stronger governance.
How Does the Compliance Monitoring KPI Dashboard in Power BI Work?
The dashboard works by connecting Microsoft Excel as the data source with Power BI as the visualization and analytics layer.
The overall flow includes:
- Data entry in structured Excel templates
- Automated calculations in Power BI
- Interactive visuals, tables, and KPIs
- Drill-through analysis for detailed insights
As a result, users only need to update Excel data regularly. Power BI then refreshes visuals instantly.
What Are the Key Pages in the Compliance Monitoring KPI Dashboard?
This ready-to-use Compliance Monitoring KPI Dashboard in Power BI includes three professionally designed pages. Each page serves a specific analytical purpose.
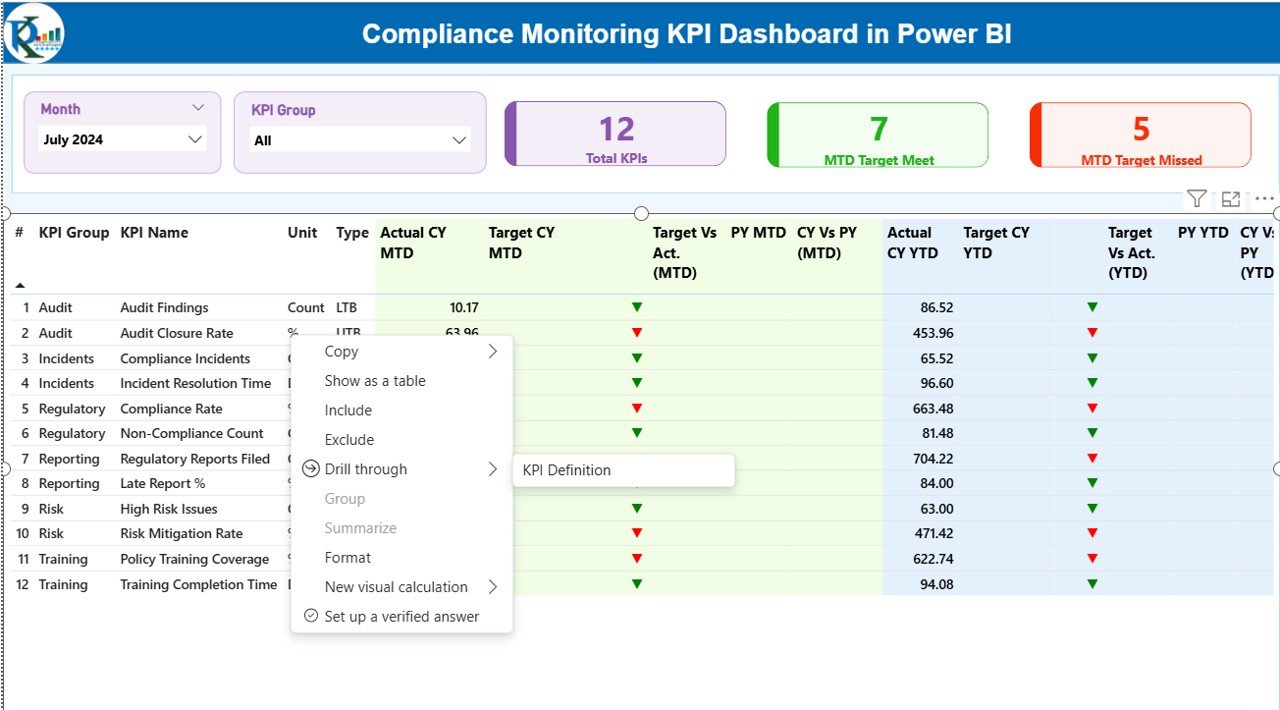
What Insights Does the Summary Page Provide?
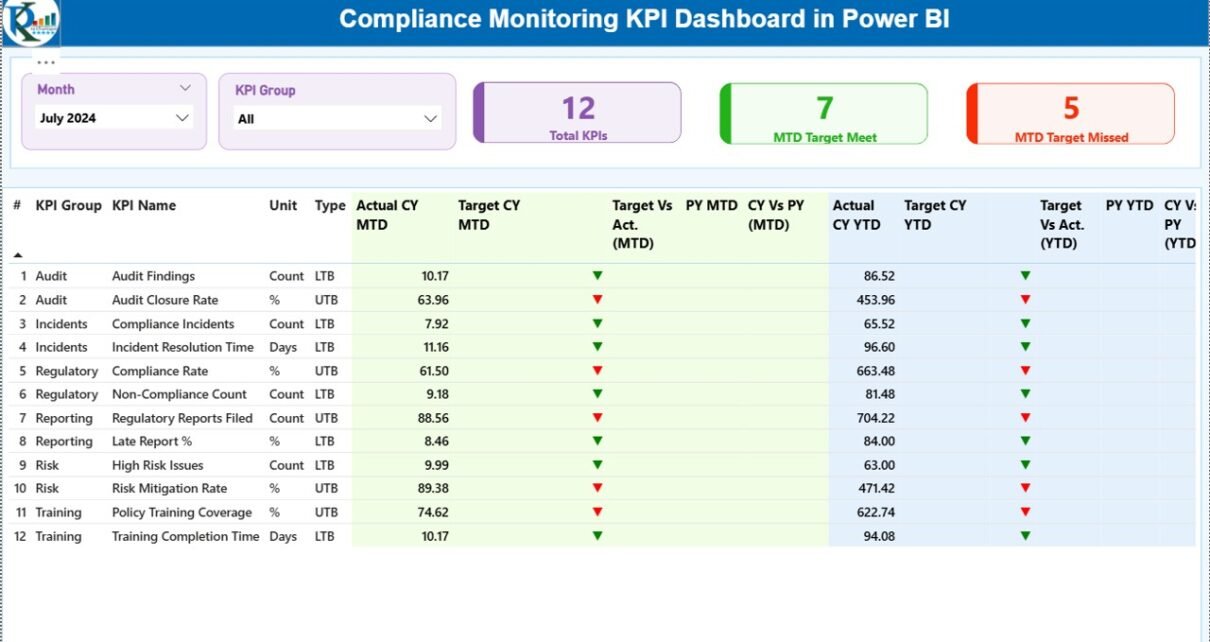
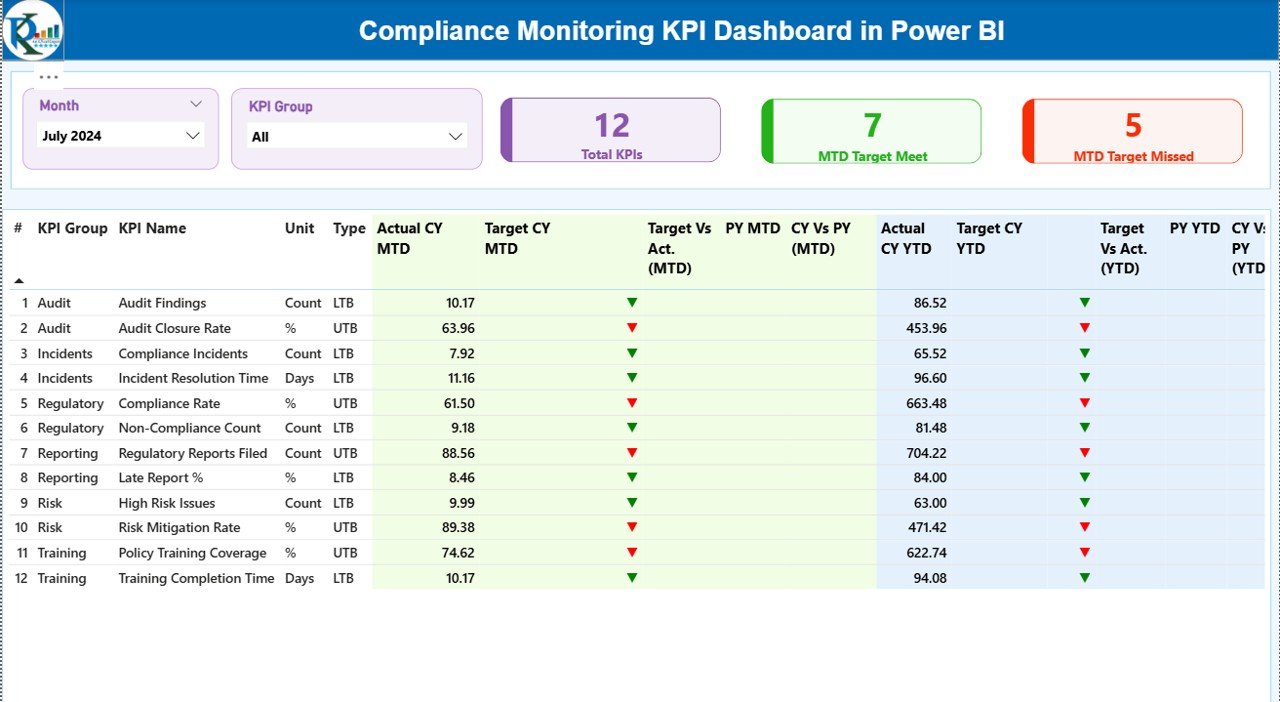
The Summary Page is the main landing page of the dashboard. It delivers a high-level overview of compliance performance across all KPIs.
Key Filters and Controls
- Month slicer for time-based analysis
- KPI Group slicer for category-level filtering
These slicers allow users to focus on specific periods and compliance areas quickly.
KPI Cards on the Summary Page
At the top of the page, three KPI cards highlight overall performance:
- Total KPIs Count – Total number of compliance KPIs
- MTD Target Meet Count – KPIs meeting targets for the month
- MTD Target Missed Count – KPIs missing targets for the month
These cards instantly communicate compliance health.
What Details Shows in the Compliance KPI Table?
Below the cards, a detailed KPI table displays comprehensive compliance metrics.
The table includes:
- KPI Number – Unique sequence number
- KPI Group – Compliance category or domain
- KPI Name – Name of the compliance KPI
- Unit – Measurement unit
- Type – LTB (Lower the Better) or UTB (Upper the Better)
How Does MTD (Month-to-Date) Analysis Work?
For monthly tracking, the dashboard shows:
- Actual CY MTD – Current year actual MTD value
- Target CY MTD – Current year target MTD value
- MTD Icon – ▲ or ▼ with green/red indicators
- Target vs Actual (MTD) – Actual ÷ Target (%)
- PY MTD – Previous year MTD value
- CY vs PY (MTD) – Current vs previous year comparison
As a result, users can instantly identify short-term compliance deviations.
How Does YTD (Year-to-Date) Analysis Improve Compliance Tracking?
For long-term performance, the dashboard includes:
- Actual CY YTD – Current year actual YTD
- Target CY YTD – Current year target YTD
- YTD Icon – ▲ or ▼ with color indicators
- Target vs Actual (YTD) – Actual ÷ Target (%)
- PY YTD – Previous year YTD value
- CY vs PY (YTD) – Year-over-year comparison
Consequently, leaders can evaluate sustained compliance trends instead of isolated monthly results.
Click to buy Compliance Monitoring KPI Dashboard in Power BI
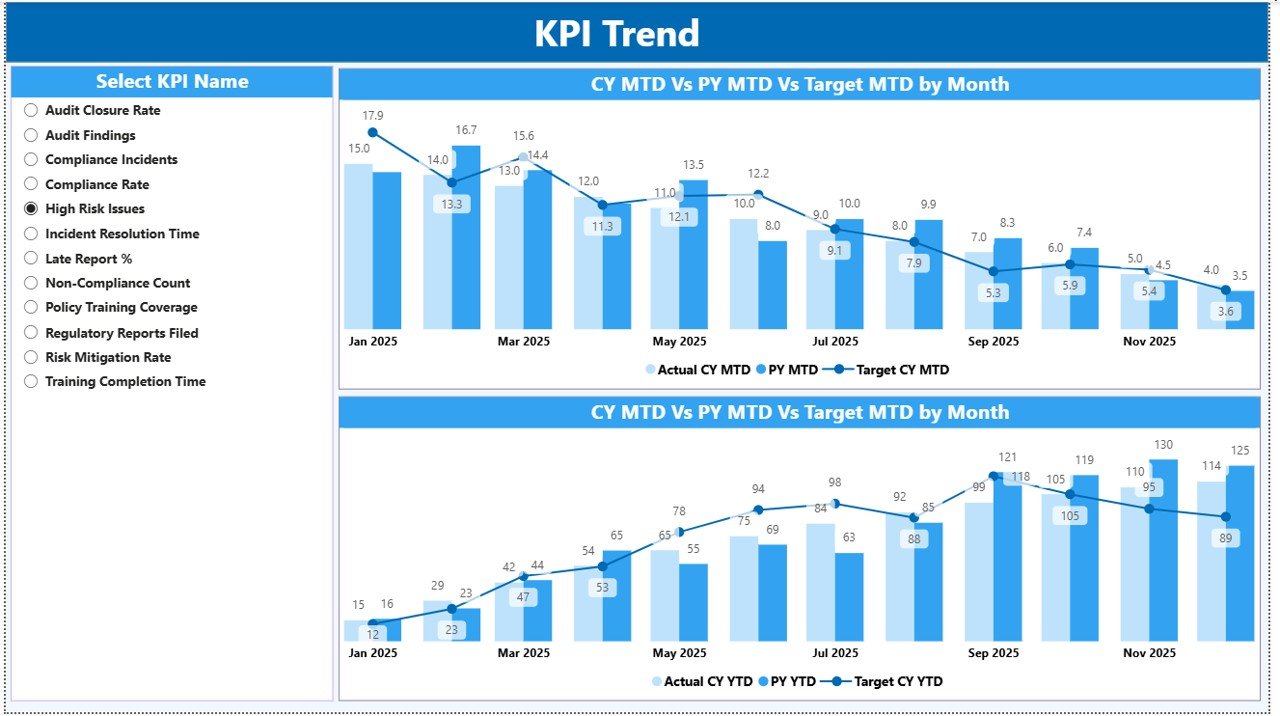
How Does the KPI Trend Page Help Identify Patterns?
The KPI Trend Page focuses on trend analysis and historical performance.
Key Features of the KPI Trend Page
- Two combo charts showing:
Actual Current Year values
Actual Previous Year values
Target values
Separate visuals for MTD and YTD trends
KPI Name slicer for focused analysis
By analyzing trends, compliance teams can identify recurring issues, seasonal risks, and improvement opportunities.
Click to buy Compliance Monitoring KPI Dashboard in Power BI
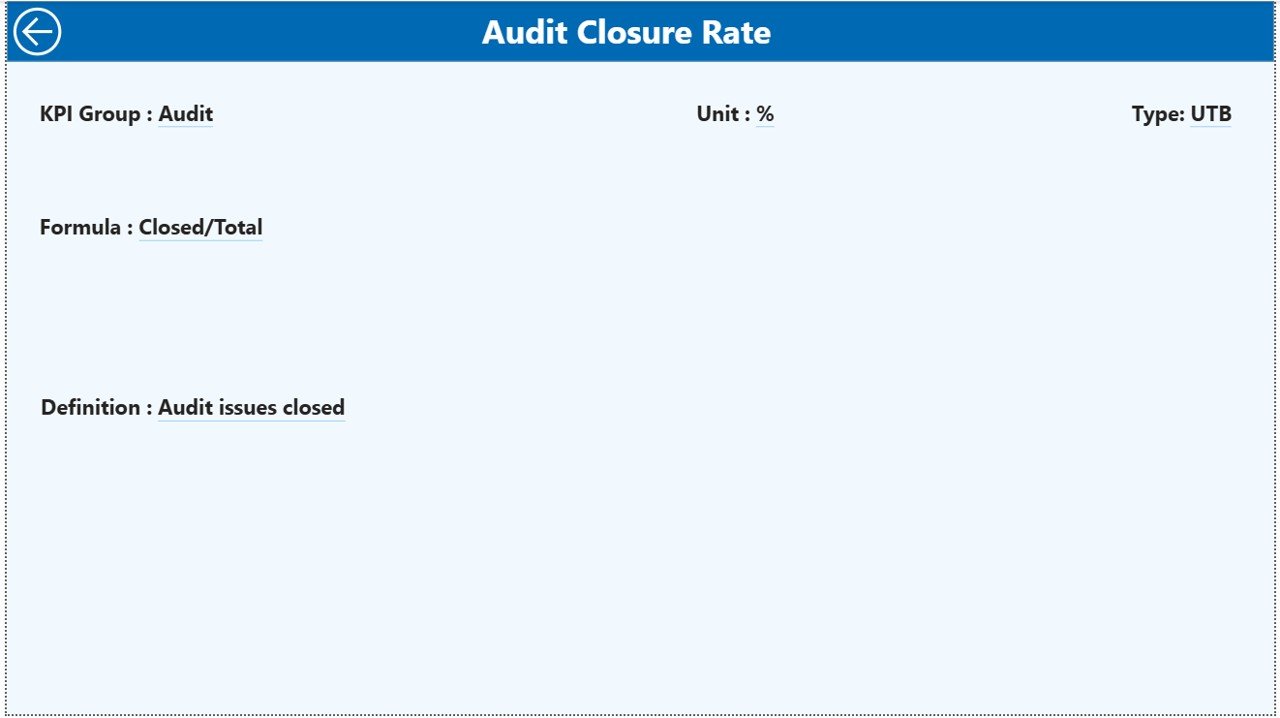
What Is the KPI Definition Page and Why Is It Important?
The KPI Definition Page is a hidden drill-through page designed for clarity and governance.
What Does This Page Show?
- KPI Formula
- KPI Definition
- KPI Purpose and interpretation
Users can drill through from the Summary Page to view detailed KPI explanations. After reviewing, they can return to the main page using the Back button at the top-left corner.
This design ensures clarity without cluttering the main dashboard.
Click to buy Compliance Monitoring KPI Dashboard in Power BI
How Is the Excel Data Structured for This Dashboard?
The Compliance Monitoring KPI Dashboard uses a structured Excel file with three worksheets.
Input_Actual Sheet: What Data Goes Here?
This sheet stores actual compliance performance data.
Key Columns
- KPI Name
- Month (first date of the month)
- MTD Actual Value
- YTD Actual Value
Users only need to update actual values regularly.
Click to buy Compliance Monitoring KPI Dashboard in Power BI
Input_Target Sheet: How Are Targets Defined?
This sheet captures compliance targets.
Key Columns
- KPI Name
- Month (first date of the month)
- MTD Target Value
- YTD Target Value
Targets remain flexible and easy to revise.
KPI Definition Sheet: Why Is This Sheet Critical?
This sheet defines each KPI clearly.
Key Columns
- KPI Number
- KPI Group
- KPI Name
- Unit
- Formula
- Definition
- Type (LTB or UTB)
This structure ensures consistent understanding across teams.
Advantages of Compliance Monitoring KPI Dashboard in Power BI
A Compliance Monitoring KPI Dashboard delivers measurable business value.
Key Advantages
- Centralized compliance visibility
- Faster identification of compliance risks
- Reduced manual reporting effort
- Improved audit readiness
- Clear MTD and YTD performance tracking
- Stronger governance and accountability
Moreover, leadership gains confidence in compliance reporting.
Best Practices for the Compliance Monitoring KPI Dashboard in Power BI
To maximize dashboard value, follow these best practices.
Best Practices Checklist
- Use clear and well-defined KPIs
- Classify KPIs correctly as LTB or UTB
- Update Excel data on a fixed schedule
- Validate data before refresh
- Use consistent naming conventions
- Review trends monthly and quarterly
- Share insights with stakeholders regularly
By following these practices, organizations maintain reliable and actionable dashboards.
Who Can Use a Compliance Monitoring KPI Dashboard?
This dashboard suits many roles and industries, including:
- Compliance officers
- Internal audit teams
- Risk and governance managers
- Legal and regulatory teams
- Senior leadership and boards
Therefore, it supports organization-wide compliance monitoring.
Conclusion: Why Should You Use a Compliance Monitoring KPI Dashboard in Power BI?
A Compliance Monitoring KPI Dashboard in Power BI transforms complex compliance data into clear, actionable insights. Instead of reactive reporting, organizations gain proactive visibility into compliance performance.
With structured Excel inputs, interactive Power BI visuals, and drill-through KPI definitions, this dashboard empowers teams to track compliance efficiently and confidently. As a result, organizations reduce risk, improve governance, and maintain regulatory confidence.
Frequently Asked Questions (FAQs)
- What is a Compliance Monitoring KPI Dashboard in Power BI?
It is an interactive dashboard that tracks compliance KPIs using Excel data and Power BI visuals.
- Can I customize KPIs in the dashboard?
Yes, you can add, remove, or modify KPIs through the Excel definition sheet.
- Does this dashboard support MTD and YTD analysis?
Yes, it includes detailed MTD and YTD performance metrics with comparisons.
- Is coding required to use this dashboard?
No, users only update Excel data. Power BI handles calculations automatically.
- Who benefits most from this dashboard?
Compliance teams, auditors, risk managers, and leadership benefit the most.
Visit our YouTube channel to learn step-by-step video tutorials
Watch the step-by-step video tutorial:
Click to buy Compliance Monitoring KPI Dashboard in Power BI