Hedge Fund Administration Dashboard in Power BI helps fund administrators, CFO teams, operations analysts, investor services teams, and finance consultants review fund operations across transactions, operating expense, redemptions, management fees, settlement performance, NAV, performance fees, investor segments, strategies, regions, funds, administrators, and asset classes. Hedge fund administration data can become scattered across spreadsheets, administrator exports, accounting systems, and monthly reporting packs. This editable PBIX dashboard gives those records a focused analytics layer that can be refreshed and filtered inside Power BI Desktop.
The template includes high-level KPI cards, multiple analysis pages, chart-based reporting, and slicers for quick filtering. Users can open the PBIX file, connect or replace the sample source, refresh the report, and review the fund administration story without starting from a blank canvas.
Click here to view the Hedge Fund Administration Dashboard in Power BI
Hedge Fund Administration Dashboard in Power BI
Key Features of Hedge Fund Administration Dashboard in Power BI
- Executive KPI cards: Track Total Transactions, Total Operating Expense, Total Redemptions, and Total Management Fee from the top of the Overview page.
- Multiple report pages: Review Overview, Fund Analysis, Investor Flow, and Fee Analysis without crowding every visual into one screen.
- Interactive slicers: Filter the report quickly by available fields such as fund, month, region, strategy, status, investor segment, currency, administrator, and asset class.
- Transaction and settlement analysis: Use transaction status and settlement-rate visuals to identify operational bottlenecks.
- Investor flow reporting: Compare subscriptions and redemptions by month, quarter, segment, and strategy.
- Fee and expense visibility: Review management fee, performance fee, and operating expense by fund, region, month, and asset class.
- Editable PBIX file: Customize visuals, measures, labels, colors, fields, and report pages in Power BI Desktop.
Dashboard Pages Explanation
1. Overview Page
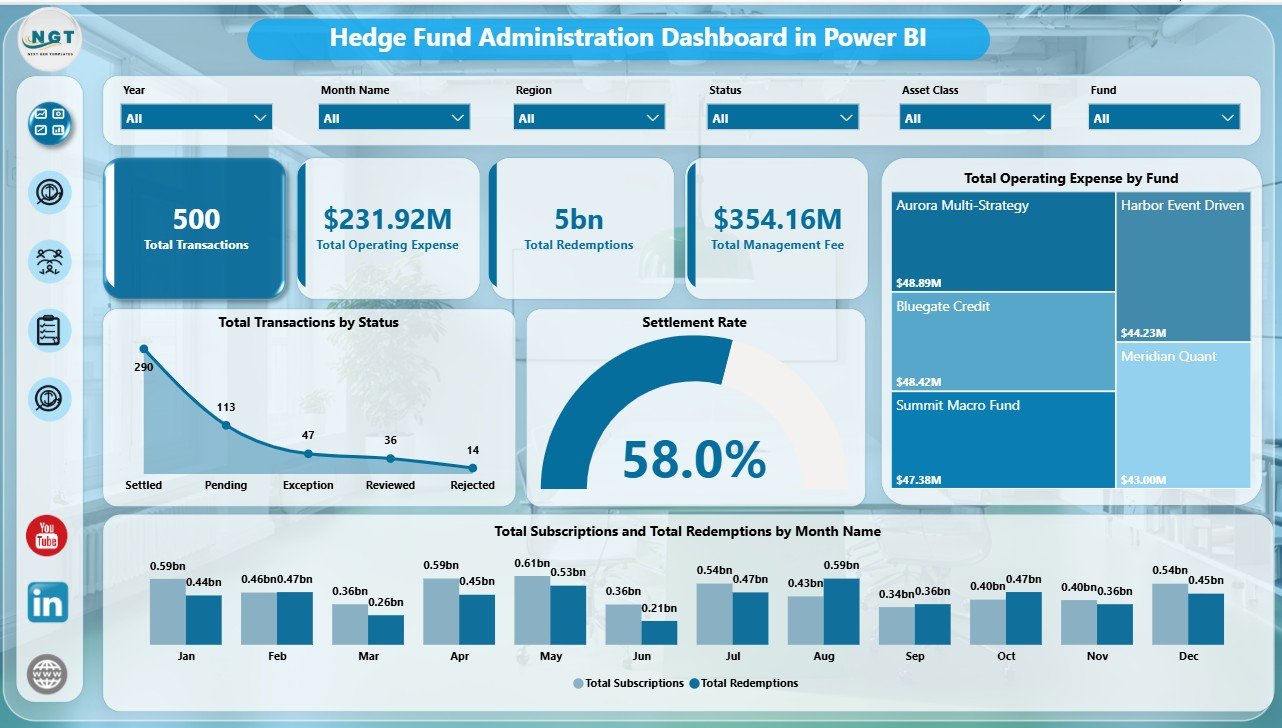
The Overview Page gives the leadership-level snapshot of the hedge fund administration process. At the top, the dashboard shows Total Transactions, Total Operating Expense, Total Redemptions, and Total Management Fee. These cards help users review activity volume, cost pressure, investor outflow, and recurring fee scale before moving into detailed analysis.
Total Transactions by Status: This chart shows how transactions are distributed across processing statuses. It helps administrators quickly identify whether activity is concentrated in completed, pending, rejected, or exception-heavy areas.
Settlement Rate by Overall Transactions: This visual shows settlement quality across transaction activity. It is useful for monitoring processing discipline and identifying where operational follow-up may be needed.
Total Operating Expense by Fund: This chart compares operating expense across funds. CFO and fund accounting teams can use it to identify funds with higher cost pressure.
Total Subscriptions and Total Redemptions by Month Name: This monthly chart compares inflows and outflows over time. It helps investor relations teams explain periods with higher subscription demand or redemption pressure.
Overview Page
2. Fund Analysis
The Fund Analysis page focuses on portfolio value, fee contribution, strategy movement, currency exposure, and investor segment behavior. This page is useful when management needs to understand what is driving the fund administration results beyond the top-line cards.
Total NAV by Currency: This visual shows how NAV is distributed across currencies. It helps teams understand currency-level concentration and reporting exposure.
Total Performance Fee by Asset Class: This chart highlights performance fee contribution by investment type. Finance teams can use it to see where incentive-fee movement is strongest.
Total Subscriptions and Total Redemptions by Investor Segment: This chart compares investor flow by segment. It helps teams understand whether capital movement is concentrated among institutional, private, intermediary, or other investor groups.
Total Subscriptions and Total Redemptions by Strategy: This visual compares inflows and outflows across investment strategies. It helps leaders review whether specific strategies are attracting or losing capital.
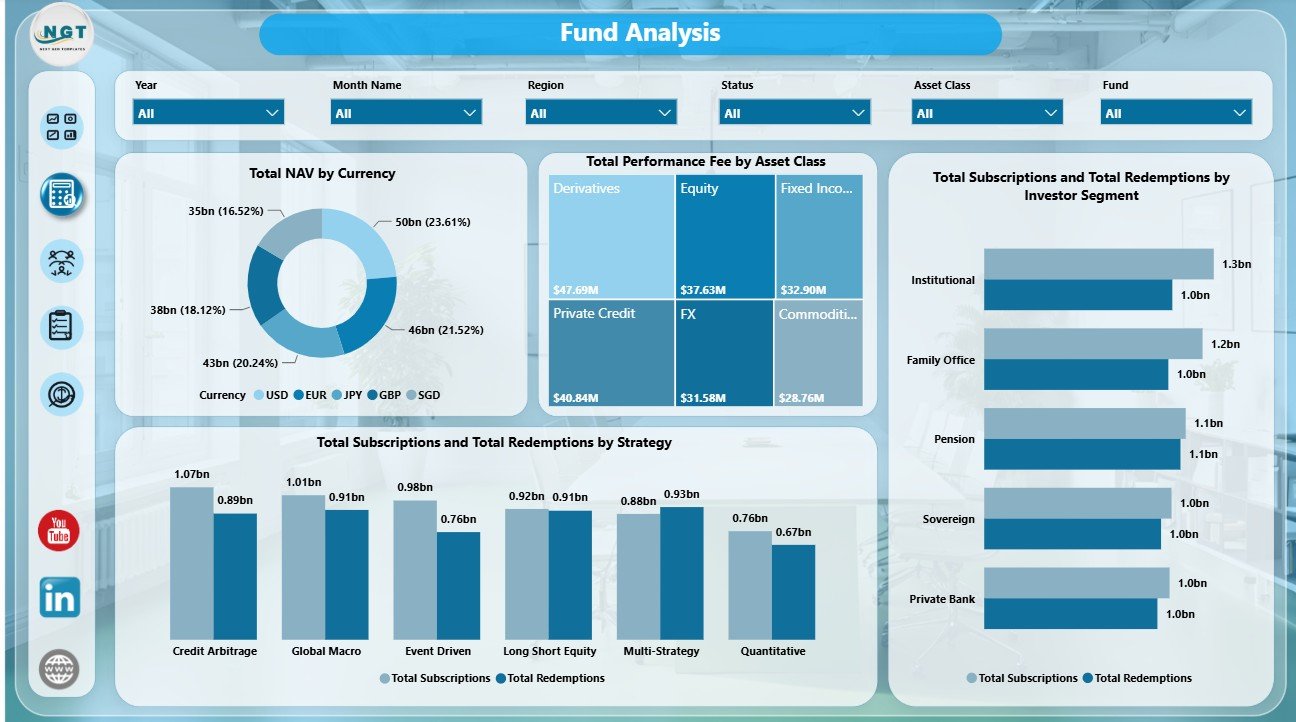
Fund Analysis
3. Investor Flow
The Investor Flow page connects management fees, administrator exceptions, quarterly capital movement, and operating expense trends. It gives investor services and operations teams a view of where investor activity and processing workload are concentrated.
Total Management Fee by Region: This chart shows which regions contribute the most management fee. It supports regional reporting and fee-contribution review.
Exception Transactions by Administrator: This visual identifies exception activity by administrator. Operations managers can use it to spot processing ownership issues or training needs.
Total Subscriptions and Total Redemptions by Quarter: This chart summarizes capital movement across quarters. It is useful for board packs, investor updates, and quarterly review meetings.
Total Operating Expense by Month Name: This chart tracks expense movement by month. It helps users identify cost spikes and recurring expense trends.
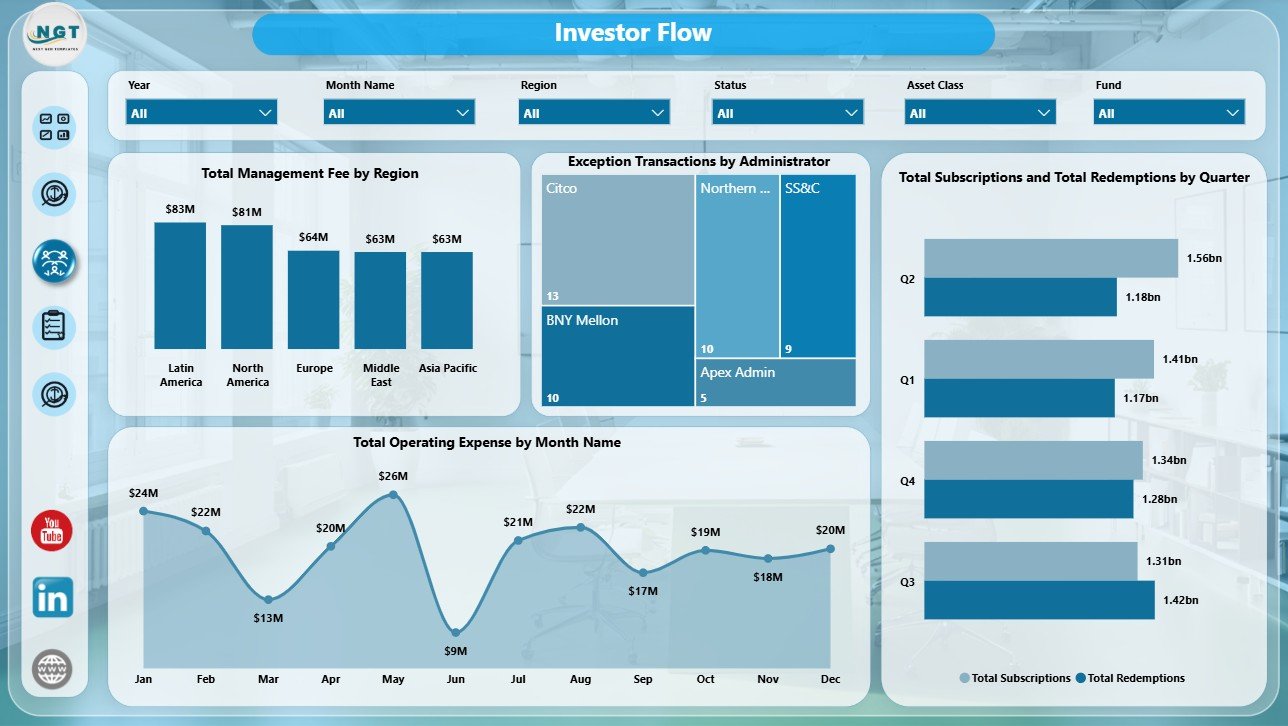
Investor Flow
4. Fee Analysis
The Fee Analysis page is built for finance and fund accounting review. It brings transaction mix, settlement rate, management fee, operating expense, and performance fee together in one dedicated page.
Total Transactions by Asset Class: This chart shows transaction activity by investment type. It helps teams understand which asset classes are creating the most administrative workload.
Settlement Rate by Fund: This chart compares settlement quality across funds. It helps operations teams identify funds where processing may need review.
Total Management Fee and Total Operating Expense by Fund: This combined view compares fee contribution and expense burden by fund. It is useful for understanding margin pressure and fund-level efficiency.
Total Performance Fee by Month Name: This visual tracks performance fee movement by month. It helps finance teams monitor incentive-fee patterns through the reporting period.
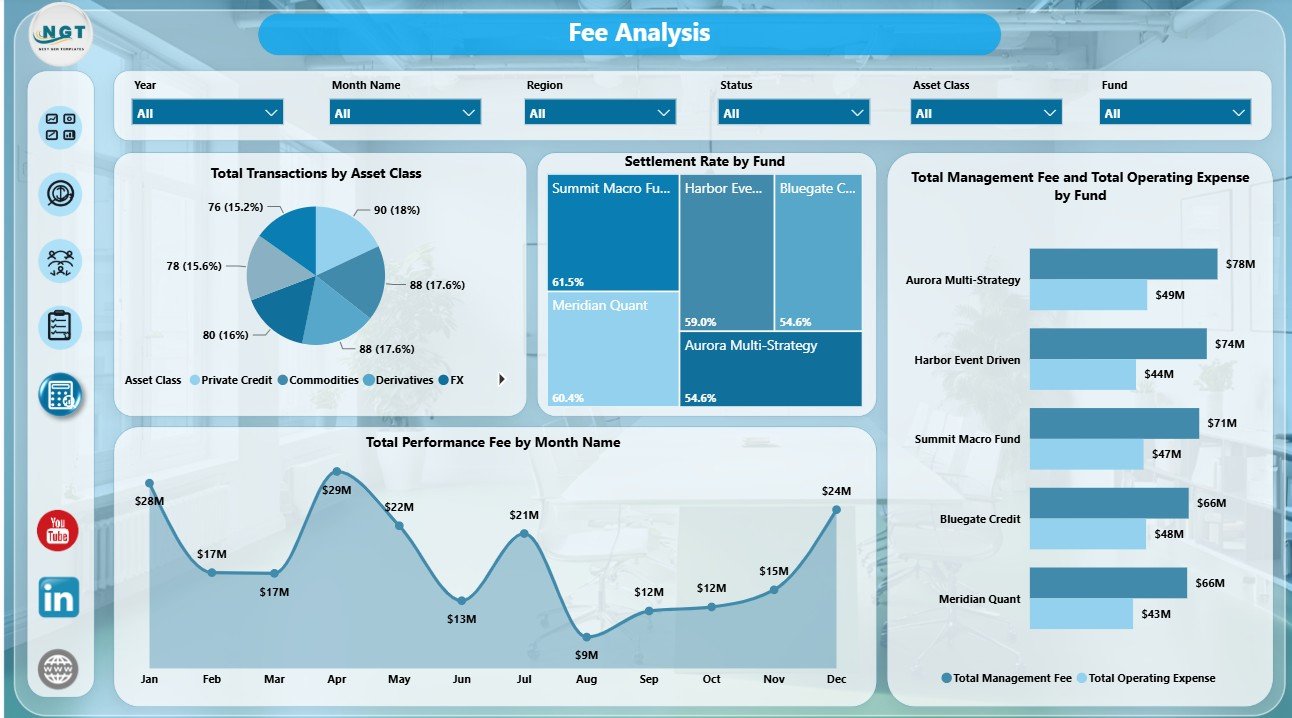
Fee Analysis
Hedge Fund Administration Dashboard in Power BI vs. Tableau vs. Paid Fund Admin SaaS – Feature Comparison
| Feature | This Power BI Dashboard | Tableau Alternative | Paid Fund Admin SaaS |
|---|---|---|---|
| Cost | $17.99 one-time template purchase | License plus report build time | Monthly or annual subscription |
| Platform | Power BI Desktop / Power BI Service | Tableau Desktop / Cloud | Vendor-hosted platform |
| Setup time | Open PBIX, connect or replace data, refresh | Build model and visuals manually | Vendor onboarding and configuration |
| Real-time team collaboration | Available after publishing to Power BI Service | Available through Tableau publishing | Usually included by seat or plan |
| Mobile access | Power BI mobile app after publishing | Tableau mobile app after publishing | Vendor app or mobile web |
| Customizable fields | Edit visuals, measures, labels, fields, and pages | Editable if you own the workbook | Limited by vendor configuration |
| Share with link | Available through Power BI Service permissions | Available through Tableau permissions | Usually login controlled |
| Year-1 cost at 5 users | $17.99 plus any Microsoft licensing | Software licensing plus development time | Often hundreds or thousands per year |
| Fund administration reporting | Built in across multiple report pages | Requires custom setup | Depends on vendor module |
Who Should Use This Template
This template is useful for hedge fund administrators, fund accounting teams, CFO and COO teams, investor relations analysts, operations managers, boutique fund consultants, and Power BI users who need structured reporting for fund transactions, operating expense, management fees, performance fees, settlement rate, NAV, subscriptions, redemptions, strategies, regions, funds, asset classes, and investor segments.
It is not designed to replace a full fund accounting system, live investor portal, order management platform, custodian reconciliation engine, or regulatory filing tool. It works best as an analytics layer after your fund administration data has already been collected and structured.
Real-World Use Cases
Ravi, fund administration manager: Ravi opens the Overview page before his weekly operations meeting to review transactions by status, settlement rate, redemptions, and operating expense by fund.
Meera, hedge fund CFO: Meera reviews Fee Analysis before month-end close to compare management fee, operating expense, performance fee, transaction volume, and settlement rate by fund.
Daniel, investor relations analyst: Daniel uses Fund Analysis and Investor Flow to explain subscription and redemption movement by month, quarter, strategy, and investor segment.
Advantages of Hedge Fund Administration Dashboard in Power BI
- Faster reporting: Prebuilt visuals reduce the time needed to prepare recurring hedge fund administration dashboards.
- Better operational visibility: Transaction status, settlement rate, and administrator exceptions help teams spot processing issues quickly.
- Clearer investor flow analysis: Subscriptions and redemptions can be reviewed by month, quarter, segment, and strategy.
- Power BI flexibility: Users can customize report pages, visuals, measures, and filters inside Power BI Desktop.
- One-time purchase: Teams avoid recurring dashboard software fees for a template-based reporting need.
Opportunities for Improvement
Advanced users can extend the report with additional DAX measures, drill-through pages, row-level security, extra fund attributes, Power Query connections, SQL databases, SharePoint files, or scheduled refresh through Power BI Service. Larger teams may also add pages for administrator SLA tracking, custodian breaks, portfolio accounting reconciliation, or investor-level reporting, depending on the data they maintain.
Best Practices
- Keep fund names, administrator names, investor segment names, strategy names, currencies, and asset classes consistent in the source data.
- Validate Total Transactions, Total Operating Expense, Total Redemptions, and Total Management Fee after every refresh.
- Review settlement rate and exception transactions together so volume does not hide process-quality problems.
- Use slicers during review meetings instead of creating multiple duplicate report pages.
- Document any new DAX measures or renamed fields so future users understand the report logic.
For official Microsoft guidance, see What is Power BI Desktop?.
Explore Relevant Templates
- Hedge Fund Administration Dashboard in Power BI
- Hedge Fund Administration Dashboard in Excel
- Hedge Funds KPI Dashboard in Power BI
- VC Portfolio Dashboard in Power BI
- Power BI Dashboard Templates
Frequently Asked Questions
What is the Hedge Fund Administration Dashboard in Power BI?
It is an editable PBIX dashboard template for hedge fund administration reporting, including transactions, operating expense, redemptions, management fee, settlement rate, NAV, performance fee, investor flows, funds, regions, strategies, and asset classes.
What KPI cards are shown on the Overview page?
The Overview page includes Total Transactions, Total Operating Expense, Total Redemptions, and Total Management Fee.
Do I need Power BI Desktop?
Yes. Power BI Desktop is needed to open, refresh, and customize the PBIX file. Power BI Service is optional for publishing and sharing.
Can I customize the report?
Yes. You can edit visuals, measures, slicers, labels, colors, fields, and report pages in Power BI Desktop.
Is this a full hedge fund administration system?
No. It is a reporting dashboard, not a live accounting, investor portal, custody reconciliation, or regulatory filing platform.
Is this a subscription?
No. It is a one-time template purchase from NextGenTemplates. Microsoft licensing is separate if you use Power BI Service for sharing.
About the Author
Built by PK – Microsoft Certified Professional with 15+ years of Excel, Google Sheets, and Power BI experience. Founder of NextGenTemplates, reaching 300K+ subscribers across YouTube channels. Every template is hand-built and tested before release.
Conclusion
The Hedge Fund Administration Dashboard in Power BI gives hedge fund administration and finance teams a clear way to review transactions, operating expense, redemptions, management fee, settlement rate, NAV, performance fee, subscriptions, redemptions, investor segments, strategies, administrators, funds, and asset classes. Instead of creating each report page manually, users get a ready PBIX structure they can refresh, customize, and adapt to their own fund administration data.
Visit our YouTube channel to learn step-by-step Excel, Power BI, and dashboard tutorials.