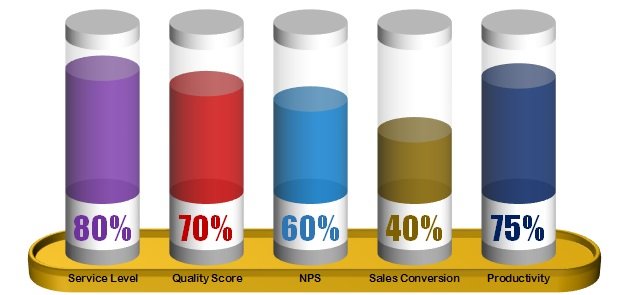
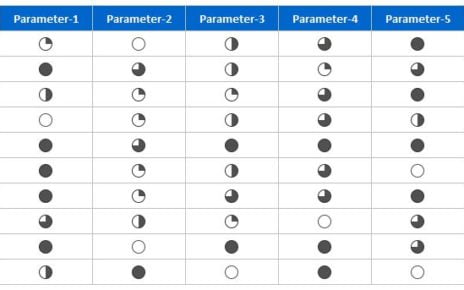
An Employee Rating Table in Excel can be a powerful template to visualize and track employee performance across various parameters.
In the article, you will learn 10 super tips in Microsoft Excel. You can improve you productivity in Excel using
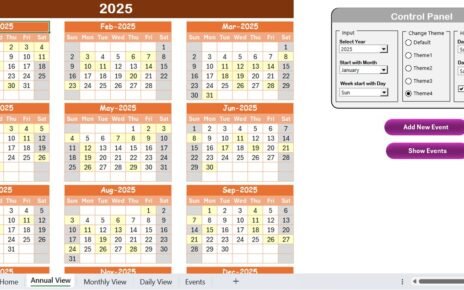
Perfect! Based on the topic "Marketing Supply Chain Resilience Calendar in Excel" and the detailed information you've provided, I’ll now