In the competitive world of accounting and financial management, firms need real-time visibility into performance, profitability, and productivity. The Accounting Firms KPI Dashboard in Excel offers a powerful, data-driven approach to measure, analyze, and optimize key business metrics — all within a familiar spreadsheet environment.
Whether you are a CPA, accounting manager, or financial analyst, this Excel-based KPI dashboard helps you track essential indicators like revenue growth, client acquisition cost, billing efficiency, and project utilization. It simplifies performance monitoring and empowers decision-makers to make informed, timely actions.
Click to Purchases Accounting Firms KPI Dashboard in Excel
What Is an Accounting Firms KPI Dashboard in Excel?
An Accounting Firms KPI Dashboard is a dynamic Excel template that helps accounting professionals visualize and analyze business performance across multiple key performance indicators (KPIs).
It consolidates complex financial and operational data into interactive charts, tables, and visuals, making it easier to interpret trends and spot improvement areas.
Unlike complicated software or BI platforms, this Excel dashboard is simple, customizable, and ready to use. It provides a complete view of metrics like revenue, expense ratio, client retention, employee utilization, and profitability in one interactive file.
Click to Purchases Accounting Firms KPI Dashboard in Excel
Key Features of the Accounting Firms KPI Dashboard
This KPI dashboard consists of seven well-structured worksheets, each serving a distinct purpose for accurate tracking and easy navigation.
1. Home Sheet

The Home sheet acts as the control center or index page of the dashboard. It includes six interactive buttons that allow you to jump directly to specific worksheet tabs.
This user-friendly layout ensures smooth navigation across different sections such as Dashboard, KPI Trend, Actual Data Input, Targets, and more — helping even non-technical users easily explore and operate the tool.
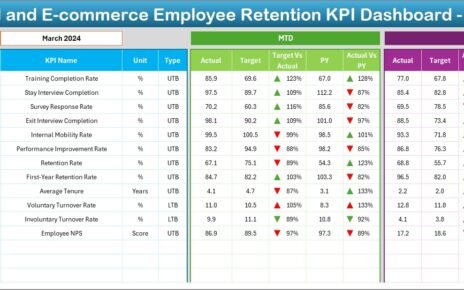
2. Dashboard Sheet Tab

This is the main page of the template and the heart of the system.
From this page, users can view:
-
Monthly performance data (MTD) and Year-to-Date (YTD) values.
-
Actual, Target, and Previous Year (PY) performance.
-
Visual indicators with conditional formatting arrows showing whether performance improved or declined.
-
A drop-down menu in cell D3, allowing users to select any month and instantly refresh dashboard data for that period.
For example, if you select “June 2024,” all metrics automatically update to show June’s MTD and YTD results with clear comparisons against targets and previous year numbers.
This visual clarity helps accounting teams understand which KPIs are exceeding targets and which ones need attention.
3. KPI Trend Sheet Tab

The KPI Trend sheet offers a deeper insight into each performance indicator.
Users can:
-
Select a specific KPI name from a drop-down list (cell C3).
-
View key details like KPI Group, Unit, Type (LTB or UTB), Formula, and Definition.
-
Analyze MTD and YTD trend charts for Actual, Target, and Previous Year.
This sheet provides visual tracking of KPI progress month-over-month and helps identify seasonal patterns or recurring issues in accounting operations.
4. Actual Numbers Input Sheet

The Actual Numbers Input sheet is where you record the real data collected from your operations.
In this tab:
-
Input both MTD (Month-To-Date) and YTD (Year-To-Date) numbers for each KPI.
-
Use cell E1 to specify the first month of the fiscal year (e.g., January or April).
-
The dashboard will automatically align the rest of the months accordingly.
This structured data entry ensures consistency and accuracy across reports.
5. Target Sheet Tab

The Target Sheet is used to set performance benchmarks for every KPI across all months.
Users can:
-
Enter monthly and YTD Target values.
-
Adjust targets easily to reflect updated business goals or new strategic plans.
Having clear targets side by side with actual numbers empowers firms to measure progress effectively and ensure teams stay aligned with overall business objectives.
6. Previous Year Number Sheet Tab

To evaluate performance growth and historical trends, the Previous Year Number Sheet allows you to input last year’s metrics in the same format as the current year.
This data enables comparative analysis — so you can see how your firm performed in 2023 vs. 2024 across revenue, client metrics, billing efficiency, and more.
7. KPI Definition Sheet Tab

The KPI Definition Sheet is the foundation of this dashboard.
Here you can maintain:
-
KPI Names
-
KPI Groups
-
Units of Measurement
-
Formula used for calculation
-
Short Definitions
This ensures clarity and uniformity in how each KPI is interpreted, calculated, and reported across departments.
Click to Purchases Accounting Firms KPI Dashboard in Excel
Why Do Accounting Firms Need KPI Dashboards?
Accounting firms operate in a data-intensive environment where accuracy, speed, and transparency are critical. KPIs help measure operational efficiency and client satisfaction while ensuring strategic alignment with organizational goals.
The Accounting Firms KPI Dashboard in Excel acts as a performance command center — enabling leadership teams to make informed decisions quickly and confidently.
Here are some major reasons why KPI dashboards are indispensable:
✅ Simplify complex data visualization
✅ Track monthly and yearly performance in one view
✅ Identify underperforming areas instantly
✅ Promote accountability within departments
✅ Improve financial forecasting accuracy
Key KPIs for Accounting Firms
Every accounting firm has its unique metrics depending on service type and client base, but the following KPIs are commonly tracked:
-
Revenue Growth Rate – Measures how fast your firm’s revenue is increasing.
-
Client Retention Rate – Tracks how many clients stay with you year after year.
-
Billable Utilization (%) – Shows the proportion of total available hours billed to clients.
-
Accounts Receivable Turnover – Indicates how efficiently invoices are collected.
-
Net Profit Margin – Reveals profitability after all expenses.
-
Client Acquisition Cost (CAC) – Tracks marketing and sales spend per new client gained.
-
Project Completion Rate – Measures delivery efficiency and timeliness.
-
Expense Ratio – Highlights cost management effectiveness.
-
Average Billing Rate – Shows average hourly earnings across projects.
-
Revenue per Employee – Evaluates staff productivity and contribution to firm revenue.
These KPIs form the basis of strategic decision-making in accounting operations.
How the Dashboard Works
The Accounting Firms KPI Dashboard in Excel combines automation with interactivity.
-
Data Entry:
You input Actual, Target, and Previous Year numbers in the designated sheets. -
Automatic Calculations:
Excel formulas compute variance, growth, and performance ratios automatically. -
Dynamic Visualization:
The dashboard sheet updates instantly when you select a month or KPI. -
Trend Analysis:
The KPI Trend page uses line and column charts to show MTD and YTD movement.
This integration transforms static data into meaningful insights without requiring coding or advanced BI tools.
Advantages of Accounting Firms KPI Dashboard in Excel
Using this Excel-based KPI dashboard provides numerous benefits for accounting firms of all sizes.
Here are the main advantages explained:
💡 1. Centralized Performance Monitoring
The dashboard consolidates all business metrics — financial, operational, and client-based — into one unified file, removing the need for multiple reports.
📊 2. Real-Time Data Visibility
You can view MTD and YTD data instantly, making it easier to track monthly goals, client progress, and billing efficiency.
⚙️ 3. Easy Customization
The dashboard allows adding or editing KPIs, updating targets, or changing visual formats without any technical expertise.
📈 4. Improved Decision-Making
By analyzing data visually, firms can make data-backed decisions faster — improving strategy, pricing, and client relationships.
🧩 5. Low-Cost Implementation
Built entirely in Microsoft Excel, this tool eliminates the need for expensive BI platforms or complex data systems.
👥 6. Team Accountability
By assigning KPIs to responsible persons, you can improve ownership and performance transparency across the firm.
Click to Purchases Accounting Firms KPI Dashboard in Excel
How to Use the Accounting Firms KPI Dashboard Effectively
Follow these steps to get the best results from the template:
-
Set Up KPI Definitions:
Clearly define each KPI in the definition sheet with formula and unit. -
Input Previous Year Data:
Enter last year’s actual data for accurate comparisons. -
Add Target Values:
Set realistic monthly and annual targets for every KPI. -
Enter Current Data:
Update actual MTD and YTD data regularly to monitor progress. -
Review Dashboard Charts:
Analyze MTD vs Target and PY vs Target trends visually. -
Adjust Strategies:
Identify areas lagging behind and take corrective actions quickly.
Best Practices for Using the Accounting Firms KPI Dashboard
To maximize efficiency and accuracy, follow these best practices:
✅ Keep Data Updated
Regularly update actual and target values to ensure dashboard accuracy. Delayed data entry leads to outdated insights.
✅ Review Monthly
Hold monthly review meetings using the dashboard to discuss performance and address gaps early.
✅ Define Ownership
Assign responsibility for each KPI to a specific person to promote accountability.
✅ Use Conditional Formatting
Leverage the dashboard’s color-coded indicators (green for improvement, red for decline) for quick visual evaluation.
✅ Validate Formulas
Periodically verify KPI formulas to ensure they match your firm’s specific reporting logic.
✅ Compare Yearly Trends
Use YTD comparisons to understand long-term growth and seasonal trends.
Conclusion
The Accounting Firms KPI Dashboard in Excel is more than just a spreadsheet — it’s a strategic control panel that transforms raw data into actionable insights.
With automated calculations, interactive visuals, and customizable metrics, it helps accounting professionals monitor profitability, client engagement, and operational performance effortlessly.
By implementing this dashboard, your accounting firm can streamline reporting, improve accuracy, and enhance strategic decision-making — all while saving time and costs.
Click to Purchases Accounting Firms KPI Dashboard in Excel
Frequently Asked Questions (FAQs)
1. What is a KPI Dashboard for Accounting Firms?
It’s a structured Excel tool that tracks and visualizes key performance indicators (KPIs) related to financial and operational metrics in accounting firms.
2. How can this dashboard improve firm performance?
It helps you measure efficiency, track targets, and identify performance gaps quickly, allowing managers to take corrective actions.
3. Is Excel suitable for KPI tracking?
Yes. Excel is a flexible and cost-effective tool that allows automation, data visualization, and customization without coding.
4. Can I customize KPIs in this dashboard?
Absolutely. You can add new KPIs, adjust formulas, and modify charts to suit your firm’s reporting needs.
5. Does the dashboard require advanced Excel skills?
No. It’s fully prebuilt and ready to use. Anyone familiar with basic Excel operations can manage it easily.
6. How often should I update the data?
Ideally, you should update the MTD and YTD data every month to keep insights accurate and actionable.
7. Can this dashboard be shared across teams?
Yes. Since it’s built in Excel, you can share it via cloud drives like OneDrive or SharePoint for collaboration.
8. Is the dashboard suitable for small accounting firms?
Yes. It’s scalable, making it perfect for both small and large accounting firms.
Click to Purchases Accounting Firms KPI Dashboard in Excel
Visit our YouTube channel to learn step-by-step video tutorials