The global adhesives and sealants industry plays a crucial role in modern manufacturing. Industries such as construction, automotive, packaging, electronics, aerospace, and consumer goods rely heavily on adhesives and sealants to assemble products, improve durability, and ensure structural strength.
However, managing production, tracking raw material costs, monitoring plant performance, and analyzing profitability can quickly become complicated. Many companies still rely on scattered spreadsheets or manual reports. As a result, decision-makers struggle to understand operational performance and identify improvement opportunities.
Therefore, organizations need a powerful analytical system that transforms complex manufacturing data into clear insights. This is exactly where the Adhesives and Sealants Dashboard in Power BI becomes extremely valuable.
The Adhesives and Sealants Dashboard in Power BI provides an interactive and data-driven solution that allows companies to monitor revenue, production costs, profit margins, plant performance, regional sales trends, and product category performance in one centralized platform.
Moreover, Power BI enables businesses to analyze large datasets quickly using interactive visualizations, slicers, and real-time filtering. Consequently, managers can identify trends, optimize production processes, and improve profitability.
In this comprehensive guide, we will explore everything about the Adhesives and Sealants Dashboard in Power BI, including its features, benefits, dashboard structure, and best practices.
Click to buy Adhesives and Sealants Dashboard in Power BI
What is an Adhesives and Sealants Dashboard in Power BI?
An Adhesives and Sealants Dashboard in Power BI is a data visualization and analytics tool designed to monitor the operational and financial performance of adhesives and sealants manufacturing businesses.
Instead of analyzing multiple spreadsheets or disconnected reports, companies can use this dashboard to view all key metrics in one place.
The dashboard helps organizations monitor:
- Revenue performance
- Production costs
- Raw material expenses
- Profit margins
- Plant location performance
- Regional sales trends
- Product category performance
- Monthly profitability
As a result, business leaders gain a complete overview of manufacturing and financial performance.
Furthermore, interactive charts and slicers allow users to filter the data by plant location, region, product category, or time period. Therefore, companies can quickly identify trends and make better business decisions.
Why Do Adhesives and Sealants Companies Need a Dashboard?
Manufacturing adhesives and sealants involves multiple complex processes. Companies must manage production facilities, raw material procurement, distribution networks, and sales operations.
However, without a proper monitoring system, companies often face several challenges.
Common Challenges in the Industry
- Difficulty tracking production costs
- Lack of visibility into plant performance
- Complex raw material pricing
- Limited understanding of profit margins
- Inefficient regional performance monitoring
- Difficulty identifying high-performing product categories
Therefore, companies require a centralized analytics solution.
The Power BI dashboard solves these problems by converting raw operational data into meaningful insights.
Consequently, organizations can make faster and smarter decisions.
Key Features of the Adhesives and Sealants Dashboard in Power BI
The Adhesives and Sealants Dashboard in Power BI includes five interactive pages, each designed to provide specific business insights.
These pages allow managers to analyze performance from different perspectives.
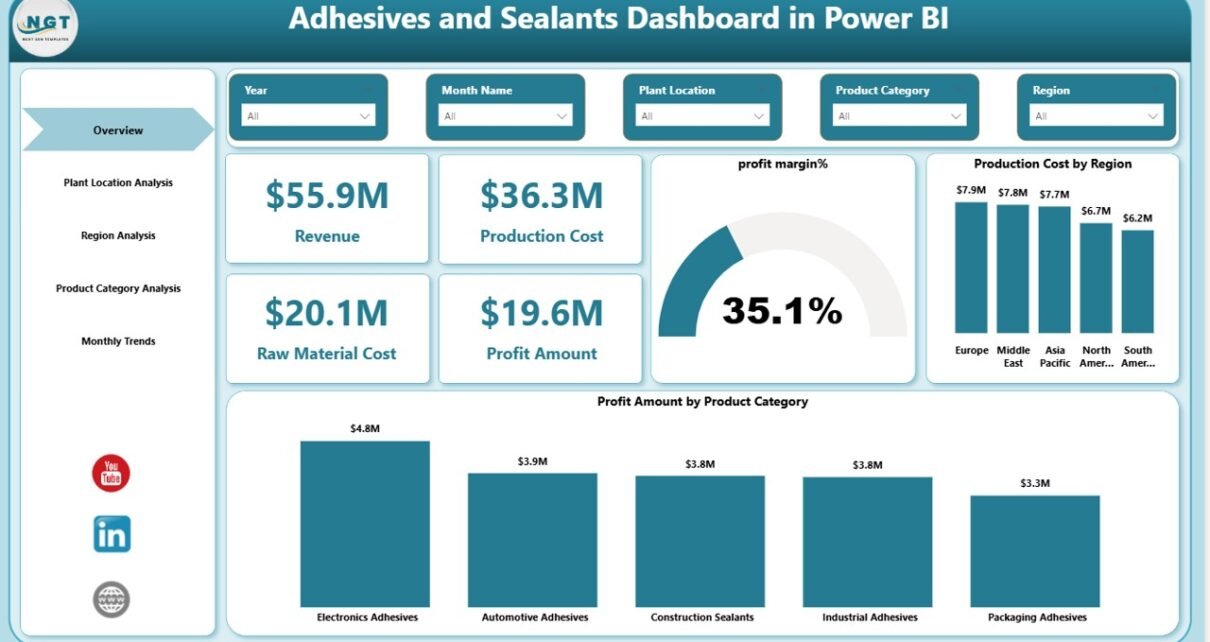
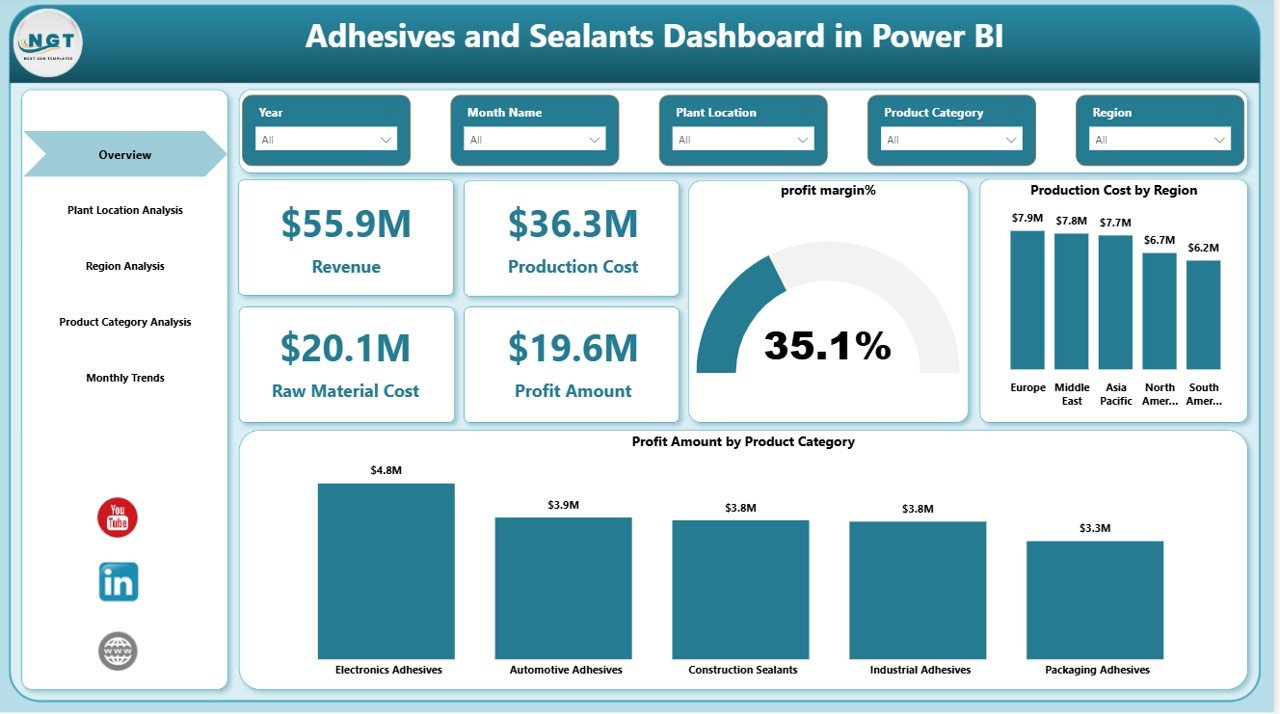
Overview Page – Get a Complete Business Snapshot
The Overview Page serves as the main dashboard and provides a quick summary of overall performance.
This page includes interactive slicers that allow users to filter data by different dimensions.
Key KPI Cards
The dashboard displays important performance indicators such as:
- Revenue
- Production Cost
- Raw Material Cost
- Profit Amount
- Profit Margin Percentage
These KPIs help managers instantly understand business performance.
Charts Available on the Overview Page
The page also includes several analytical charts:
- Profit Margin %
- Production Cost by Region
- Profit Amount by Product Category
As a result, users quickly understand profitability trends and cost distribution.
Click to buy Adhesives and Sealants Dashboard in Power BI
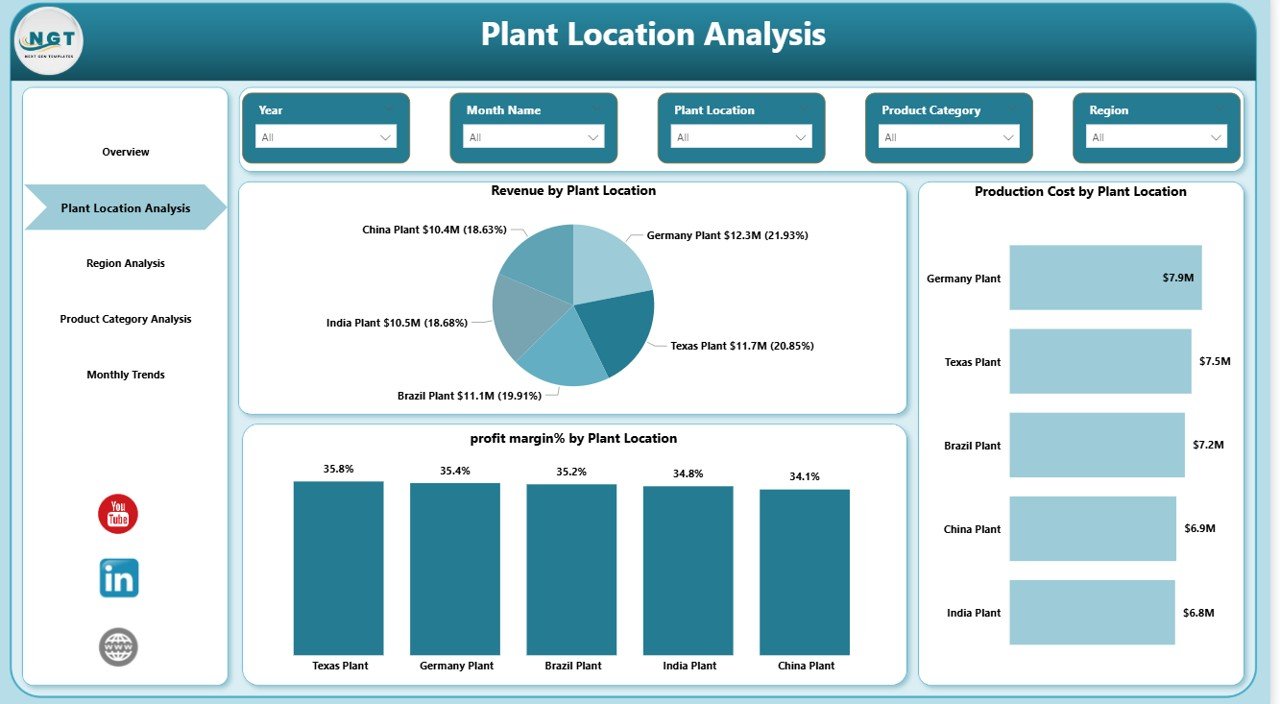
Plant Location Analysis – Evaluate Manufacturing Performance
Manufacturing companies often operate multiple production plants. Therefore, monitoring plant-level performance becomes essential.
The Plant Location Analysis Page helps managers evaluate production efficiency and financial performance for each plant.
Charts Included in this Page
- Revenue by Plant Location
- Production Cost by Plant Location
- Profit Margin % by Plant Location
These charts allow companies to compare plant performance and identify operational inefficiencies.
For example:
- One plant may generate higher revenue but also incur higher production costs.
- Another plant may operate more efficiently and generate better profit margins.
Therefore, companies can optimize operations accordingly.
Click to buy Adhesives and Sealants Dashboard in Power BI
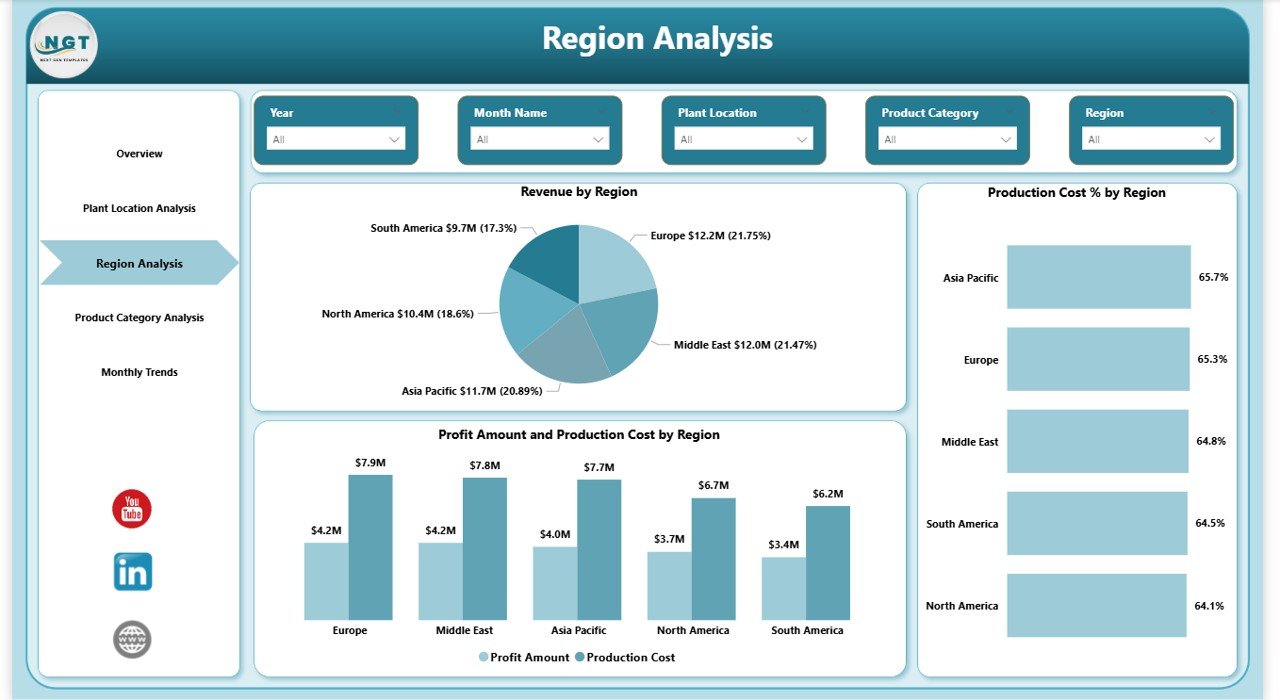
Region Analysis – Understand Market Performance
Companies often sell adhesives and sealants across multiple regions or countries.
Therefore, analyzing regional performance becomes extremely important.
The Region Analysis Page helps businesses monitor regional revenue, production costs, and profitability.
Charts Available in Region Analysis
- Revenue by Region
- Production Cost % by Region
- Profit Amount and Production Cost by Region
These insights allow companies to identify strong and weak markets.
For example:
- One region may generate strong revenue but show low profit margins.
- Another region may deliver high profitability despite lower sales volumes.
Therefore, businesses can adjust their pricing and distribution strategies.
Click to buy Adhesives and Sealants Dashboard in Power BI
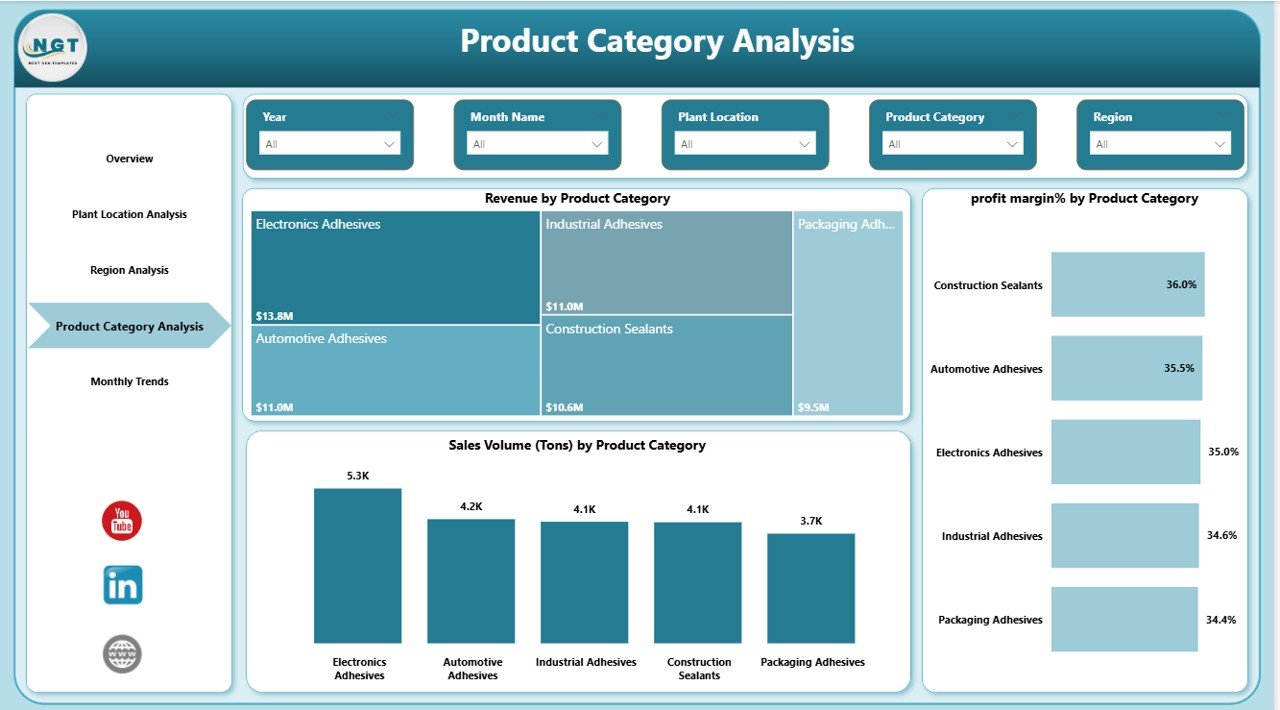
Product Category Analysis – Identify High Performing Products
Adhesives and sealants companies often produce multiple product categories such as:
- Industrial adhesives
- Construction sealants
- Automotive bonding materials
- Packaging adhesives
- Electronics adhesives
Each category performs differently in terms of sales and profitability.
The Product Category Analysis Page helps managers analyze these product-level insights.
Charts Available
- Revenue by Product Category
- Profit Margin % by Product Category
- Sales Volume (Tons) by Product Category
These insights help businesses understand which product categories generate the highest revenue and profits.
Consequently, companies can focus on high-performing products and optimize their product portfolio.
Click to buy Adhesives and Sealants Dashboard in Power BI
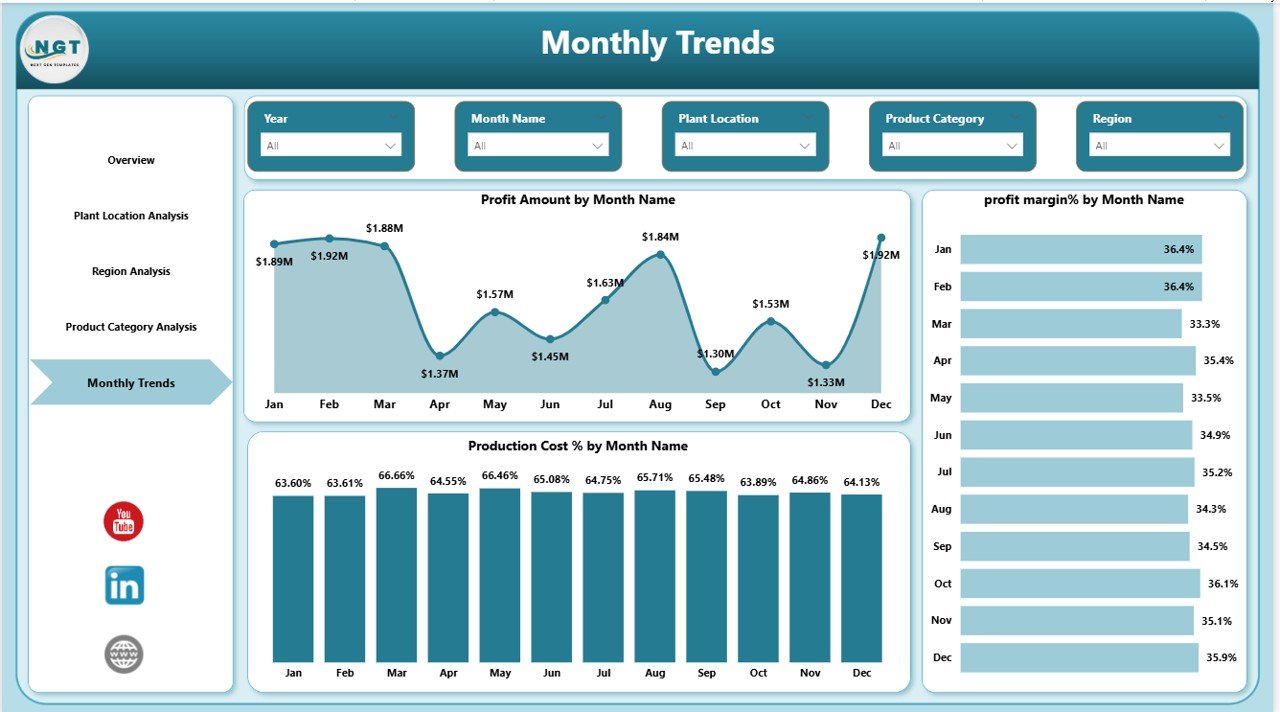
Month Analysis – Monitor Monthly Performance Trends
Businesses must continuously track monthly performance to identify trends and seasonal patterns.
The Month Analysis Page provides detailed insights into monthly profitability and cost structures.
Charts Included
- Profit Amount by Month
- Profit Margin % by Month
- Production Cost % by Month
These charts allow companies to track financial performance over time.
For example:
- A company may notice increasing production costs in certain months.
- Profit margins may fluctuate due to raw material price changes.
Therefore, management teams can take corrective actions quickly.
Click to buy Adhesives and Sealants Dashboard in Power BI
Advantages of Adhesives and Sealants Dashboard in Power BI
Organizations gain several benefits when they implement a Power BI dashboard for manufacturing analytics.
- Centralized Data Monitoring
The dashboard consolidates multiple data sources into a single visual platform.
Therefore, managers can view all performance metrics in one place.
- Real-Time Business Insights
Power BI allows companies to analyze data in real time.
As a result, organizations can respond quickly to operational changes.
- Improved Decision Making
Clear visual reports help managers understand trends easily.
Consequently, they make faster and more accurate decisions.
- Enhanced Production Planning
Companies can analyze plant performance and production costs.
Therefore, they can optimize production planning and reduce waste.
- Better Profitability Tracking
The dashboard tracks profit margins across plants, regions, and product categories.
As a result, businesses can identify profitable segments.
Opportunities for Improvement in Adhesives and Sealants Analytics
Even though dashboards provide strong insights, companies can improve analytics further.
Integration with ERP Systems
Companies should connect the dashboard with ERP systems such as SAP or Oracle.
As a result, they can automate data updates.
Advanced Forecasting
Businesses can implement predictive analytics to forecast:
- Production demand
- Raw material price changes
- Revenue trends
Supply Chain Monitoring
Organizations can add supply chain metrics such as:
- Supplier performance
- Raw material availability
- Inventory levels
Quality Control Tracking
Companies can integrate quality control metrics including:
- Defect rates
- Customer complaints
- Product return rates
Best Practices for the Adhesives and Sealants Dashboard
Companies should follow certain best practices to maximize the value of this dashboard.
- Maintain Clean and Accurate Data
Data quality directly impacts dashboard accuracy.
Therefore, companies must ensure consistent data entry.
- Use Standard KPIs
Organizations should define clear KPIs such as:
- Revenue
- Production cost
- Profit margin
- Sales volume
These KPIs allow consistent performance monitoring.
- Update Data Regularly
Companies should update the dashboard regularly.
Consequently, decision-makers receive the latest insights.
- Train Business Users
Employees must understand how to use slicers and filters.
Therefore, organizations should provide basic training.
- Customize the Dashboard
Every company has different requirements.
Therefore, organizations should customize the dashboard according to their needs.
Who Can Benefit from the Adhesives and Sealants Dashboard?
Many professionals across the manufacturing industry can benefit from this dashboard.
Manufacturing Managers
They monitor production efficiency and plant performance.
Finance Teams
They analyze costs, revenue, and profit margins.
Operations Managers
They track operational performance across plants.
Sales Managers
They evaluate regional sales performance and product demand.
Business Analysts
They analyze trends and identify strategic opportunities.
Future of Data Analytics in Adhesives and Sealants Industry
The manufacturing sector continues to evolve rapidly. As a result, companies increasingly rely on data analytics and digital dashboards.
Several technologies will shape the future of manufacturing analytics.
Artificial Intelligence
AI will help companies predict production demand and optimize operations.
IoT Sensors
Manufacturers will collect real-time machine data using IoT devices.
Predictive Maintenance
Advanced analytics will help companies detect equipment failures early.
Smart Manufacturing
Companies will integrate dashboards with automated production systems.
Consequently, organizations will achieve higher efficiency and profitability.
Conclusion
The Adhesives and Sealants Dashboard in Power BI provides a powerful solution for monitoring manufacturing and financial performance.
Instead of relying on disconnected reports, companies can analyze revenue, production costs, plant performance, and profitability using one interactive platform.
Moreover, the dashboard helps organizations identify trends, optimize production, and improve strategic decision-making.
As the adhesives and sealants industry becomes increasingly competitive, companies must adopt modern analytics tools.
Therefore, implementing a Power BI dashboard enables businesses to improve efficiency, reduce costs, and achieve sustainable growth.
Frequently Asked Questions (FAQs)
What is an Adhesives and Sealants Dashboard?
An Adhesives and Sealants Dashboard is a data visualization tool that helps companies monitor manufacturing performance, production costs, revenue trends, and profit margins.
Why should companies use Power BI for manufacturing dashboards?
Power BI provides interactive visualizations, real-time analytics, and easy data integration. Therefore, companies can analyze complex manufacturing data efficiently.
What KPIs are included in the Adhesives and Sealants Dashboard?
Common KPIs include:
- Revenue
- Production Cost
- Raw Material Cost
- Profit Amount
- Profit Margin %
Can companies customize this dashboard?
Yes. Companies can customize the dashboard based on their business requirements, data sources, and performance metrics.
Who should use this dashboard?
Manufacturing managers, finance teams, operations managers, sales teams, and business analysts can use this dashboard to monitor performance and improve decision-making.
Visit our YouTube channel to learn step-by-step video tutorials
Watch the step-by-step video tutorial:
Click to buy Adhesives and Sealants Dashboard in Power BI