Adventure tourism continues to grow rapidly. Travelers now seek thrilling experiences like trekking, rafting, scuba diving, desert safaris, and mountain biking. However, running an adventure tourism business requires strong planning, safety control, revenue tracking, and performance monitoring.
Therefore, tour operators must track bookings, safety records, equipment usage, revenue, and customer satisfaction carefully. Many businesses still depend on scattered spreadsheets. As a result, they miss trends, lose revenue opportunities, and fail to identify operational gaps.
That is exactly why the Adventure Tourism KPI Dashboard in Excel becomes a powerful solution.
This ready-to-use Excel dashboard helps adventure tourism companies monitor key performance indicators in a structured and dynamic way. Moreover, it allows managers to track Month-to-Date (MTD), Year-to-Date (YTD), Target vs Actual, and Previous Year comparisons instantly.
In this detailed guide, you will learn:
-
What an Adventure Tourism KPI Dashboard in Excel is
-
Why adventure tourism businesses need it
-
Dashboard structure and worksheet details
-
Key KPIs you should track
-
Advantages of using this dashboard
-
Best practices for implementation
-
Frequently Asked Questions
Let’s explore everything step by step.
Click to Purchases Adventure Tourism KPI Dashboard in Excel
What Is an Adventure Tourism KPI Dashboard in Excel?
An Adventure Tourism KPI Dashboard in Excel is a structured performance tracking system designed to monitor and analyze key business indicators related to adventure travel services.
Instead of reviewing multiple Excel sheets, you can:
-
Track revenue performance
-
Monitor booking trends
-
Analyze customer satisfaction
-
Control safety metrics
-
Compare targets with actual performance
-
Review year-over-year growth
Because the dashboard uses Excel features like drop-down lists, conditional formatting, pivot tables, and charts, it updates automatically when you select a month.
As a result, managers gain instant visibility into business performance.
Why Do Adventure Tourism Businesses Need a KPI Dashboard?
Adventure tourism involves high operational risk and fluctuating demand. Therefore, operators must monitor numbers regularly.
Without structured tracking:
-
Revenue leaks go unnoticed
-
Safety incidents increase
-
Equipment utilization drops
-
Customer complaints rise
-
Seasonal trends remain unclear
However, when you use a KPI dashboard:
-
You make faster decisions
-
You identify performance gaps quickly
-
You improve operational efficiency
-
You increase profitability
Moreover, Excel remains widely accessible. Therefore, teams can use the dashboard without investing in expensive software.
Click to Purchases Adventure Tourism KPI Dashboard in Excel
Key Features of Adventure Tourism KPI Dashboard in Excel
This ready-to-use template includes 7 structured worksheets. Each sheet serves a specific purpose.
Let’s understand each one clearly.
1️⃣ Home Sheet – Navigation Center

The Home sheet acts as an index page.
It includes:
-
6 navigation buttons
-
Quick access to all major sheets
-
Clean layout for user-friendly experience
Because of this structure, users can switch between sheets easily.
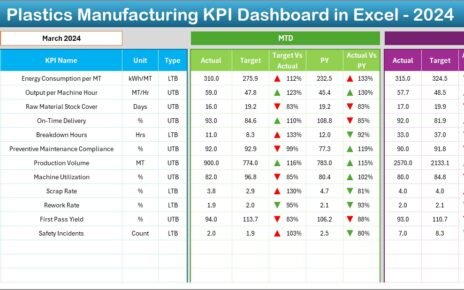
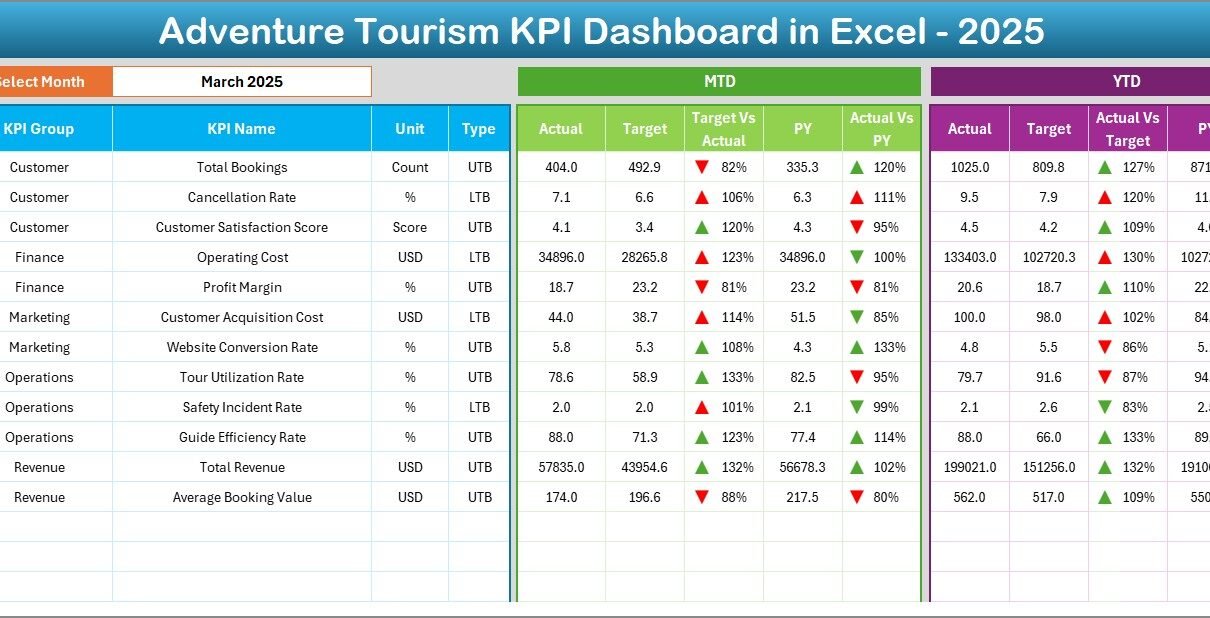
2️⃣ Dashboard Sheet – Main Performance Overview

This sheet acts as the heart of the dashboard.
Month Selection
-
On Range D3, you can select the month from a drop-down list.
-
Once you change the month, the entire dashboard updates automatically.
Performance Metrics Displayed
The dashboard shows:
-
MTD Actual
-
MTD Target
-
Previous Year MTD
-
Target vs Actual comparison
-
Previous Year vs Actual comparison
-
YTD Actual
-
YTD Target
-
YTD Previous Year
Conditional Formatting
-
Up arrows for positive growth
-
Down arrows for decline
-
Color coding for quick visual interpretation
Because of these visual indicators, managers understand performance instantly.
Click to Purchases Adventure Tourism KPI Dashboard in Excel
3️⃣ KPI Trend Sheet – Detailed KPI Analysis
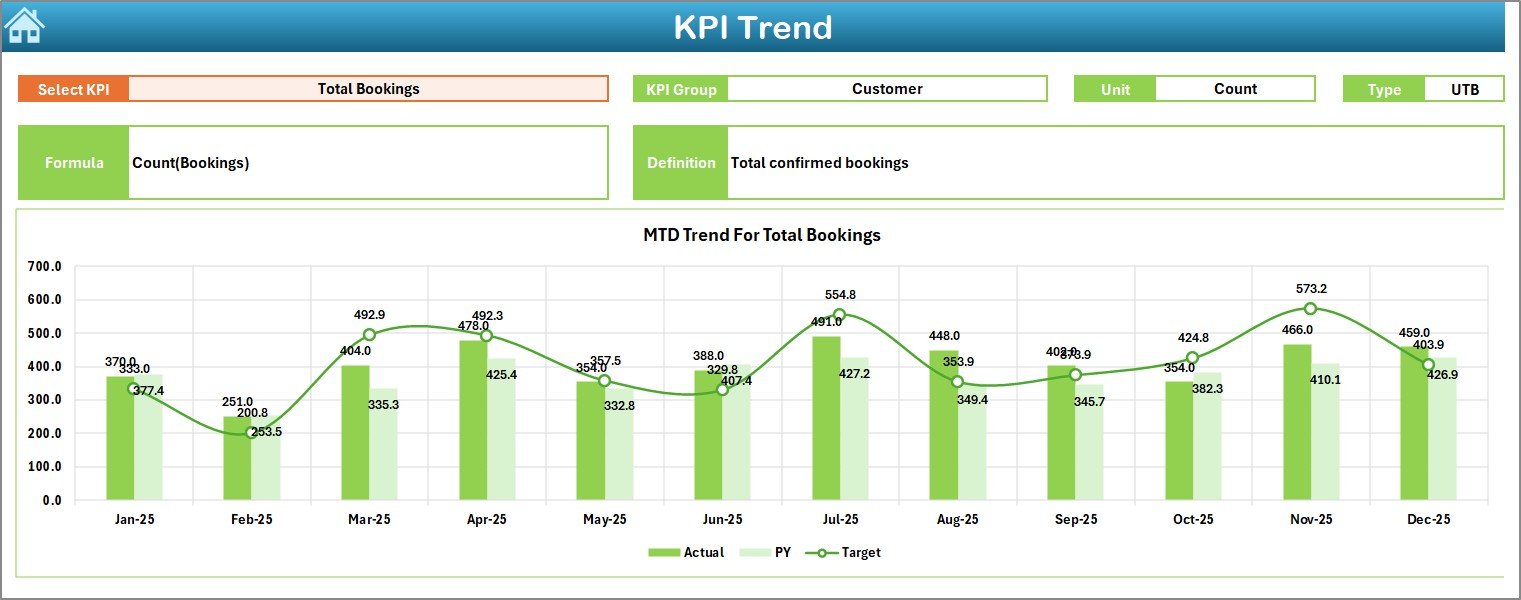
The KPI Trend sheet helps analyze individual KPIs in depth.
Selection Area
-
On Range C3, you select a KPI name from the drop-down.
Once selected, the sheet displays:
-
KPI Group
-
Unit of measurement
-
Type (LTB – Lower the Better / UTB – Upper the Better)
-
Formula
-
Definition
Trend Charts
The sheet includes:
-
MTD trend chart
-
YTD trend chart
-
Comparison of Actual, Target, and Previous Year
Therefore, managers can study trends over time instead of looking at single-month numbers.
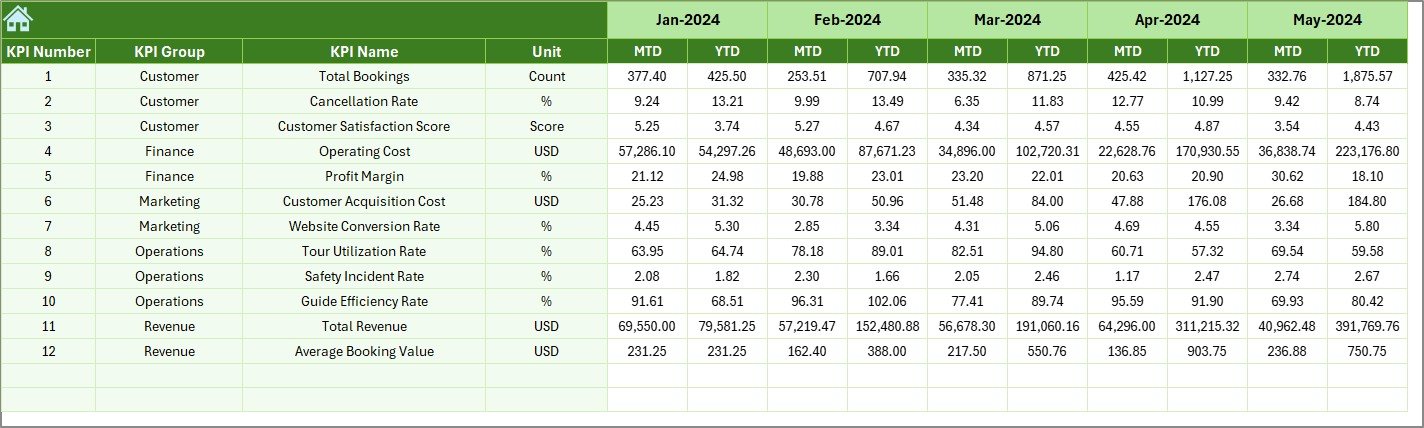
4️⃣ Actual Numbers Input Sheet

This sheet captures current year data.
How It Works:
-
Enter the first month of the year in Range E1
-
Input MTD and YTD actual values
-
Update data monthly
Because this sheet centralizes data entry, it reduces confusion.
5️⃣ Target Sheet

In this sheet:
-
Enter MTD targets
-
Enter YTD targets
-
Define monthly performance goals
Since targets directly influence performance comparison, this sheet plays a crucial role.
Click to Purchases Adventure Tourism KPI Dashboard in Excel
6️⃣ Previous Year Numbers Sheet
Here, you enter historical data.
This allows you to:
-
Compare year-over-year growth
-
Identify seasonal trends
-
Measure business improvement
Therefore, the dashboard supports long-term performance evaluation.
7️⃣ KPI Definition Sheet
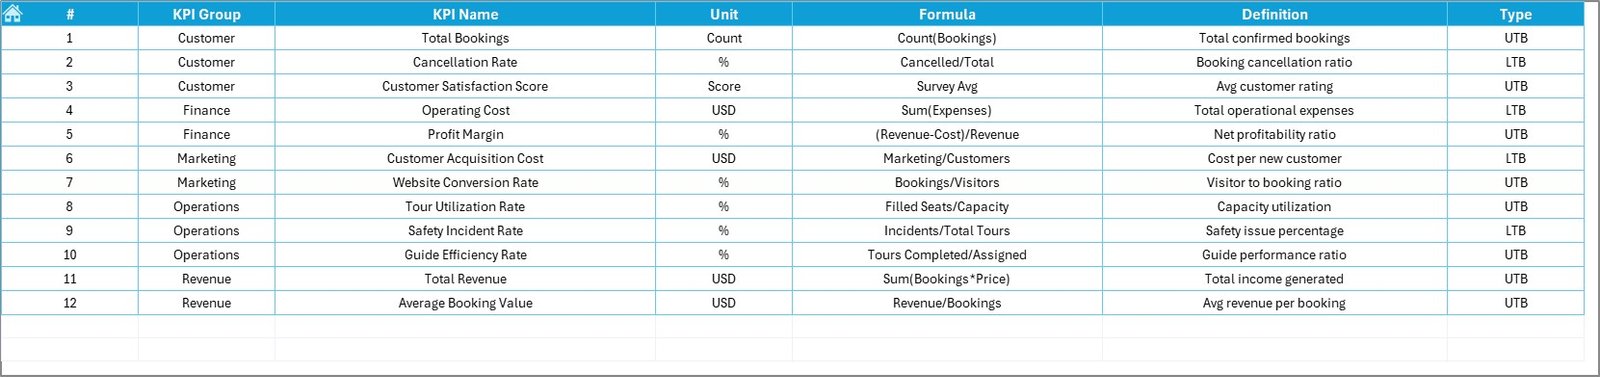
This sheet stores KPI details:
-
KPI Name
-
KPI Group
-
Unit
-
Formula
-
Definition
Because of this structured approach, users understand each KPI clearly.
What KPIs Should You Track in Adventure Tourism?
To run a successful adventure tourism business, you should monitor both financial and operational KPIs.
Here are some essential ones:
Financial KPIs
-
Total Revenue
-
Average Revenue per Booking
-
Profit Margin
-
Equipment Maintenance Cost
-
Marketing Cost per Booking
Operational KPIs
-
Number of Tours Conducted
-
Guide Utilization Rate
-
Equipment Utilization Rate
-
Cancellation Rate
-
Booking Conversion Rate
Safety KPIs
-
Incident Rate
-
Safety Training Completion Rate
-
Insurance Compliance Rate
Customer KPIs
-
Customer Satisfaction Score
-
Repeat Booking Rate
-
Online Rating Score
Because adventure tourism involves risk, safety KPIs play a major role.
Click to Purchases Adventure Tourism KPI Dashboard in Excel
How Does the Dashboard Improve Decision Making?
When you use the Adventure Tourism KPI Dashboard in Excel:
-
You track trends instantly
-
You detect performance gaps quickly
-
You align operations with targets
-
You forecast seasonal demand
-
You reduce operational risks
For example:
If cancellation rate increases in monsoon months, you can introduce flexible packages.
If guide utilization drops, you can adjust tour schedules.
If safety incidents rise, you can schedule additional training.
Therefore, the dashboard supports proactive management.
Advantages of Adventure Tourism KPI Dashboard in Excel
Let us now discuss the major advantages.
1️⃣ Easy to Use
Excel remains familiar to most users. Therefore, teams require minimal training.
2️⃣ Cost Effective
Unlike expensive software, Excel reduces implementation cost.
3️⃣ Real-Time Monitoring
Because the dashboard updates automatically, you see performance instantly.
4️⃣ Customizable Structure
You can add or modify KPIs easily.
5️⃣ Data-Driven Decisions
Managers rely on numbers instead of assumptions.
6️⃣ Improved Safety Tracking
You monitor safety metrics regularly.
7️⃣ Performance Transparency
Teams understand goals clearly.
As a result, accountability improves.
Click to Purchases Adventure Tourism KPI Dashboard in Excel
Best Practices for the Adventure Tourism KPI Dashboard in Excel
To maximize dashboard benefits, follow these best practices.
✔ Update Data Regularly
Enter data monthly without delay.
✔ Keep KPI Definitions Clear
Write short and clear definitions.
✔ Set Realistic Targets
Avoid unrealistic expectations.
✔ Monitor Safety Metrics Weekly
Since safety plays a critical role, review it frequently.
✔ Review Trends, Not Just Single Months
Focus on patterns over time.
✔ Train Team Members
Explain dashboard structure clearly.
✔ Backup Data Regularly
Always store copies of Excel files securely.
Because consistency drives results, disciplined usage matters.
How to Implement the Adventure Tourism KPI Dashboard Successfully?
Follow these steps:
-
Define your KPIs
-
Enter KPI definitions
-
Input previous year data
-
Set monthly targets
-
Enter actual numbers monthly
-
Review dashboard at monthly meetings
Moreover, involve department heads. When teams participate, adoption increases.
Click to Purchases Adventure Tourism KPI Dashboard in Excel
Common Challenges and How to Overcome Them
Even though Excel remains powerful, businesses may face challenges.
Data Entry Errors
Solution: Use validation rules.
Inconsistent Updates
Solution: Assign a responsible person.
Too Many KPIs
Solution: Focus on 15–20 critical metrics.
Lack of Analysis
Solution: Conduct monthly performance review meetings.
Therefore, structure and discipline ensure success.
Conclusion
Adventure tourism continues to expand rapidly. However, growth demands control, safety monitoring, revenue tracking, and operational efficiency.
The Adventure Tourism KPI Dashboard in Excel provides a structured and practical solution. It combines MTD, YTD, Target vs Actual, and Previous Year comparisons into one centralized system.
Moreover, it enhances visibility, improves decision-making, and strengthens performance accountability.
If you manage adventure tourism services, this dashboard can transform your operations.
Because when you measure performance, you improve performance.
Click to Purchases Adventure Tourism KPI Dashboard in Excel
Frequently Asked Questions (FAQs)
1. What is an Adventure Tourism KPI Dashboard in Excel?
It is a structured Excel-based tool that tracks financial, operational, safety, and customer KPIs for adventure tourism businesses.
2. How often should I update the dashboard?
You should update it monthly. However, review safety metrics weekly.
3. Can I customize KPIs in this dashboard?
Yes. You can add, remove, or modify KPIs easily in the KPI Definition sheet.
4. Do I need advanced Excel skills to use it?
No. Basic Excel knowledge works well.
5. Why should I track Previous Year data?
Previous year data helps you analyze growth trends and seasonal patterns.
6. What does LTB and UTB mean?
-
LTB means Lower the Better (for example, cancellation rate).
-
UTB means Upper the Better (for example, revenue).
7. How does this dashboard improve safety management?
It allows you to track incident rates, compliance, and training completion regularly.
Click to Purchases Adventure Tourism KPI Dashboard in Excel
Visit our YouTube channel to learn step-by-step video tutorials