The aerospace and defence industry operates in a highly complex, regulated, and competitive environment. Organizations in this sector must balance innovation, cost efficiency, compliance, and performance. To achieve this, companies rely on Key Performance Indicators (KPIs) that measure progress, highlight gaps, and drive informed decisions.
An Aerospace and Defence KPI Dashboard in Excel is a powerful tool that consolidates data, visualizes metrics, and provides actionable insights in one place. Excel remains a trusted platform because it is flexible, customizable, and widely used across industries.
In this article, we will explore the features of this dashboard, explain how it works, discuss its advantages, identify opportunities for improvement, share best practices, and answer common questions.
Click to Purchases Aerospace and Defence KPI Dashboard in Excel
What Is an Aerospace and Defence KPI Dashboard?
An Aerospace and Defence KPI Dashboard is a performance management tool built in Excel that enables companies to:
-
Monitor project costs, safety compliance, and operational efficiency.
-
Track progress against set targets for different departments.
-
Compare actual results with historical and target data.
-
Identify risks and areas for optimization.
By centralizing data into a single interface, this dashboard ensures decision-makers always have the right information at the right time.
Key Features of the Aerospace and Defence KPI Dashboard
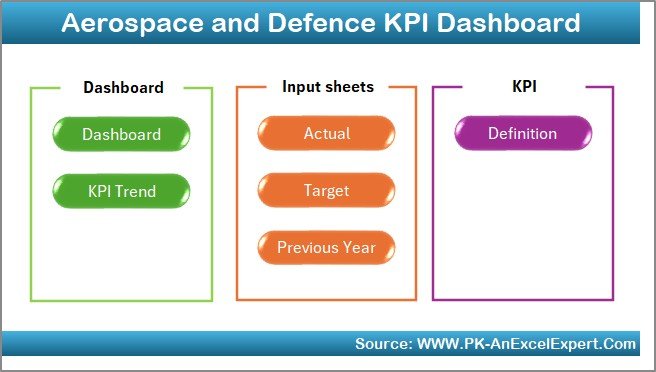
This dashboard is structured into seven worksheet tabs, each serving a unique function:
Home Sheet
-
Acts as the index page.
-
Contains navigation buttons to quickly jump between sheets.
-
Improves user experience and saves time.
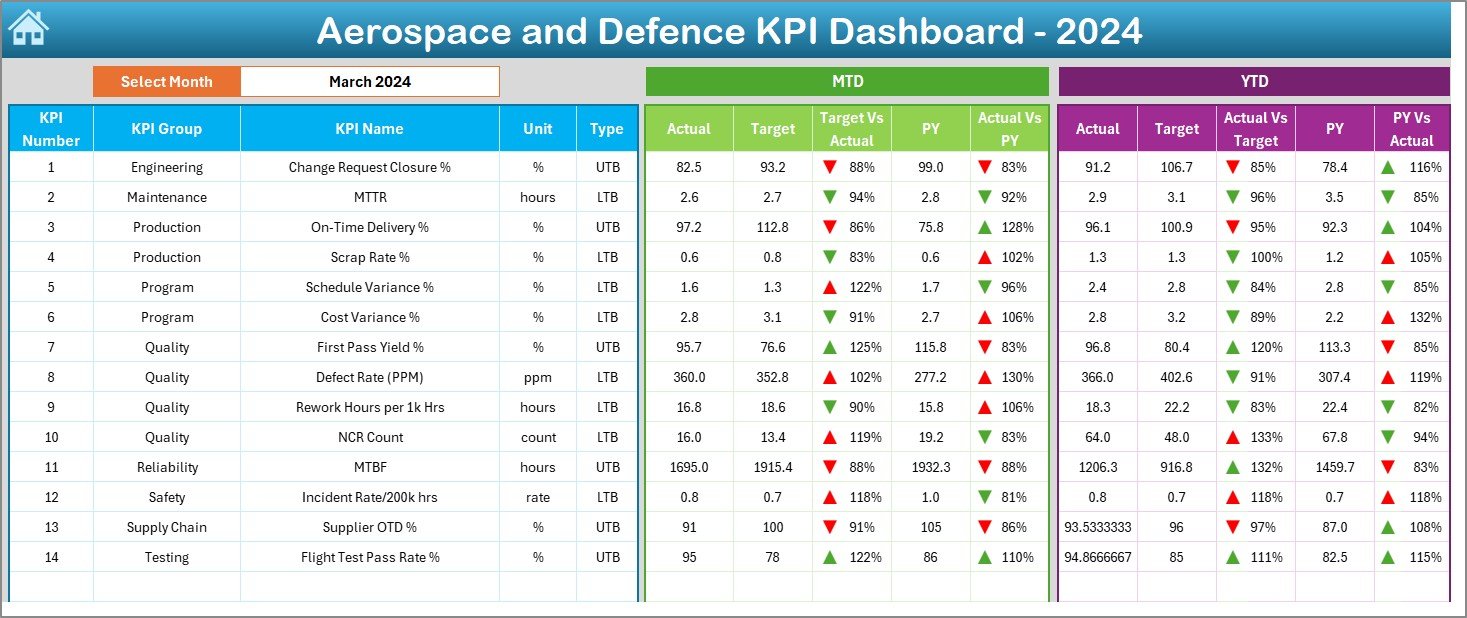
Dashboard Sheet Tab
-
The main analysis page of the file.
-
Allows users to select a month from a dropdown menu (cell D3).
Displays KPIs such as:
- MTD (Month-to-Date) Actual vs. Target vs. Previous Year.
- YTD (Year-to-Date) Actual vs. Target vs. Previous Year.
-
Conditional formatting with arrows highlights performance trends.
Click to Purchases Aerospace and Defence KPI Dashboard in Excel
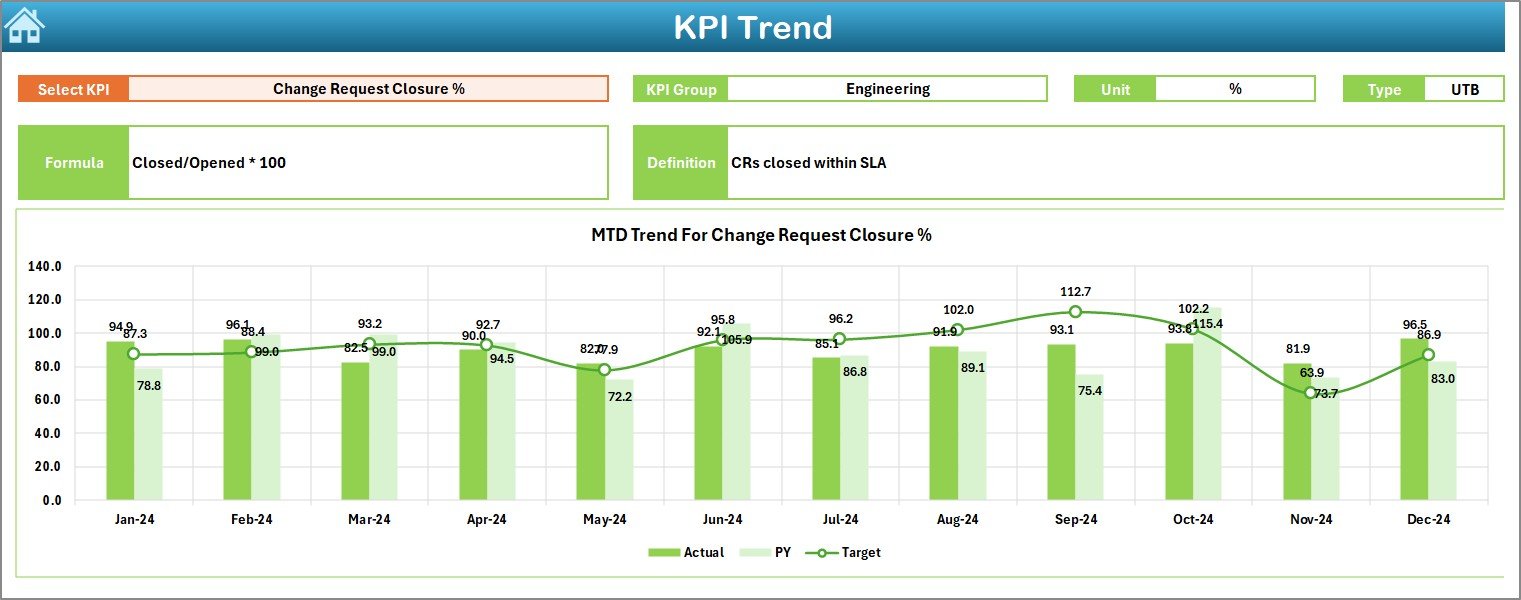
KPI Trend Sheet Tab
-
Lets users select a KPI (cell C3) for focused analysis.
-
Displays KPI details like group, unit, type (UTB/LTB), formula, and definition.
-
Shows trend charts for MTD and YTD across Actual, Target, and Previous Year.
Actual Numbers Input Sheet
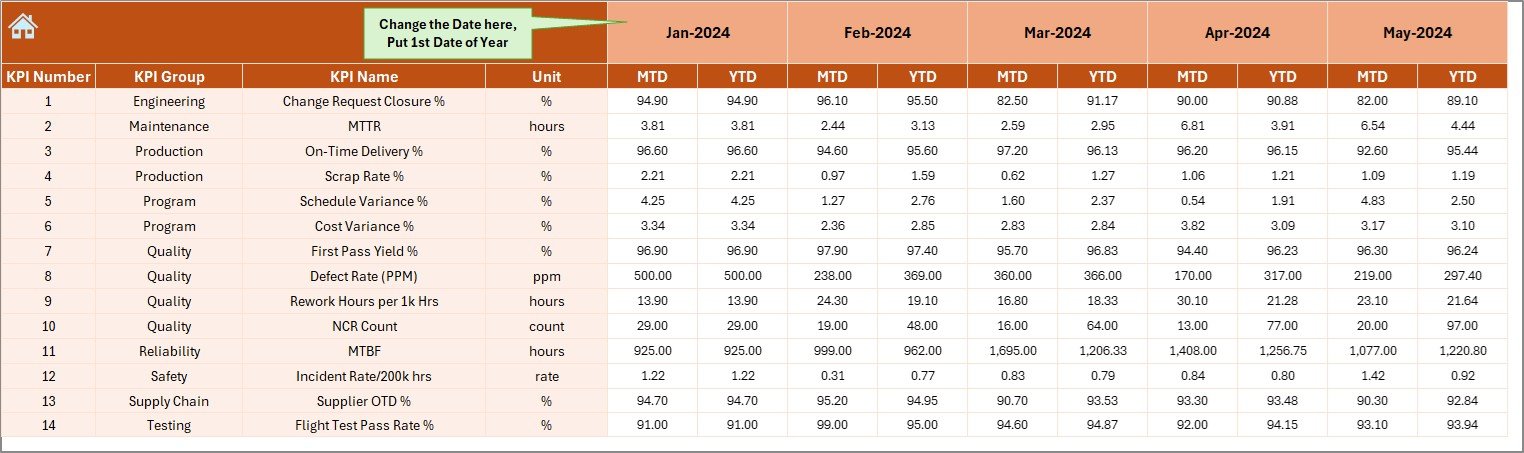
-
Used for entering real performance data.
-
MTD and YTD values are input for each KPI.
-
Month setup is controlled by range E1, making it dynamic.
Target Sheet Tab
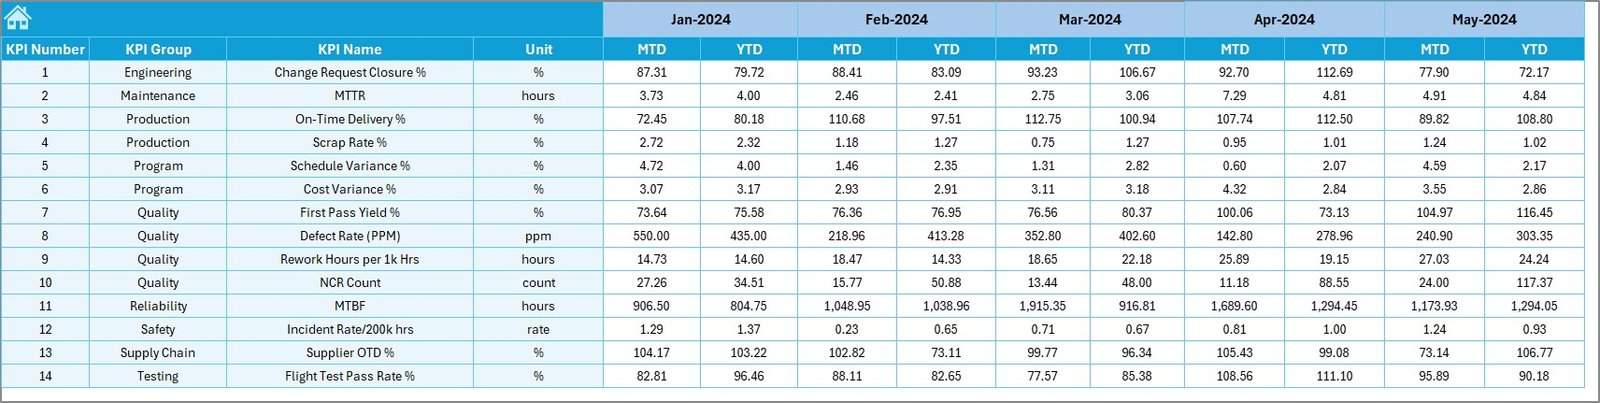
-
Stores planned targets for each KPI by month.
-
Includes both MTD and YTD entries.
-
Enables comparison between planned vs. achieved outcomes.
Previous Year Number Sheet
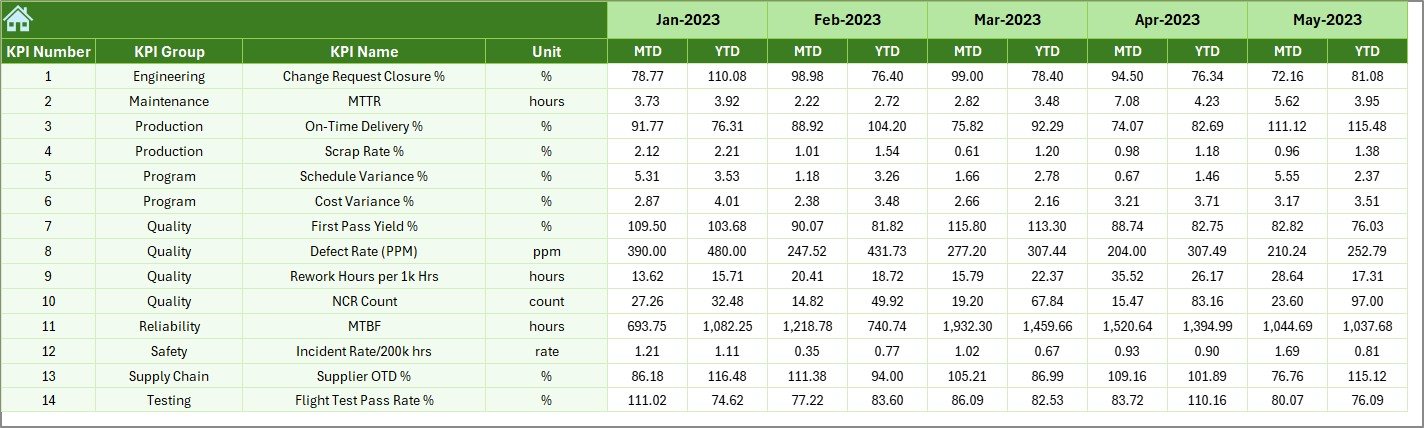
-
Holds historical performance data.
-
Provides a baseline for year-on-year comparisons.
KPI Definition Sheet Tab
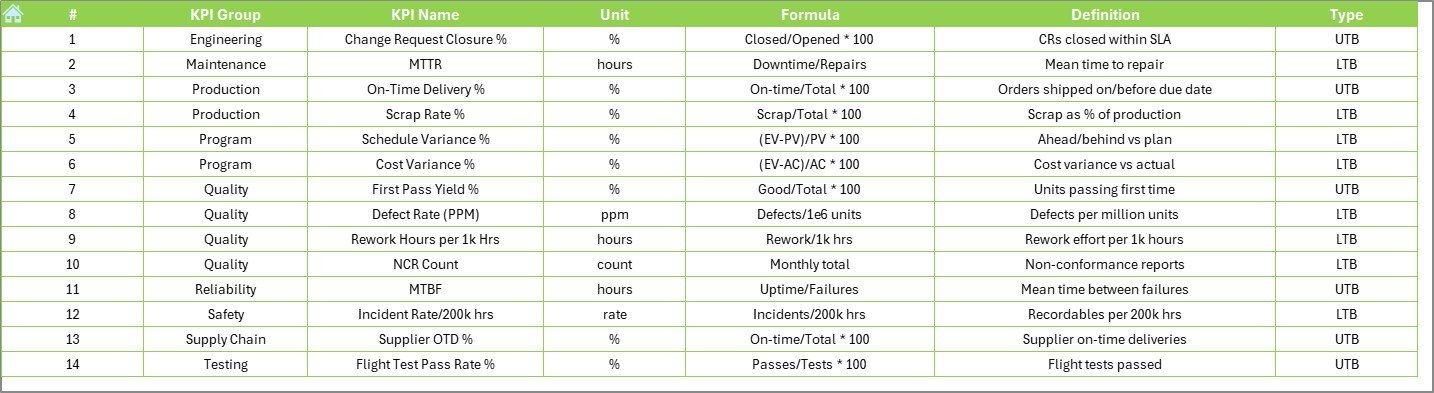
-
Serves as the reference sheet.
-
Captures KPI Group, Name, Unit, Formula, and Definition.
-
Ensures consistency and clarity across reporting.
Why Use Excel for Aerospace and Defence KPI Dashboards?
While advanced BI tools exist, Excel offers unique advantages:
-
Accessibility – Most organizations already use Excel.
-
Cost-effectiveness – No additional software licenses required.
-
Flexibility – Easy to customize for unique KPI structures.
-
Integration – Compatible with ERP systems, CSV imports, and other data sources.
-
Visualization – Provides charts, slicers, pivot tables, and conditional formatting.
Advantages of Aerospace and Defence KPI Dashboard
Using this dashboard offers several benefits:
📊 Centralized Data Tracking – All KPIs in one place for faster access.
✅ Improved Accuracy – Reduced manual errors through structured input sheets.
🔍 Deeper Insights – Side-by-side comparison of actuals, targets, and historical data.
⏱ Time-Saving – Automated calculations and dropdown-driven reports.
📈 Performance Transparency – Clear visuals with up/down arrows and progress tracking.
🎯 Strategic Alignment – Keeps departments aligned with organizational goals.
Opportunities for Improvement in KPI Tracking
Even though Excel dashboards are robust, organizations can improve them further by:
-
Automating Data Entry – Use Power Query or VBA to pull data from ERP systems.
-
Adding Real-Time Updates – Connect with live data feeds where possible.
-
Integrating Risk Management Metrics – Expand KPIs to include compliance and security checks.
-
Enhancing Visualization – Incorporate heatmaps, gauges, and drill-down charts.
-
Expanding Collaboration – Store on SharePoint or Teams for multi-user access.
-
Implementing Security Controls – Add password protection for sensitive sheets.
Best Practices for Aerospace and Defence KPI Dashboard
To maximize value, follow these best practices:
-
Define Clear KPIs – Ensure KPIs align with organizational goals.
-
Keep It Simple – Avoid overloading with too many metrics; focus on key drivers.
-
Update Regularly – Refresh data monthly to ensure accuracy.
-
Use Conditional Formatting Wisely – Highlight only critical variances.
-
Document Everything – Maintain a detailed KPI definition sheet.
-
Enable Drill-Down Analysis – Allow users to explore KPI trends in depth.
-
Train Users – Provide training for staff to understand dashboard navigation.
How This Dashboard Supports Aerospace and Defence Operations
This Excel dashboard directly benefits organizations by:
-
Project Monitoring – Tracks budgets, delivery timelines, and manpower.
-
Operational Efficiency – Measures fleet utilization, downtime, and resource allocation.
-
Safety Compliance – Tracks incidents, safety drills, and adherence to standards.
-
Supplier Performance – Evaluates vendors against delivery and quality targets.
-
R&D Effectiveness – Monitors innovation spend vs. outcomes.
By applying data-driven insights, aerospace and defence companies can improve both efficiency and compliance.
Conclusion
The Aerospace and Defence KPI Dashboard in Excel is a ready-to-use, structured, and highly flexible solution. It empowers organizations to analyze performance, track progress, and align strategies with goals. With its combination of predefined sheets, trend analysis, and KPI definitions, it provides everything a decision-maker needs in one place.
While Excel dashboards may not replace advanced BI tools, they remain a practical, cost-effective choice for many organizations. With proper implementation and adherence to best practices, this dashboard becomes an essential asset in performance management.
Frequently Asked Questions (FAQs)
1. What KPIs are most important in aerospace and defence?
Key KPIs include operational efficiency, safety compliance, cost control, supplier performance, and project delivery timelines.
2. Can this dashboard track both MTD and YTD metrics?
Yes. The dashboard is designed to capture Month-to-Date and Year-to-Date values for each KPI.
3. Is it possible to compare current performance with previous years?
Absolutely. The Previous Year Number Sheet provides historical data for year-on-year comparisons.
4. How can organizations ensure data accuracy in this dashboard?
By defining KPIs clearly, automating data entry where possible, and maintaining consistent update routines.
5. Can this Excel dashboard be integrated with ERP systems?
Yes. Using Power Query or VBA macros, organizations can connect Excel dashboards with ERP or database systems.
6. Is Excel secure enough for aerospace and defence KPI data?
Excel provides password protection and restricted access features. For sensitive data, additional IT security protocols should be applied.
7. Who can benefit from this dashboard?
-
Project Managers
-
Defence Contractors
-
Compliance Officers
-
Operations Teams
-
Executives and Decision-Makers
Click to Purchases Aerospace and Defence KPI Dashboard in Excel
Visit our YouTube channel to learn step-by-step video tutorials