Affiliate marketing grows fast when you track the right numbers. However, many marketers still rely on scattered spreadsheets, platform dashboards, and random screenshots. As a result, they miss trends, lose clarity, and make slow decisions.
So, what should you do instead?
You should use a structured Affiliate Marketing KPI Scorecard in Excel. It gives you one place to track Actual vs Target, monitor MTD and YTD performance, and spot problems early. Even better, it helps you scale what works and fix what does not.
In this guide, you will learn what an Affiliate Marketing KPI Scorecard is, why it matters, which KPIs you should track, and how to use a ready-to-use Excel template with 4 worksheets: Scorecard, KPI Trend, Input Data, and KPI Definition.
Click to buy Affiliate Marketing KPI Scorecard in Excel
What Is an Affiliate Marketing KPI Scorecard in Excel?
An Affiliate Marketing KPI Scorecard in Excel is a performance tracking template that helps you monitor affiliate results using clear KPIs (Key Performance Indicators).
Instead of jumping between affiliate networks and reports, you track everything in one scorecard. Then, you compare:
- Actual vs Target
- MTD (Month-to-Date) vs YTD (Year-to-Date)
- Current year vs Previous year (PY)
Because Excel supports charts, dropdowns, and conditional formatting, you can build a dashboard-like view that stays simple and easy to use.
Why Do You Need an Affiliate Marketing KPI Scorecard?
Affiliate programs involve many moving parts. You work with different publishers, different traffic sources, and different offers. Therefore, you need a clean system that shows what drives growth.
Here is why a scorecard helps:
You get clarity in one view
You can track 10 KPIs in one view, so you do not waste time on multiple tabs and reports.
You take faster decisions
When you see a KPI drop early, you can pause campaigns, update creatives, or improve landing pages quickly.
You set measurable goals
Targets keep your program focused. Also, targets help you align affiliates, managers, and budgets.
You improve profitability
Affiliate revenue means nothing if margins drop. So, your scorecard helps you balance Sales, CPA, ROAS, and Profit.
What KPIs Should You Track in Affiliate Marketing?
Many marketers track too many metrics. However, you should focus on KPIs that connect directly to growth and profit.
Below are high-impact KPI categories you should include in your scorecard.
Traffic KPIs
These KPIs show volume and reach.
- Clicks
- Unique clicks
- Sessions
- Traffic share by affiliate
- New vs returning visitors
Conversion KPIs
These KPIs show how well traffic converts.
- Conversion rate (CR)
- Leads or sales
- Approved conversion rate
- Cart-to-checkout conversion (if relevant)
Cost & Profit KPIs
These KPIs protect your margins.
- Commission cost
- CPA (Cost per acquisition)
- ROAS (Return on ad spend) for paid affiliates
- Net profit
- Profit margin %
Quality KPIs
These KPIs reduce fraud and poor-quality traffic.
- Refund rate
- Chargeback rate
- Fraud rate
- Average order value (AOV)
- LTV (Lifetime value) if available
Operational KPIs
These KPIs improve management.
- Active affiliates
- New affiliate sign-ups
- Activation rate
- On-time payout %
- Creative refresh cycle
Which 10 KPIs Work Best for a Simple Scorecard?
If you want a powerful yet simple scorecard, start with these 10 KPIs:
- Total Clicks
- Conversion Rate (CR)
- Total Conversions (Leads/Sales)
- Revenue
- Commission Cost
- CPA
- AOV
- Refund/Return Rate
- Net Profit
- Active Affiliates
This set covers volume, efficiency, quality, and profitability. Therefore, you get a balanced view.
How Do You Calculate Affiliate Marketing KPIs?
You do not need complex math. You just need consistent formulas.
Here are common formulas you can use in Excel:
- Conversion Rate (CR) = Conversions ÷ Clicks
- CPA = Commission Cost ÷ Conversions
- AOV = Revenue ÷ Orders
- Net Profit = Revenue − Commission Cost − Other Costs
- Refund Rate = Refund Orders ÷ Total Orders
- Activation Rate = Active Affiliates ÷ Total Affiliates
Also, you can tag each KPI type as:
- Upper the Better (Revenue, Conversions, CR, AOV, Profit)
- Lower the Better (CPA, Refund Rate, Chargebacks)
This classification helps you set correct visual indicators.
What’s Inside the Affiliate Marketing KPI Scorecard in Excel Template?
This ready-to-use template includes 4 worksheets. Each sheet has a clear purpose. So, you can update data easily and review results quickly.
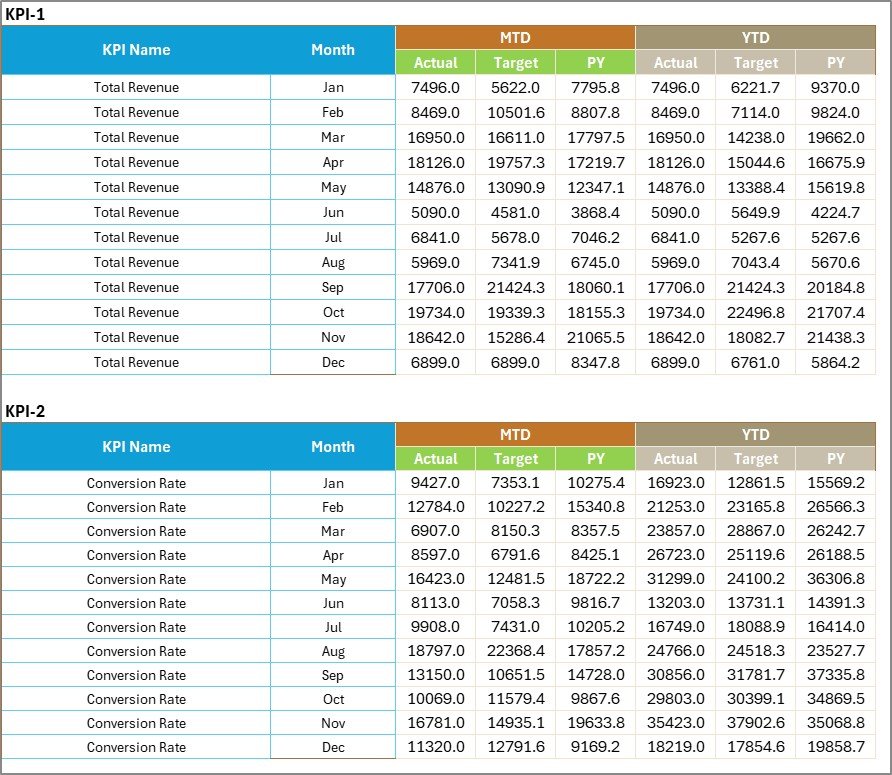
Scorecard Sheet: How the Main Dashboard Works
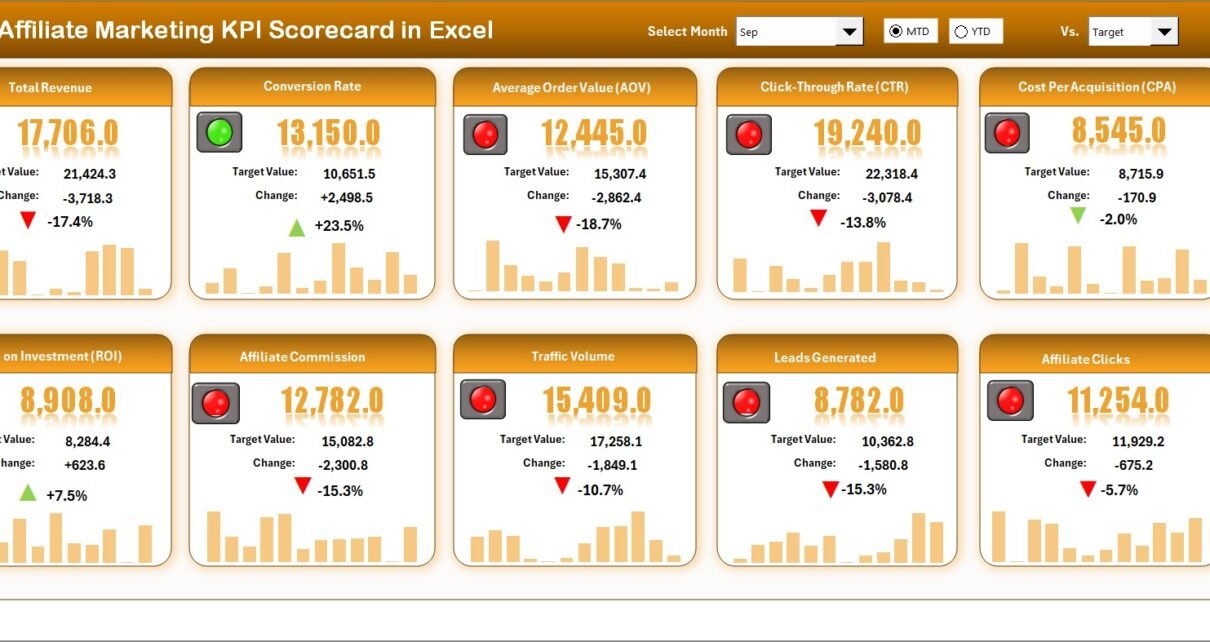
The Scorecard sheet acts like the main interface. You can view your KPI performance in one screen.
Key features of the Scorecard sheet
- Dropdown menus to select:
- Month
- MTD (Month-to-Date)
- YTD (Year-to-Date)
- Actual vs Target comparison for every KPI
- Visual indicators using conditional formatting (colors, arrows, or icons)
- Comprehensive KPI overview with:
- MTD values
- YTD values
- Target values
- PY (previous year) values (if you track it)
- 10 KPIs in one view, so you get a quick snapshot
How to use the Scorecard sheet
- Select the month from the dropdown.
- Choose MTD or YTD analysis mode.
- Review KPI status:
Green means on track
Yellow means watchlist
Red means action needed
Compare Actual vs Target and decide next steps.
Because everything stays in one view, you save time and work faster.
Click to buy Affiliate Marketing KPI Scorecard in Excel
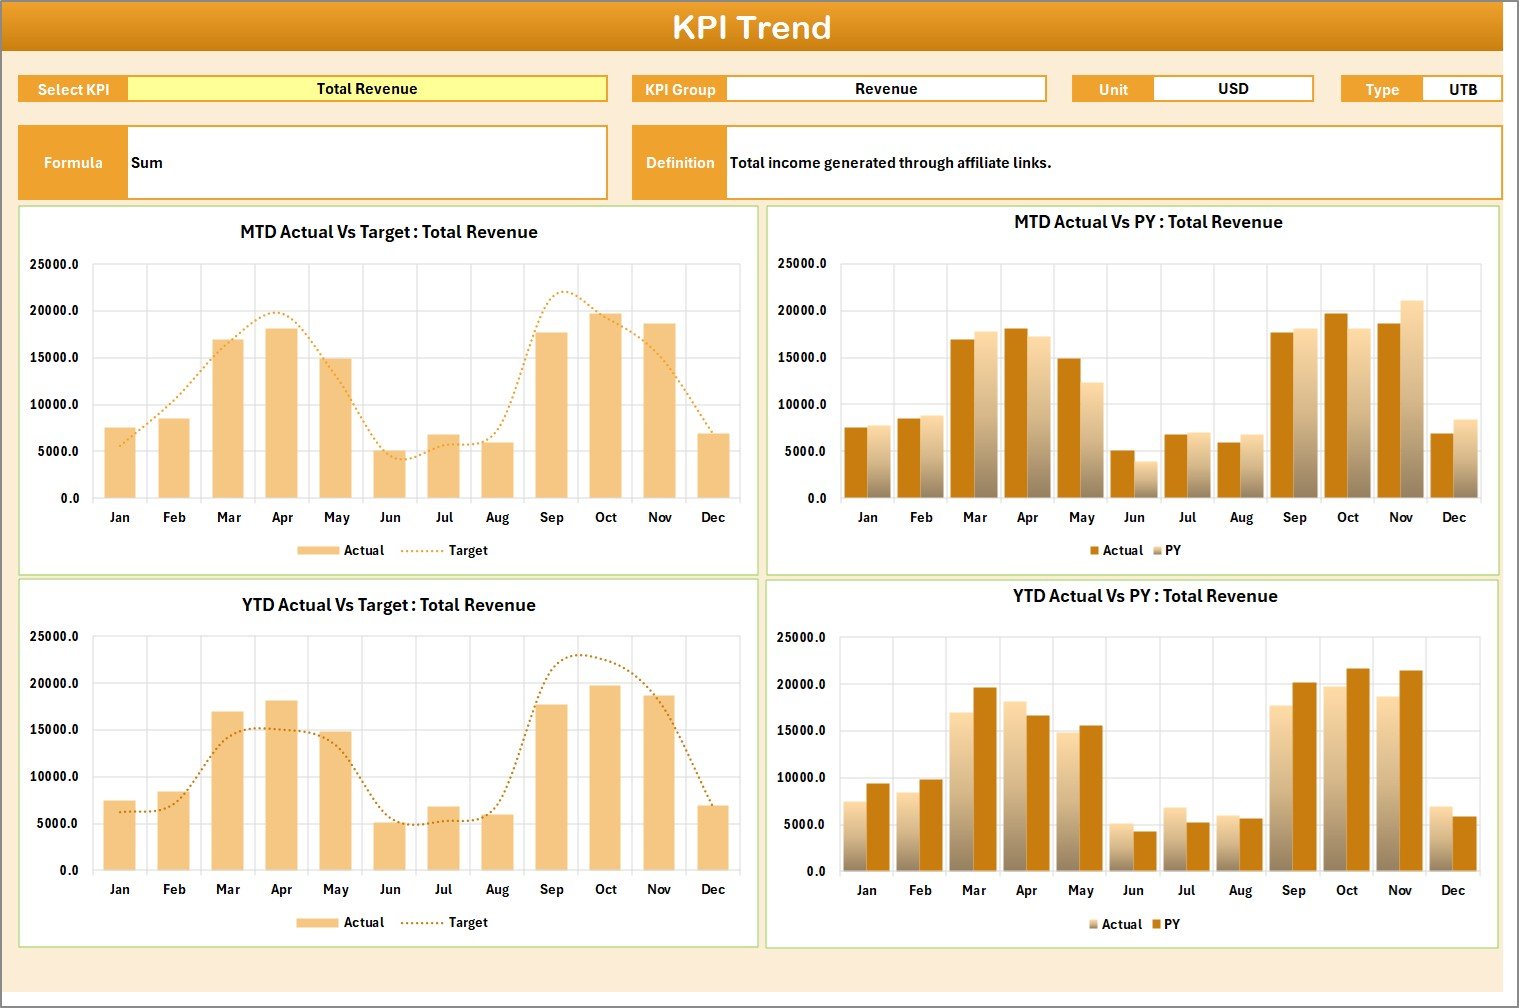
KPI Trend Sheet: How to Analyze KPI Movement
The KPI Trend sheet helps you analyze the story behind a KPI.
What you can do on the KPI Trend sheet
- Select the KPI name from the dropdown at cell C3
- View important KPI details:
- KPI Group
- Unit of KPI
- KPI Type: Lower the Better or Upper the Better
- KPI Formula
- KPI Definition
- View trend charts for:
- Actual
- Target
- PY (previous year)
Also, you see both:
- MTD trend chart
- YTD trend chart
Why KPI trend matters
A KPI may look fine today, yet a downward trend can warn you early. Therefore, trend charts protect you from late surprises.
How to use it (simple workflow)
- Pick a KPI from the dropdown.
- Study the trend line movement.
- Find the month where performance changed.
- Check affiliate mix, traffic source, and offer changes.
- Take action based on the trend.
Click to buy Affiliate Marketing KPI Scorecard in Excel
Input Data Sheet: Where You Enter KPI Numbers
The Input Data sheet is where you record KPI data for the scorecard.
Key features
- Data entry table for actual values, targets, and other metrics
- Easy updates as new results come in
- A flexible structure, so the scorecard stays current
Best way to structure your input data
To keep Excel reporting easy, store data in a clean table format like:
- Date / Month
- KPI Name
- Actual
- Target
- PY (optional)
- Affiliate / Channel (optional)
- Region (optional)
Then, charts and formulas work smoothly.
Click to buy Affiliate Marketing KPI Scorecard in Excel
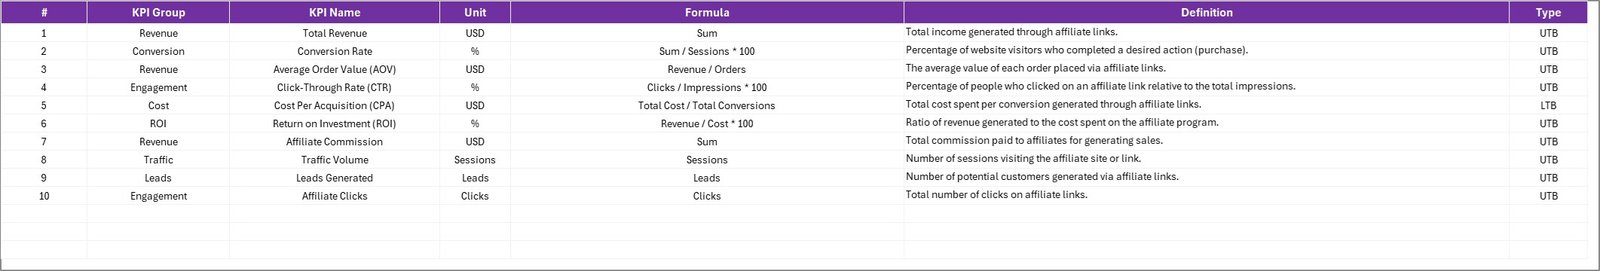
KPI Definition Sheet: Build Strong KPI Standards
The KPI Definition sheet stores the meaning and calculation rules of each KPI.
What you enter here
- KPI Name
- KPI Group
- Unit
- Formula
- KPI Definition
This sheet matters because it prevents confusion. For example, one person may calculate “Conversion Rate” differently than another. Therefore, this sheet keeps everyone aligned.
Click to buy Affiliate Marketing KPI Scorecard in Excel
How Do You Set Targets for Affiliate Marketing KPIs?
Targets make your scorecard useful. Without targets, you only watch numbers. With targets, you manage performance.
Here are simple ways to set targets:
Use last 3–6 months average
This method stays realistic and easy.
Use previous year benchmarks (PY)
This method works well for seasonal programs.
Use tier-based targets
Example:
- New affiliates: basic targets
- Top affiliates: aggressive targets
Use business goal-based targets
If you want 20% growth, set KPI targets that support that goal.
How to Implement This Scorecard Step-by-Step
Step 1: Define your KPI list
Start with 10 KPIs. Then expand only if needed.
Step 2: Fill KPI Definition sheet
Write KPI name, formula, and meaning so tracking stays consistent.
Step 3: Set targets for each KPI
Use averages, PY values, or business goals.
Step 4: Update the Input Data sheet regularly
Update weekly or monthly. Consistency matters more than perfection.
Step 5: Review Scorecard and KPI Trend
Use the Scorecard for overview. Then use Trend for deeper analysis.
How to Use the Scorecard to Improve Affiliate Performance
Here are practical actions you can take using the scorecard insights:
If clicks rise but conversions fall
- Improve landing pages
- Match traffic source with offer
- Update creatives and copy
- Check tracking links
If conversions rise but profit falls
- Review commission rates
- Reduce coupon leakage
- Improve upsells and AOV
- Negotiate better affiliate terms
If refund rate rises
- Review traffic quality
- Block suspicious affiliates
- Improve product expectations on landing pages
- Analyze customer feedback
If active affiliates drop
- Run activation campaigns
- Offer bonuses for new partners
- Share top-performing creatives
- Improve communication frequency
Advantages of Affiliate Marketing KPI Scorecard in Excel
Better visibility
You see performance clearly for MTD and YTD.
Faster decision-making
You act quickly because you track Actual vs Target.
Stronger affiliate management
You identify top affiliates and weak affiliates easily.
Better budgeting
You control commission costs and protect margins.
Improved growth planning
You set targets and track progress without confusion.
Opportunities for Improvement in Your Affiliate Tracking
Even if you already track affiliate performance, you can improve with these ideas:
- Track affiliate-level KPIs (top 20 affiliates)
- Add traffic source tags (SEO, PPC, Social, Email)
- Track creative performance (banner vs text link)
- Add weekly reporting view for faster action
- Include fraud signals like abnormal CR spikes
These small improvements can increase your program quality quickly.
Best Practices for the Affiliate Marketing KPI Scorecard in Excel
Update data on a fixed schedule
Choose weekly or monthly updates. Then follow it strictly.
Keep KPI definitions consistent
Always use one formula per KPI. So, reports stay reliable.
Track both MTD and YTD
MTD shows short-term changes. YTD shows long-term performance.
Use visual indicators carefully
Use simple green/yellow/red logic. Also, keep thresholds realistic.
Focus on profit KPIs, not only revenue
Revenue looks good, but profit pays the bills. Therefore, track Net Profit and CPA.
Review trends before making big decisions
A single bad month does not always mean a real issue. Trend charts help you avoid wrong decisions.
Build a “Top 5 actions” habit
After every scorecard review, list 5 actions:
- 2 actions to scale winners
- 2 actions to fix issues
- 1 action to test new growth
Conclusion: Track, Improve, and Scale Affiliate Marketing with Confidence
Affiliate marketing becomes easier when you measure performance properly. However, you need a simple system that stays consistent, clear, and actionable.
That is why the Affiliate Marketing KPI Scorecard in Excel matters.
It gives you:
- One-view KPI tracking
- MTD and YTD analysis
- Actual vs Target comparison
- KPI definitions and formulas
- KPI Trend charts for Actual, Target, and PY
So, you stop guessing and start improving performance with data.
Frequently Asked Questions (FAQs)
What is the best KPI to track in affiliate marketing?
You should track Revenue, Conversions, CPA, and Net Profit together. Revenue alone does not show profitability, so you need a balanced set.
How often should I update my affiliate KPI scorecard?
You should update it weekly for active programs. However, you can update it monthly if your volume stays low.
How do I choose between MTD and YTD tracking?
Use MTD when you want short-term performance monitoring. Use YTD when you want long-term trend tracking.
Can I track multiple affiliate networks in one Excel scorecard?
Yes. You can consolidate data from multiple networks into the Input Data sheet. Then, the scorecard can show combined KPIs.
What does “Upper the Better” and “Lower the Better” mean?
- Upper the Better means higher values show good performance (Revenue, CR, Conversions).
- Lower the Better means lower values show good performance (CPA, Refund Rate).
How do I set realistic KPI targets?
You can use:
- Last 3–6 months average
- Previous year results (PY)
- Business growth goals
This approach keeps targets realistic and measurable.
Why should I maintain a KPI Definition sheet?
Because it prevents confusion and keeps your tracking consistent. Also, it helps teams understand KPI meaning quickly.
What should I do if the scorecard shows poor performance?
Start with the KPI Trend sheet, find where the drop started, and then take action like improving landing pages, changing creatives, or reviewing affiliate quality.
Visit our YouTube channel to learn step-by-step video tutorials
Watch the step-by-step video tutorial:
Click to buy Affiliate Marketing KPI Scorecard in Excel