In the fast-evolving world of agriculture, data-driven innovation has become the foundation of success. With the rise of Agri Tech startups, farmers, agronomists, and agribusiness professionals are adopting digital tools to optimize productivity, sustainability, and profitability.
However, tracking and analyzing business performance can be complex when managing multiple operations like crop yield, equipment usage, weather impact, supply chain logistics, and customer demand. This is where the Agri Tech Startups KPI Dashboard in Excel comes into play.
This ready-to-use, interactive, and customizable dashboard allows Agri Tech businesses to monitor their key performance indicators (KPIs) in real time — providing clear insights for better decision-making and resource allocation.
In this article, you’ll explore what this dashboard is, how it works, its structure, advantages, best practices, and frequently asked questions.
Click to Purchases Agri Tech Startups KPI Dashboard in Excel
🌱 What Is an Agri Tech Startups KPI Dashboard in Excel?
An Agri Tech Startups KPI Dashboard in Excel is a comprehensive performance management tool designed to help agriculture technology companies track, visualize, and analyze their operational, financial, and environmental KPIs.
Built entirely in Microsoft Excel, it offers dynamic features such as drop-down filters, trend charts, conditional formatting, and interactive navigation buttons that transform static data into actionable insights.
The dashboard supports Month-to-Date (MTD) and Year-to-Date (YTD) analysis, helping Agri Tech startups evaluate performance against targets and compare results with the previous year.
🌿 Key Features of the Agri Tech Startups KPI Dashboard in Excel
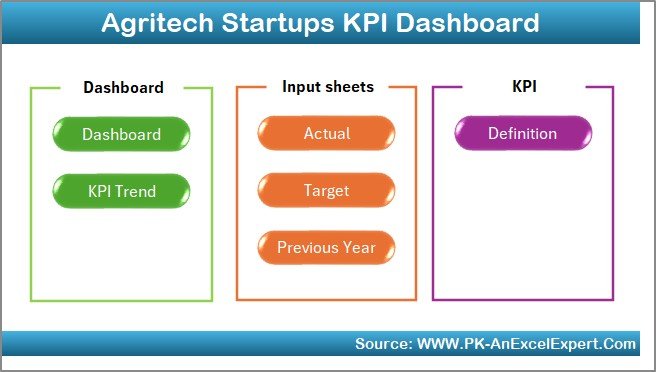
This dashboard includes 7 well-structured worksheets, each serving a specific purpose. Let’s explore them one by one.
1️⃣ Home Sheet – Quick Navigation
-
The Home sheet serves as the index page of the dashboard.
-
It provides six clickable buttons to navigate directly to different sections (Dashboard, Trends, Targets, Inputs, etc.).
-
This makes it user-friendly and time-efficient, ensuring even non-technical users can access reports effortlessly.
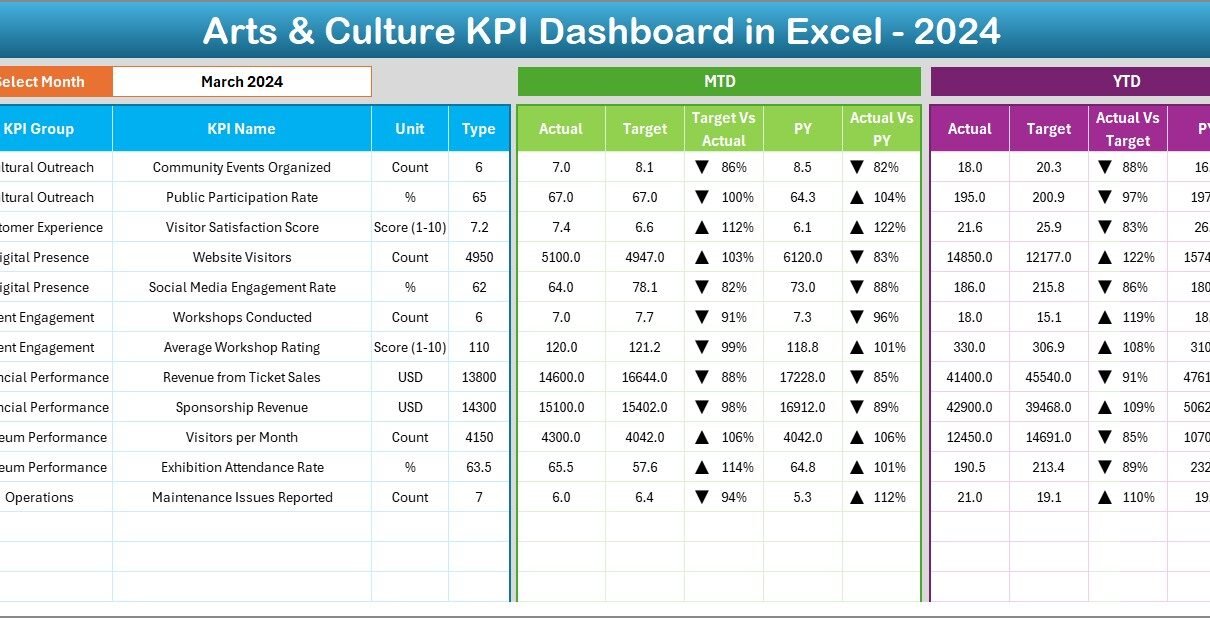
2️⃣ Dashboard Sheet Tab – The Central Hub

-
This is the main analysis page of the entire dashboard.
-
Users can select a specific month from the drop-down menu in cell D3, and the entire dashboard updates automatically.
-
The dashboard displays:
-
MTD (Month-to-Date) Actual vs Target vs Previous Year data
-
YTD (Year-to-Date) Actual vs Target vs Previous Year data
-
-
Conditional formatting and arrow indicators (🔼🔽) make performance trends visually clear.
-
It provides both high-level summaries and detailed comparisons across multiple performance dimensions like productivity, revenue, and operational efficiency.
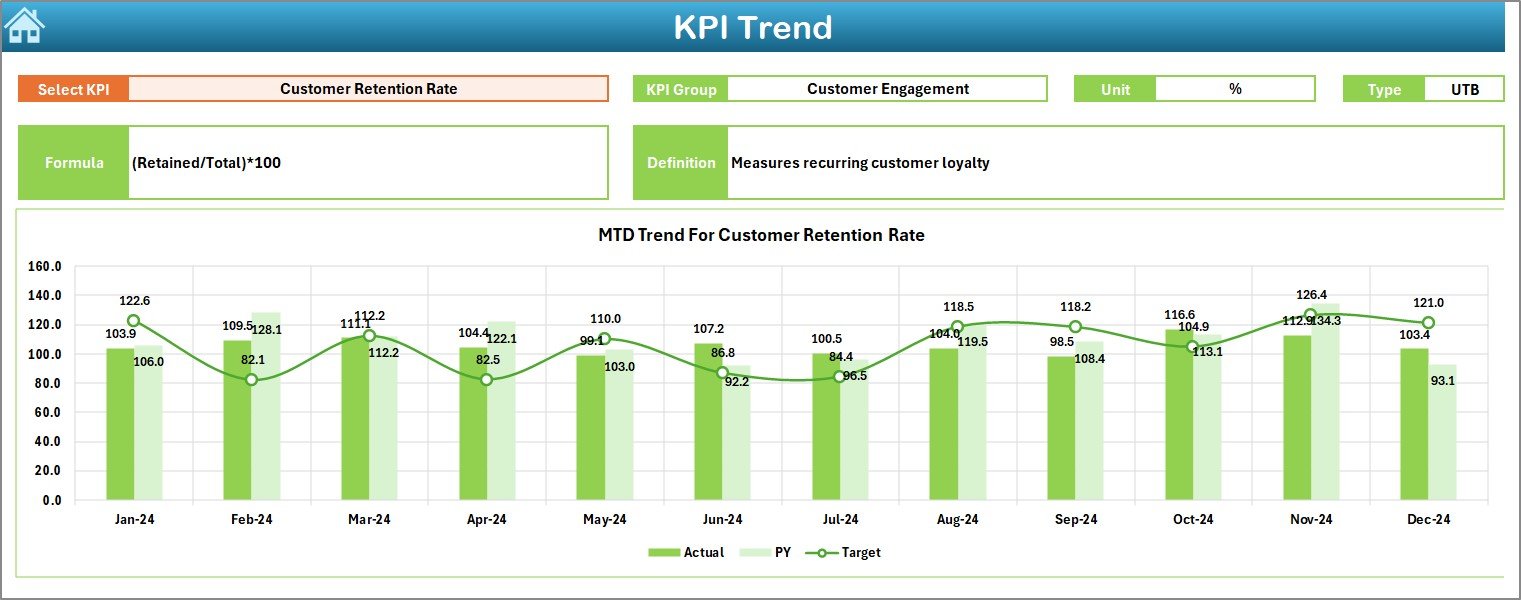
3️⃣ KPI Trend Sheet Tab – Deep Dive into Performance
-
The KPI Trend sheet allows users to choose any KPI name from the drop-down list in cell C3.
-
It then displays:
-
KPI Group
-
Unit of Measurement
-
Type of KPI (Lower the Better or Upper the Better)
-
KPI Formula and Definition
-
-
Trend charts visualize MTD and YTD performance for Actual, Target, and Previous Year values — helping users identify seasonality or performance fluctuations.
4️⃣ Actual Numbers Input Sheet – Real-Time Data Entry

-
This sheet is where users input actual KPI values for both MTD and YTD metrics.
-
By changing the month in cell E1, users can easily update values for different periods.
-
It enables seamless data refreshes and helps maintain up-to-date performance tracking without modifying the dashboard’s structure.
5️⃣ Target Sheet Tab – Goal Setting and Benchmarking

-
The Target Sheet is dedicated to defining monthly targets for each KPI.
-
Both MTD and YTD target values are captured, ensuring measurable and actionable goal tracking.
-
These targets serve as benchmarks for performance comparison in the Dashboard and Trend sheets.
6️⃣ Previous Year Numbers Sheet Tab – Historical Comparison

-
This sheet holds previous year’s data, structured similarly to the current year’s figures.
-
It allows startups to compare year-over-year progress, track improvement rates, and highlight growth patterns.
7️⃣ KPI Definition Sheet Tab – The Knowledge Base

-
This tab defines all KPIs used in the dashboard.
-
It includes:
-
KPI Name
-
KPI Group
-
Unit of Measure
-
Formula
-
Definition
-
-
It acts as a reference library to ensure consistency, clarity, and alignment across the entire organization.
🌾 Why Do Agri Tech Startups Need a KPI Dashboard?
Agri Tech startups operate in a highly dynamic ecosystem involving weather variations, crop cycles, logistics, technology adoption, and sustainability metrics. Monitoring these moving parts manually can lead to inefficiencies and data errors.
The Agri Tech Startups KPI Dashboard in Excel solves this by centralizing all performance metrics in one place.
Here’s how it helps:
-
Consolidates data from multiple sources (sales, operations, environment, etc.)
-
Provides a unified, real-time performance view
-
Enables faster, evidence-based decisions
-
Identifies risks, inefficiencies, or underperforming areas early
-
Enhances investor and stakeholder reporting
🌻 Key KPI Categories to Track in Agri Tech Startups
To understand the full potential of this dashboard, it’s useful to look at the common KPI groups used in the agriculture technology sector.
🌦️ 1. Crop Production and Efficiency KPIs
-
Crop Yield per Acre
-
Water Usage Efficiency
-
Fertilizer Utilization Rate
-
Harvest Success Rate
-
Seed Germination Percentage
🚜 2. Technology Adoption KPIs
-
IoT Devices Deployed
-
Precision Equipment Utilization Rate
-
Sensor Data Accuracy
-
AI Model Prediction Accuracy
🧑🌾 3. Farmer Engagement KPIs
-
Active Farmers on Platform
-
Training Sessions Conducted
-
Customer Retention Rate
-
Feedback Score
💰 4. Financial Performance KPIs
-
Revenue per Farm
-
Cost per Hectare
-
ROI of Agri Tech Investments
-
Profit Margin Percentage
🌍 5. Sustainability and Environmental Impact KPIs
-
CO₂ Emission Reduction (%)
-
Waste Recycled (%)
-
Energy Consumption per Operation
-
Sustainable Practices Adoption Rate
🕒 6. Operational and Logistics KPIs
-
On-Time Delivery Rate
-
Equipment Downtime Hours
-
Supply Chain Lead Time
-
Order Fulfillment Accuracy
🌿 Advantages of the Agri Tech Startups KPI Dashboard in Excel
Let’s explore the benefits that make this dashboard a must-have for every modern Agri Tech startup.
✅ 1. Centralized Data Management
All performance data — from crop yield to sustainability — resides in one place, making analysis faster and more reliable.
✅ 2. Easy Customization
Startups can easily add or modify KPIs to match their business model or regional requirements without coding or expensive software.
✅ 3. Real-Time Insights
With month and year selectors, leaders can track trends instantly, identify deviations, and respond quickly.
✅ 4. Enhanced Decision-Making
Visual indicators and charts simplify complex data, allowing stakeholders to make data-driven decisions confidently.
✅ 5. Affordable and Accessible
Built entirely in Excel, it eliminates the need for costly BI tools while still offering high-quality analytics.
✅ 6. Historical Comparison
The dashboard compares current vs previous year’s performance, offering valuable growth insights.
✅ 7. Improved Accountability
Clear KPI definitions ensure everyone in the organization understands their goals and contribution.
🌻 How to Use the Dashboard Effectively
Using the Agri Tech Startups KPI Dashboard in Excel efficiently requires a few key practices:
1. Regular Data Updates
Keep the Actual Numbers Input Sheet current by updating values at least once per month.
2. Review KPI Definitions
Ensure each KPI is clearly defined in the KPI Definition Sheet before data entry begins.
3. Compare Trends
Use the KPI Trend Sheet to monitor improvements or issues across different seasons or crop cycles.
4. Adjust Targets Periodically
Revise target values in the Target Sheet based on market trends, climate changes, or resource availability.
5. Automate Data Imports (Optional)
Advanced users can connect Excel with APIs or databases to fetch real-time data automatically.
Click to Purchases Agri Tech Startups KPI Dashboard in Excel
🌾 Best Practices for the Agri Tech Startups KPI Dashboard
To maximize efficiency and accuracy, follow these best practices:
🌿 Keep KPI Definitions Simple – Ensure that all users understand each metric’s meaning.
💧 Validate Input Data – Double-check data before updating Actual and Target sheets.
📊 Use Dynamic Drop-downs – Maintain consistency while selecting months or KPI names.
🔍 Leverage Conditional Formatting – Highlight performance gaps visually for faster understanding.
🌾 Compare MTD and YTD Regularly – Use both time frames to evaluate short-term and long-term progress.
💼 Conduct Monthly Reviews – Discuss findings with teams and adjust strategies accordingly.
🌍 Integrate Sustainability Metrics – Include KPIs that align with ESG and green-agriculture goals.
💡 Create Visual Summaries – Add pivot charts or slicers for executive presentations.
🌾 Future of Data Analytics in Agri Tech
The Agri Tech industry continues to evolve with AI, IoT, blockchain, and predictive analytics. Integrating this Excel-based dashboard with real-time data sources such as smart sensors or ERP systems will revolutionize agricultural analytics.
In the near future, startups may use Power BI or cloud dashboards for advanced visualization. However, Excel remains a powerful, flexible, and cost-effective starting point for building analytics maturity.
🌱 Conclusion
The Agri Tech Startups KPI Dashboard in Excel is more than just a reporting tool — it’s a strategic compass for growth.
It enables Agri Tech founders, data analysts, and farmers to measure, compare, and improve every aspect of their business operations. By simplifying KPI tracking and automating performance visualization, this dashboard empowers users to make smarter, faster, and more sustainable decisions.
Whether you’re optimizing crop yields, scaling digital platforms, or tracking sustainability metrics, this Excel dashboard offers a practical, affordable, and effective solution to manage performance and drive success in modern agriculture.
Click to Purchases Agri Tech Startups KPI Dashboard in Excel
🌿 Frequently Asked Questions (FAQs)
1 What is the main purpose of the Agri Tech Startups KPI Dashboard in Excel?
It helps Agri Tech businesses track their operational, financial, and sustainability KPIs in a single Excel file for better analysis and faster decision-making.
2 Can this dashboard be customized for different regions or crops?
Yes! You can modify KPI names, groups, and targets easily in the KPI Definition Sheet to align with specific crops, geographies, or business models.
3 Do I need advanced Excel skills to use this dashboard?
No. The dashboard is designed for ease of use with ready-made formulas, drop-downs, and charts that update automatically when data changes.
4 How often should I update the data?
It’s recommended to update MTD and YTD data every month to maintain accuracy and relevance.
5 Can the dashboard track sustainability and ESG metrics?
Absolutely. You can include KPIs like Water Use Efficiency, CO₂ Reduction, and Waste Recycled (%) in your KPI Definition Sheet.
6 Is it possible to automate data entry?
Yes, if your data source supports it. You can connect Excel to databases or IoT platforms through Power Query or APIs for automated updates.
7 What are the benefits of using Excel over Power BI for startups?
Excel is cost-effective, widely available, and requires no specialized training. Startups can later migrate to Power BI as their data complexity grows.
Click to Purchases Agri Tech Startups KPI Dashboard in Excel
Visit our YouTube channel to learn step-by-step video tutorials