Managing an agribusiness involves much more than cultivation and harvesting. Every day, agribusiness owners and managers must track productivity, costs, yields, efficiency, and sustainability metrics. However, when this information stays scattered across notebooks or unstructured spreadsheets, decision-making becomes slow and risky.
That is exactly where an Agribusiness KPI Scorecard in Excel becomes a powerful and practical solution.
This ready-to-use Excel template helps agribusiness professionals monitor key performance indicators (KPIs) in one structured scorecard. As a result, you gain clarity, control, and confidence while managing agricultural operations.
In this detailed guide, you will learn what an Agribusiness KPI Scorecard in Excel is, how it works, why it matters, and how each worksheet supports smarter decision-making. Moreover, you will explore its advantages, best practices, and frequently asked questions. By the end of this article, you will clearly understand how this Excel-based KPI scorecard transforms raw data into actionable insights.
Click to Purchases Agribusiness KPI Scorecard in Excel
What Is an Agribusiness KPI Scorecard in Excel?
An Agribusiness KPI Scorecard in Excel is a structured performance management tool designed to track, analyze, and evaluate key agricultural and agribusiness metrics.
Instead of manually reviewing multiple files or reports, this scorecard consolidates all critical KPIs into a single Excel workbook. Consequently, farm managers, agribusiness owners, and operations teams can monitor performance at a glance.
This KPI scorecard typically tracks:
-
Production efficiency
-
Yield performance
-
Cost control metrics
-
Sustainability indicators
-
Financial and operational KPIs
Since the template is built in Excel, it remains flexible, user-friendly, and easy to customize for different agribusiness models.
Why Do Agribusinesses Need a KPI Scorecard?
Agribusiness operations face constant challenges such as climate variability, rising costs, labor shortages, and market uncertainty. Therefore, relying on intuition alone no longer works.
A KPI scorecard helps agribusinesses:
-
Monitor performance consistently
-
Identify inefficiencies early
-
Compare actual results with targets
-
Track trends over time
-
Support data-driven planning
Moreover, when KPIs are visible and measurable, teams stay aligned and accountable.
What Makes an Agribusiness KPI Scorecard in Excel Effective?
An effective KPI scorecard does more than show numbers. Instead, it explains performance clearly and visually.
This Agribusiness KPI Scorecard in Excel focuses on:
-
Month-to-Date (MTD) analysis
-
Year-to-Date (YTD) performance
-
Target vs Actual comparison
-
Previous Year (PY) benchmarking
-
Visual performance indicators
As a result, users can quickly understand whether performance is improving, declining, or stable.
Click to Purchases Agribusiness KPI Scorecard in Excel
Introduction to the Agribusiness KPI Scorecard in Excel (Paid Template)
The Agribusiness KPI Scorecard in Excel is a ready-to-use, professionally designed Excel template created specifically for agribusiness performance tracking.
This template allows you to:
-
Track KPIs monthly and yearly
-
Compare actual results with targets
-
Visualize performance using indicators
-
Analyze KPI trends over time
-
Maintain clean and structured KPI definitions
Since everything works inside Excel, no additional software or technical skills are required.
Key Features of Agribusiness KPI Scorecard in Excel
Below are the core features that make this scorecard practical, reliable, and easy to use.
📊 Centralized KPI Tracking
Track all agribusiness KPIs in one structured Excel file instead of multiple spreadsheets.
🎯 MTD and YTD Performance Analysis
Evaluate both short-term and long-term performance using Month-to-Date and Year-to-Date metrics.
📈 Trend Analysis for KPIs
Analyze KPI trends over time to identify patterns and performance gaps.
🧮 Actual vs Target Comparison
Clearly compare actual performance against defined targets for each KPI.
🎨 Visual Performance Indicators
Use conditional formatting to instantly identify good, average, or poor performance.
📝 Structured KPI Definitions
Maintain standardized KPI definitions, formulas, and units for clarity and consistency.
Click to Purchases Agribusiness KPI Scorecard in Excel
Worksheets Included in Agribusiness KPI Scorecard in Excel
This template contains four well-structured worksheets, each designed to serve a specific purpose.
1. Scorecard Sheet – The Main KPI Dashboard
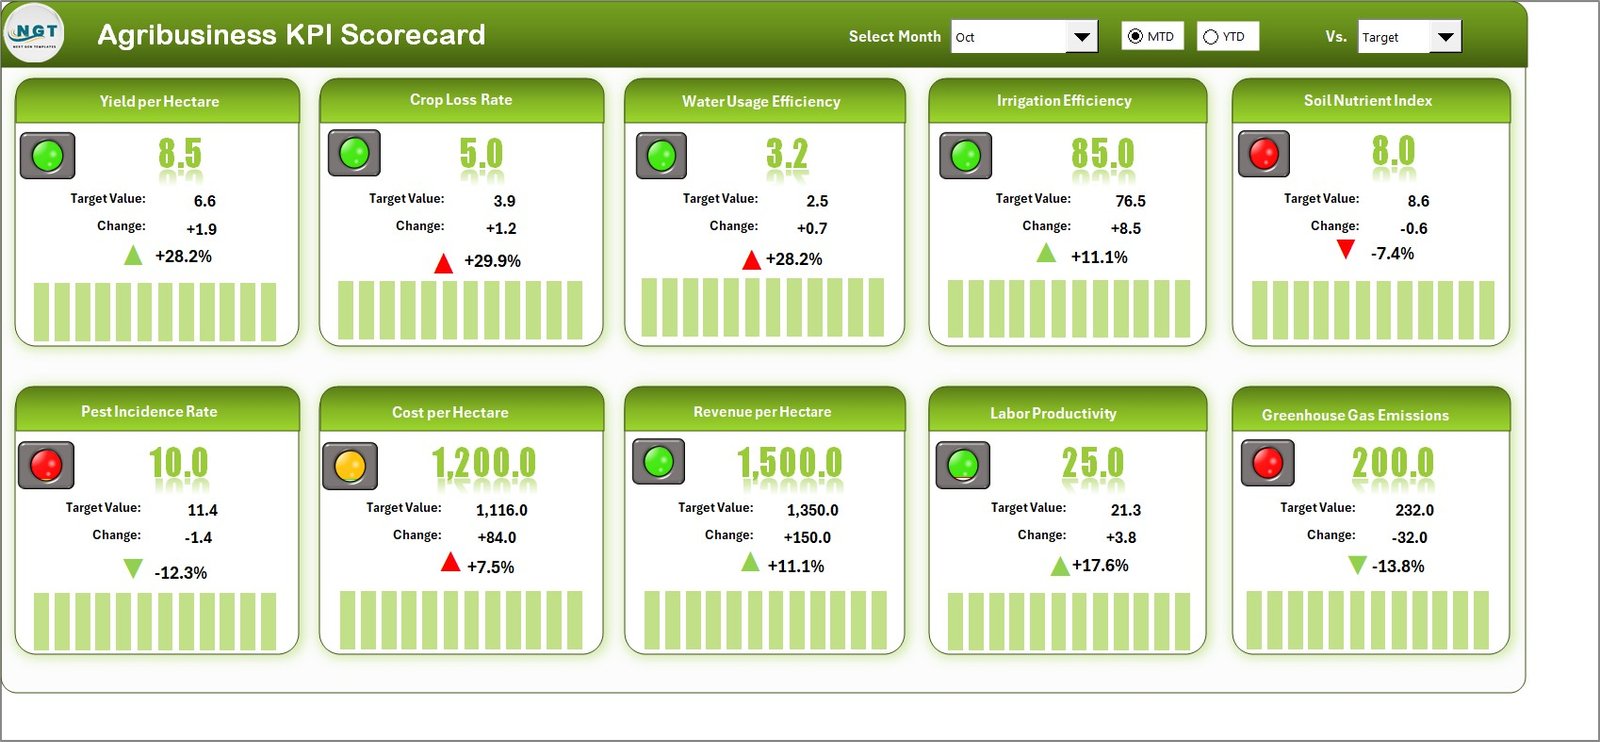
The Scorecard Sheet acts as the central interface of the entire KPI scorecard.
Here, you can view the overall performance of all agribusiness KPIs in one place.
Key Features of the Scorecard Sheet
🔽 Dropdown Menus for Time Selection
You can select:
-
Month
-
MTD (Month-to-Date)
-
YTD (Year-to-Date)
As you change the selection, the entire scorecard updates automatically.
📊 Actual vs Target Values
Each KPI displays:
-
Actual value
-
Target value
-
Variance
This comparison helps you quickly identify performance gaps.
🎨 Visual Indicators Using Conditional Formatting
Color-coded indicators highlight:
-
KPIs meeting or exceeding targets
-
KPIs below expectations
As a result, you can focus instantly on problem areas.
📋 Comprehensive KPI Overview
The scorecard shows:
-
KPI Name
-
KPI Group
-
MTD performance
-
YTD performance
-
Target vs Actual status
Therefore, decision-makers gain a complete performance snapshot.
Click to Purchases Agribusiness KPI Scorecard in Excel
2. KPI Trend Sheet – Deep Dive into Individual KPIs
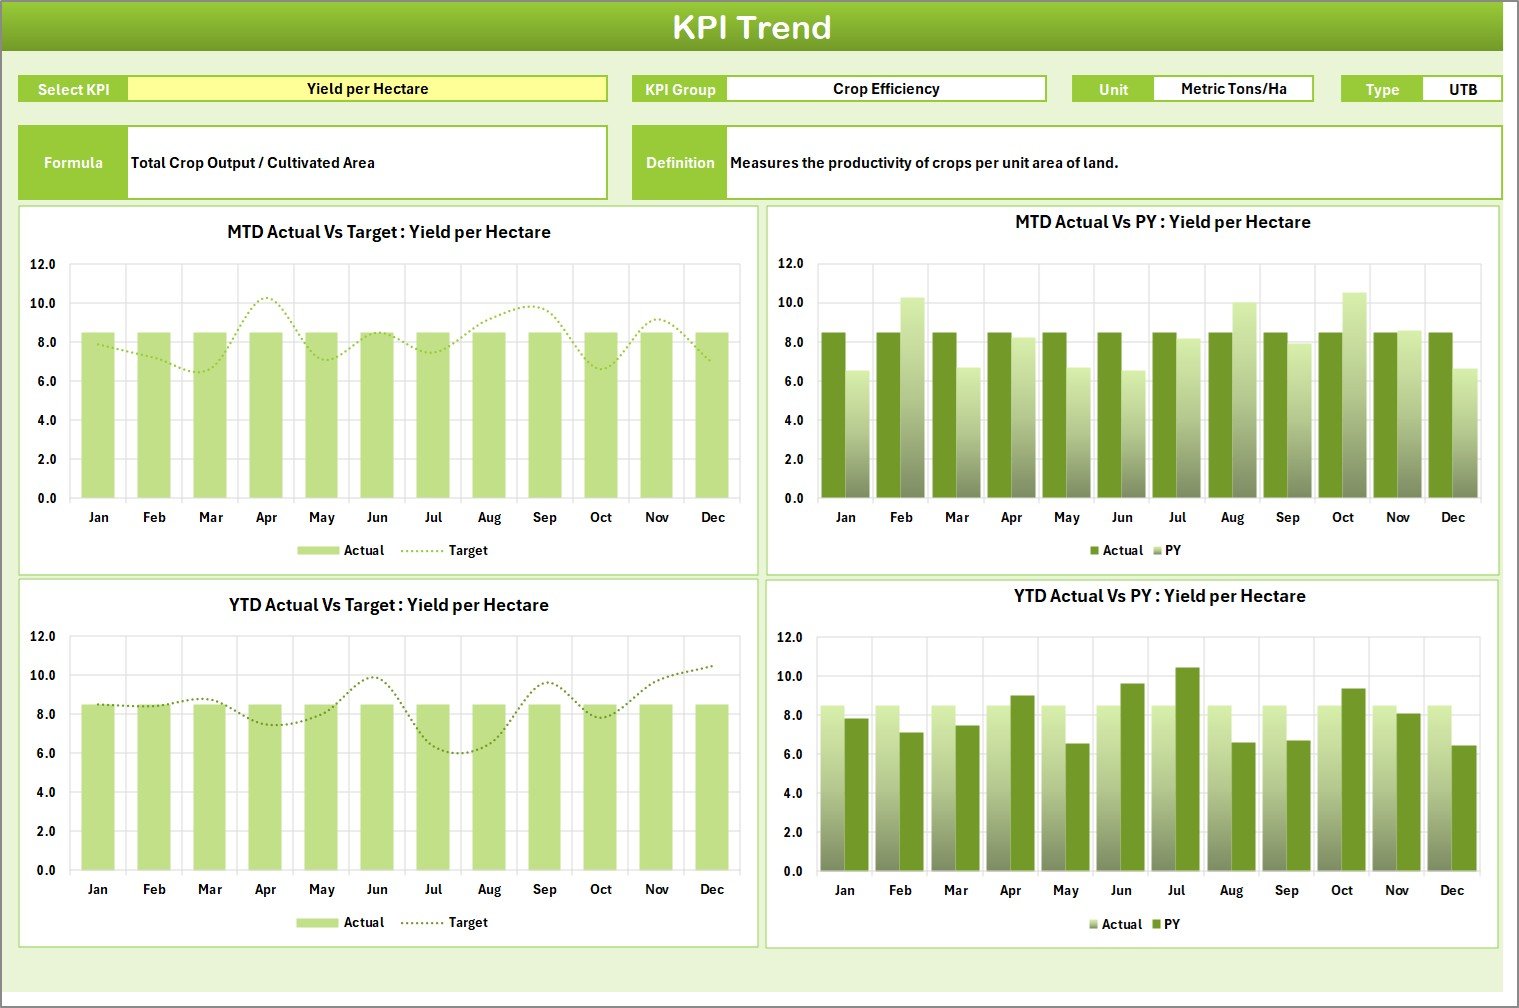
The KPI Trend Sheet helps you analyze one KPI at a time in detail.
How the KPI Trend Sheet Works
🔽 KPI Selection Dropdown
You can select the KPI name from a dropdown available in cell C3. Once selected, all related information updates automatically.
📌 KPI Details Display
The sheet shows:
-
KPI Group
-
KPI Unit
-
KPI Type (Lower the Better or Upper the Better)
-
KPI Formula
-
KPI Definition
This ensures clarity and consistency across all users.
📈 MTD and YTD Trend Charts
The trend charts display:
-
Actual values
-
Target values
-
Previous Year (PY) values
As a result, you can analyze performance movement over time.
3. Input Data Sheet – Simple and Flexible Data Entry
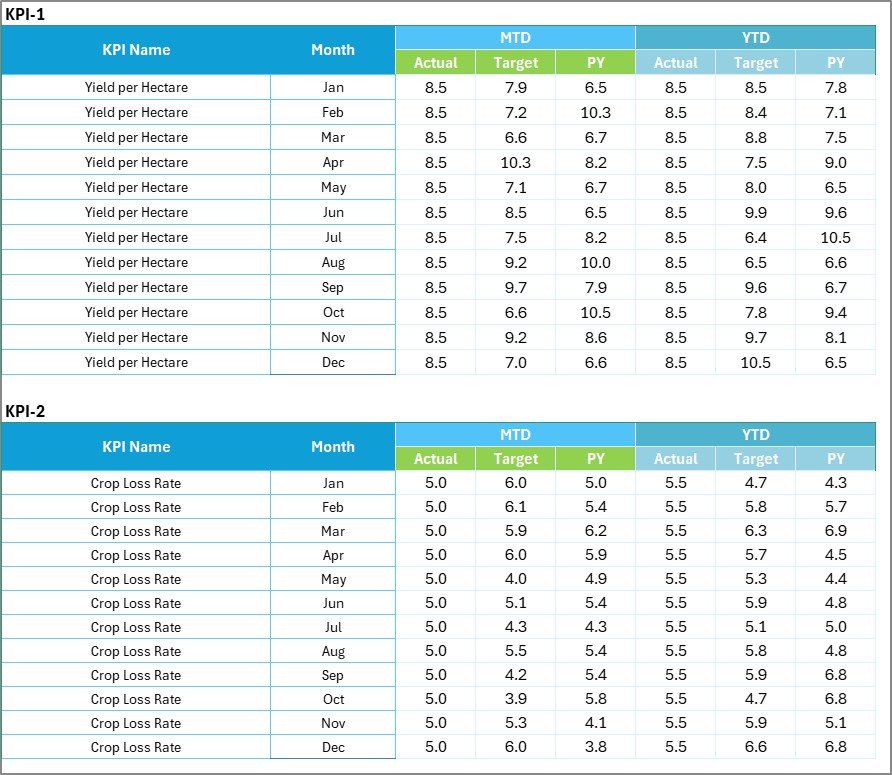
The Input Data Sheet is where all KPI data gets recorded.
Key Highlights of the Input Data Sheet
🧾 Easy Data Entry
You can enter:
-
Actual KPI values
-
Target values
-
Monthly data
No complex formulas are required during data entry.
🔄 Flexible Updates
As new results become available, you can update the data easily. Consequently, the scorecard always stays current.
🧩 Structured Format
The structured layout reduces errors and ensures data consistency across periods.
Click to Purchases Agribusiness KPI Scorecard in Excel
4. KPI Definition Sheet – Standardize KPI Knowledge
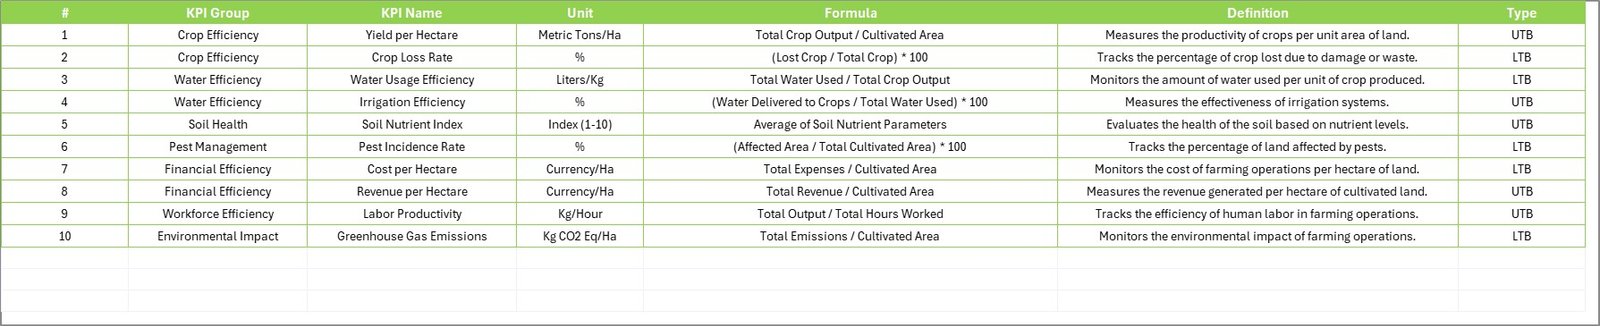
The KPI Definition Sheet ensures that every KPI remains clearly defined and standardized.
Information Captured in KPI Definition Sheet
You can record:
-
KPI Name
-
KPI Group
-
Unit of Measurement
-
KPI Formula
-
KPI Definition
This sheet becomes a single source of truth for all KPI-related information.
How Does Agribusiness KPI Scorecard in Excel Improve Decision-Making?
Since the scorecard combines performance data, trends, and visuals, it supports faster and better decisions.
-
Managers identify underperforming areas early
-
Teams align around measurable goals
-
Leadership tracks progress against strategy
-
Operational risks reduce significantly
Therefore, decisions become proactive instead of reactive.
Advantages of Agribusiness KPI Scorecard in Excel
Using this KPI scorecard offers several important benefits.
✅ Centralized Performance Visibility
All KPIs remain visible in one dashboard.
✅ Improved Accountability
Clear targets and actuals increase ownership.
✅ Time-Saving Reporting
Automated calculations eliminate manual reporting.
✅ Data-Driven Planning
Trends support forecasting and planning.
✅ Excel-Based Simplicity
No need for advanced BI tools or coding.
Best Practices for Using Agribusiness KPI Scorecard in Excel
To get maximum value from this scorecard, follow these best practices.
📌 Define Clear KPIs
Select KPIs that directly align with agribusiness goals.
📌 Update Data Regularly
Maintain discipline while updating monthly data.
📌 Set Realistic Targets
Use historical data to define achievable targets.
📌 Review Trends, Not Just Numbers
Focus on trends rather than single-month performance.
📌 Train Team Members
Ensure all users understand KPI definitions and logic.
Click to Purchases Agribusiness KPI Scorecard in Excel
Who Can Use Agribusiness KPI Scorecard in Excel?
This template suits a wide range of users, including:
-
Farm owners
-
Agribusiness managers
-
Agricultural consultants
-
Operations teams
-
Finance and planning teams
Because it is Excel-based, anyone with basic Excel knowledge can use it.
Conclusion
The Agribusiness KPI Scorecard in Excel is a practical, powerful, and easy-to-use solution for tracking agribusiness performance.
Instead of managing scattered data and unclear reports, this ready-to-use Excel template brings structure, visibility, and clarity to KPI management. By using MTD and YTD analysis, trend tracking, and visual indicators, agribusiness leaders gain actionable insights that support better decisions.
If you want to move from guesswork to data-driven agribusiness management, this KPI scorecard is the right tool.
Frequently Asked Questions (FAQs)
❓ What is an Agribusiness KPI Scorecard in Excel used for?
It helps track, analyze, and evaluate agribusiness performance using structured KPIs.
❓ Do I need advanced Excel skills to use this scorecard?
No, basic Excel knowledge is enough to use and update this template.
❓ Can I customize KPIs in this scorecard?
Yes, you can easily modify KPI names, groups, targets, and definitions.
❓ Does the scorecard support MTD and YTD analysis?
Yes, it supports both Month-to-Date and Year-to-Date performance tracking.
❓ Can I add new KPIs in the future?
Yes, the template is flexible and allows you to add new KPIs easily.
Click to Purchases Agribusiness KPI Scorecard in Excel
Visit our YouTube channel to learn step-by-step video tutorials