Modern agriculture relies heavily on advanced machinery and equipment. Farmers, agribusiness companies, and equipment manufacturers continuously produce tractors, harvesters, seeders, irrigation systems, and other essential machines. However, managing agricultural equipment production involves multiple departments, production lines, shifts, costs, quality checks, and order timelines.
Therefore, companies must monitor production performance carefully. When businesses rely only on scattered spreadsheets and manual reports, they often struggle to track production efficiency, equipment output, production costs, and delayed orders.
As a result, many manufacturing companies now use data-driven dashboards to monitor their operations.
One of the most powerful tools for this purpose is the Agricultural Equipment Production Dashboard in Power BI.The Agricultural Equipment Production Dashboard in Power BI helps manufacturers monitor production output, analyze equipment performance, track quality issues, manage production costs, and evaluate revenue trends. Moreover, the dashboard converts raw production data into interactive charts, KPI cards, and dynamic reports.
Because Power BI offers advanced data visualization and real-time analytics, production managers can easily identify operational bottlenecks, improve efficiency, and make faster business decisions.
In this article, we will explore everything about the Agricultural Equipment Production Dashboard in Power BI, including its structure, key features, advantages, best practices, and frequently asked questions.
What is an Agricultural Equipment Production Dashboard in Power BI?
An Agricultural Equipment Production Dashboard in Power BI is a business intelligence tool that helps manufacturing companies monitor and analyze production performance related to agricultural machinery.
Manufacturers produce different types of equipment such as:
- Tractors
- Harvesters
- Seed drills
- Plough machines
- Irrigation equipment
- Crop sprayers
- Soil preparation machinery
Since production operations include several departments, production lines, and quality checkpoints, companies must track important metrics.
For example, manufacturers monitor:
- Total units produced
- Production cost
- Revenue generated
- Production efficiency
- Defective units
- Delayed orders
- Completed orders
Therefore, a Power BI dashboard transforms these metrics into visual insights that help decision-makers improve operational performance.
Why Do Agricultural Equipment Manufacturers Need Production Dashboards?
Agricultural equipment manufacturing involves complex operations. Companies must coordinate raw materials, workforce, machines, logistics, and customer orders.
However, many manufacturers still rely on manual reporting systems.
Consequently, managers face challenges such as:
- Difficulty tracking production performance
- Lack of real-time insights
- Delays in identifying production issues
- Poor monitoring of production costs
- Inefficient order tracking
Therefore, a Power BI production dashboard solves these problems by presenting real-time analytics in a visual format.
Moreover, dashboards allow managers to track performance across multiple departments, production lines, and time periods.
As a result, organizations can improve production planning, reduce delays, and increase profitability.
Key Features of the Agricultural Equipment Production Dashboard in Power BI
The Agricultural Equipment Production Dashboard in Power BI contains five interactive pages designed to analyze production performance from different perspectives.
Each page focuses on specific operational insights.
These pages include:
- Overview Page
- Production Performance
- Quality Analysis
- Cost & Revenue Analysis
- Month Analysis
Let us explore each page in detail.
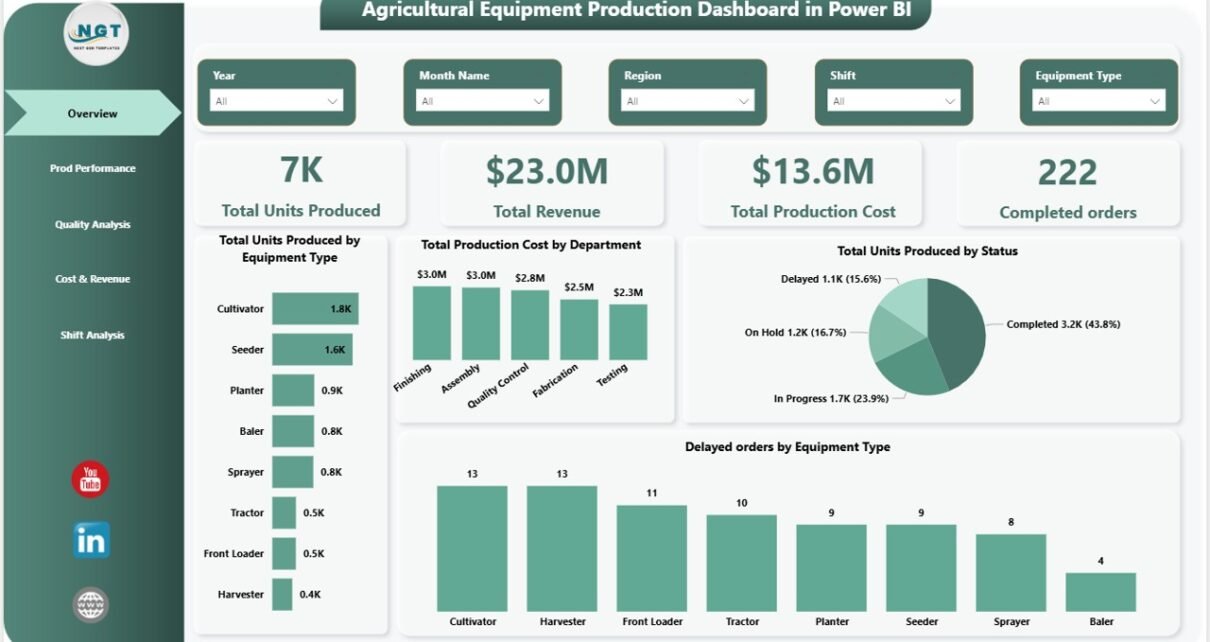
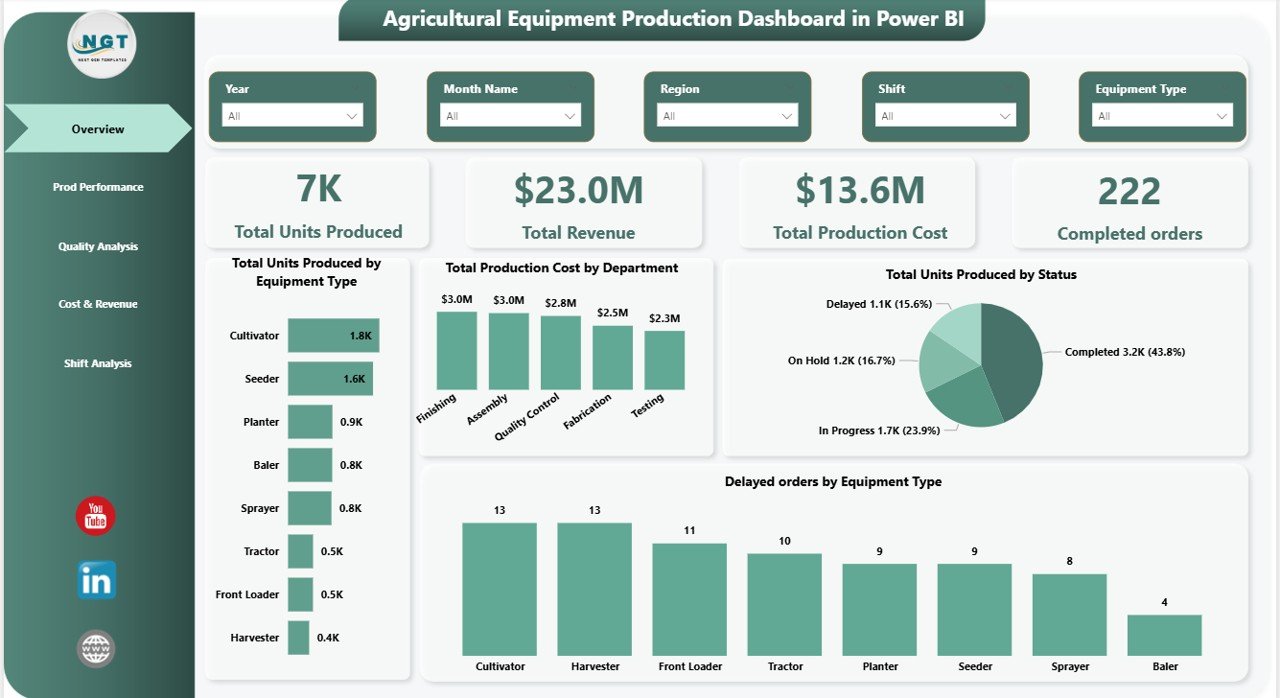
Overview Page – What Insights Does the Main Dashboard Provide?
The Overview Page serves as the central monitoring panel of the dashboard.
Managers can quickly understand overall production performance from this page.
The page includes interactive slicers, which allow users to filter data by specific parameters.
KPI Cards on the Overview Page
The dashboard displays five important KPI cards:
- Total Units Produced – Shows the overall production output.
- Total Revenue – Displays the revenue generated from equipment sales.
- Total Production Cost – Shows total operational expenses.
- Completed Orders – Indicates the number of successfully delivered orders.
- Production Efficiency Indicators – Helps monitor operational performance.
These KPI cards allow managers to quickly evaluate whether production operations meet business targets.
Charts Available on the Overview Page
The page also includes four interactive charts:
Total Units Produced by Equipment Type
This chart shows how many units the company produced for each equipment category.
For example:
- Tractors
- Harvesters
- Irrigation machines
- Seeders
Therefore, managers can identify which equipment contributes most to production output.
Total Production Cost by Department
This chart analyzes production expenses across departments such as:
- Assembly
- Fabrication
- Quality Control
- Packaging
- Logistics
As a result, management can identify cost-heavy departments and improve operational efficiency.
Total Units Produced by Status
Production units usually fall into categories such as:
- Completed
- In Progress
- Delayed
- Pending
This chart helps managers track production status in real time.
Delayed Orders by Equipment Type
This visual highlights equipment categories with delayed orders.
Therefore, production teams can quickly identify bottlenecks and take corrective action.
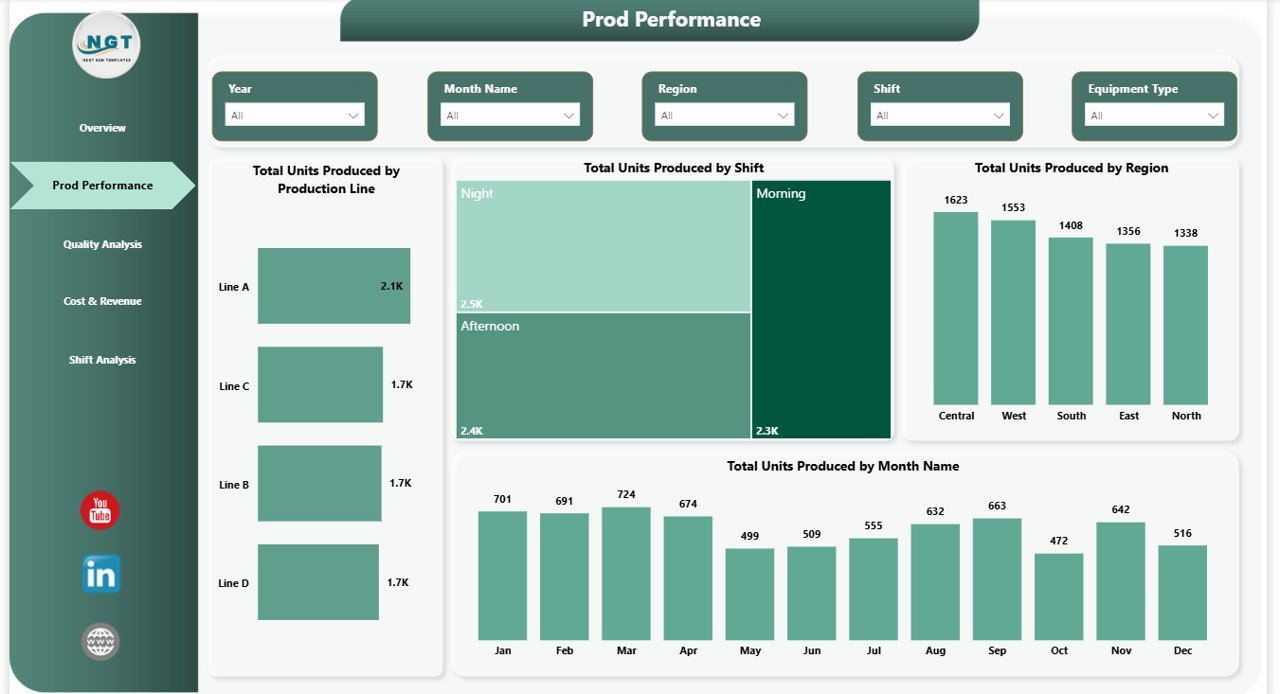
Prod Performance Page – How Does It Measure Production Efficiency?
The Production Performance Page focuses on detailed production output analysis.
This page helps managers evaluate performance across production lines, shifts, and regions.
It includes the following charts.
Total Units Produced by Production Line
Manufacturing plants often operate multiple production lines.
This chart shows the production output of each line.
Consequently, managers can identify:
- High-performing lines
- Low-performing lines
- Equipment bottlenecks
As a result, companies can improve resource allocation.
Total Units Produced by Shift
Factories usually operate in different shifts such as:
- Morning Shift
- Afternoon Shift
- Night Shift
This chart helps analyze productivity levels across shifts.
Therefore, managers can identify workforce performance trends.
Total Units Produced by Region
Agricultural equipment manufacturers often operate across multiple regions.
This chart shows production distribution across different manufacturing locations.
Thus, management can compare regional production efficiency.
Total Units Produced by Month
Seasonal demand affects agricultural equipment production.
Therefore, this chart tracks monthly production trends.
Managers can use these insights to plan production schedules effectively.
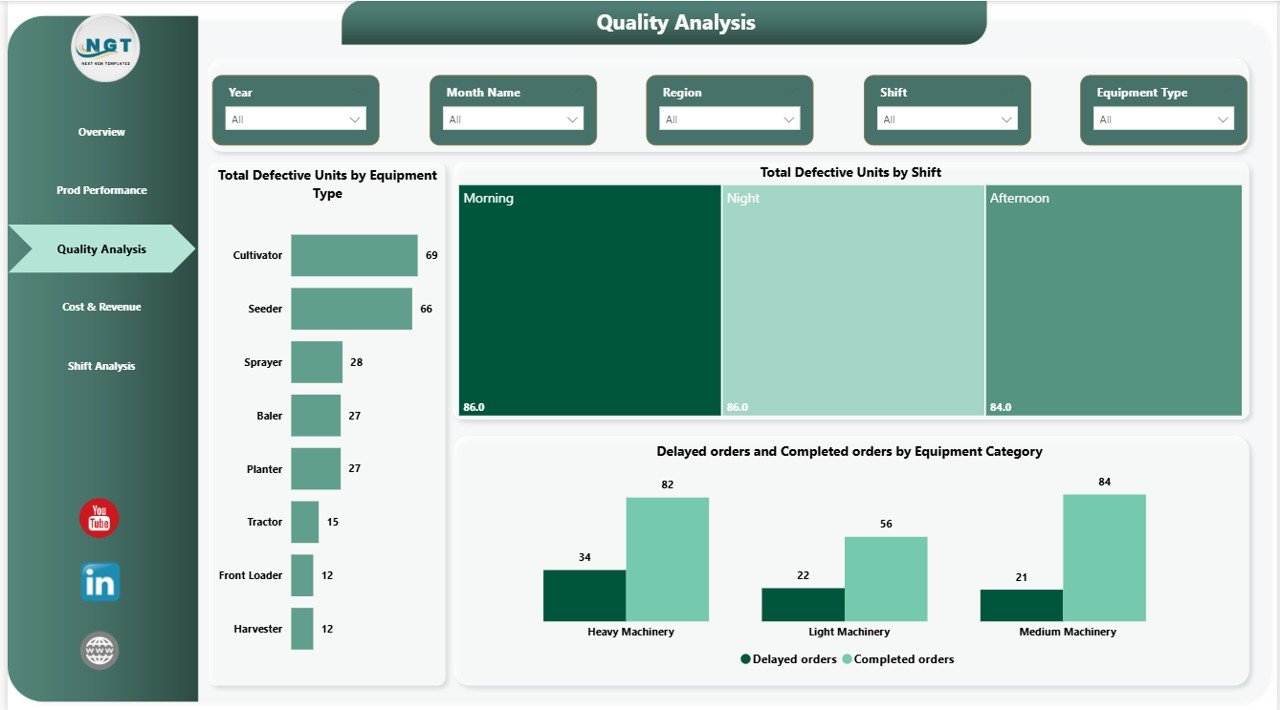
Quality Analysis Page – How Does the Dashboard Track Product Quality?
Quality plays a critical role in agricultural equipment manufacturing.
If manufacturers produce defective machinery, farmers may face equipment failure during important farming seasons.
Therefore, the Quality Analysis Page helps monitor product quality.
This page includes interactive slicers and visual reports.
Total Defective Units by Equipment
This chart shows which equipment types have the highest number of defects.
For example:
- Tractor engine defects
- Harvester blade issues
- Sprayer pump failures
Consequently, quality control teams can identify manufacturing problems.
Total Defective Units by Shift
Sometimes defects occur more frequently during specific production shifts.
This chart identifies shifts with higher defect rates.
As a result, managers can investigate training or operational issues.
Delayed Orders vs Completed Orders by Equipment Type
This chart compares delayed orders with completed orders.
Therefore, managers can determine which equipment types face production delays.
Moreover, companies can improve supply chain coordination.
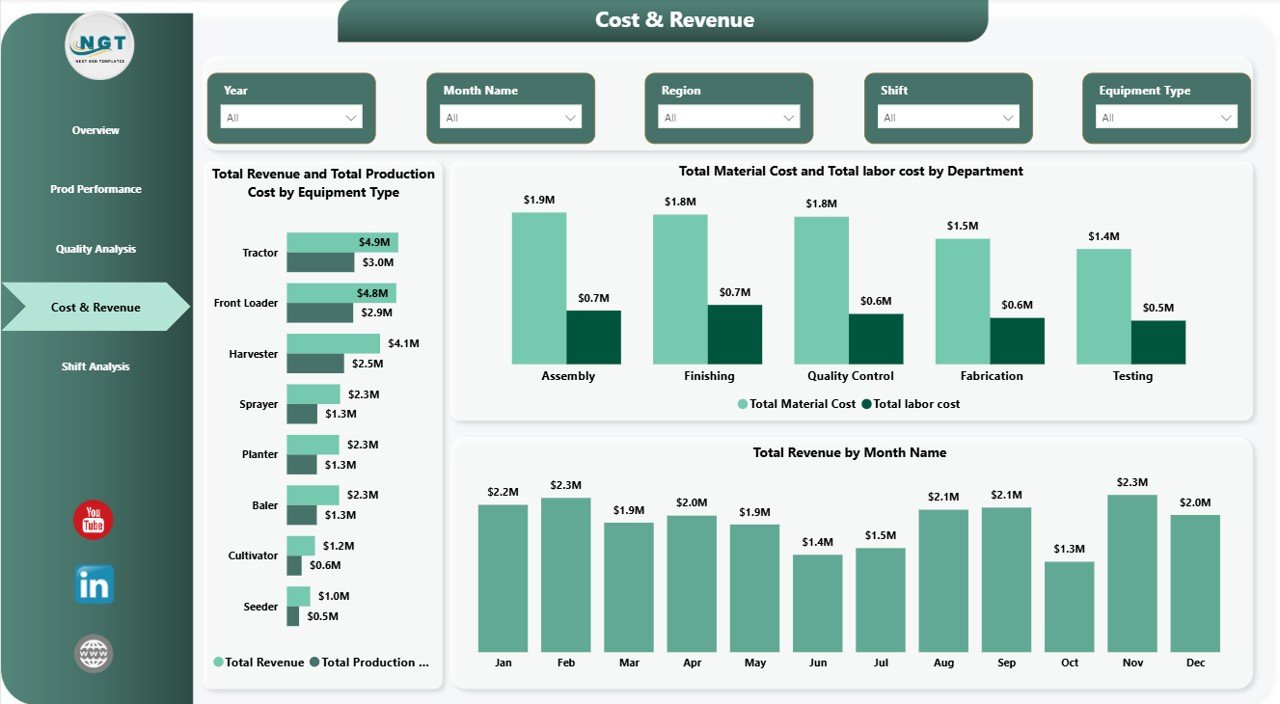
Cost & Revenue Analysis – How Does the Dashboard Track Financial Performance?
Financial performance plays an important role in manufacturing operations.
Therefore, the Cost & Revenue Analysis Page focuses on financial insights.
This page helps management monitor costs and profitability.
Total Revenue and Total Production Cost by Equipment Type
This chart compares revenue with production costs.
Thus, companies can determine which equipment categories generate the highest profit margins.
Total Material Cost and Total Labor Cost by Department
Production costs typically include:
- Raw materials
- Labor costs
- Machine operations
- Energy consumption
This chart helps companies identify cost drivers.
Therefore, management can control operational expenses.
Total Revenue by Month
Agricultural equipment demand fluctuates throughout the year.
This chart tracks monthly revenue trends.
Consequently, companies can analyze seasonal sales performance.
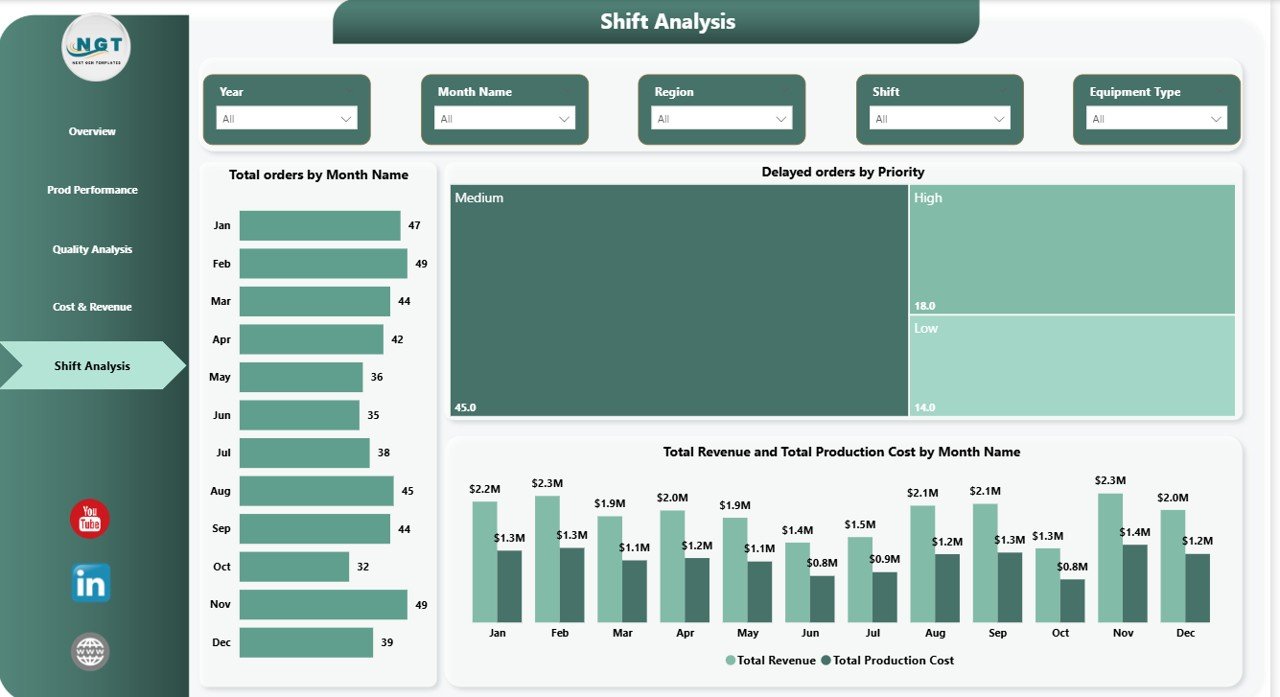
Shift Analysis Page – How Does It Track Monthly Production Trends?
The Shift Analysis Page provides a deeper view of monthly production performance.
It allows managers to analyze order trends, revenue growth, and production costs.
Total Orders by Month
This chart shows the total number of orders received each month.
Therefore, companies can evaluate demand patterns.
Delayed Orders by Priority
Orders may have different priority levels such as:
- High priority
- Medium priority
- Low priority
This chart highlights delayed orders based on priority.
Thus, companies can focus on urgent production tasks.
Total Revenue and Production Cost by Month
This chart compares monthly revenue with production expenses.
Therefore, management can analyze profitability trends.
Advantages of the Agricultural Equipment Production Dashboard in Power BI
Organizations gain many benefits when they implement this dashboard.
- Real-Time Production Monitoring
Power BI allows companies to monitor production data in real time.
Therefore, managers can detect issues quickly.
- Improved Decision-Making
The dashboard converts raw data into visual insights.
Consequently, leaders can make faster and better decisions.
- Better Cost Control
Managers can monitor labor costs, material expenses, and production costs.
Therefore, companies can improve financial efficiency.
- Enhanced Production Efficiency
The dashboard highlights performance across production lines and shifts.
Thus, managers can improve operational productivity.
- Improved Quality Control
Quality analysis helps companies detect defects early.
As a result, manufacturers can reduce equipment failure risks.
- Better Order Management
The dashboard tracks completed and delayed orders.
Therefore, companies can improve delivery timelines.
Best Practices for the Agricultural Equipment Production Dashboard in Power BI
Organizations should follow certain best practices when implementing this dashboard.
Maintain Accurate Data Sources
Always ensure that production data remains accurate and updated.
Clean and structured data improves dashboard performance.
Standardize KPI Definitions
Define KPIs clearly.
For example:
- Units Produced
- Defect Rate
- Production Cost
- Revenue
Consistency improves reporting reliability.
Update Data Regularly
Regular data updates ensure accurate reporting.
Automated data refresh improves efficiency.
Train Production Teams
Employees must understand how to use dashboards.
Training improves adoption and data usage.
Monitor Key Production Metrics
Focus on the most important production metrics.
Avoid overcrowding the dashboard with unnecessary visuals.
Conclusion
Agricultural equipment manufacturing requires efficient production monitoring, quality control, cost management, and order tracking.
However, manual reporting methods often fail to provide accurate insights.
Therefore, companies increasingly adopt Power BI dashboards to analyze production performance.
The Agricultural Equipment Production Dashboard in Power BI provides a comprehensive solution for monitoring production output, tracking costs, analyzing quality, and evaluating financial performance.
Moreover, the dashboard transforms complex manufacturing data into clear visual insights.
As a result, production managers, executives, and operations teams can make better business decisions.
Ultimately, organizations that adopt data-driven production dashboards gain improved efficiency, reduced operational costs, and stronger profitability.
Frequently Asked Questions (FAQs)
What is the purpose of an Agricultural Equipment Production Dashboard?
The dashboard helps manufacturers monitor production performance, track costs, analyze quality issues, and evaluate revenue trends.
Why should manufacturers use Power BI for production dashboards?
Power BI offers advanced data visualization, interactive charts, and real-time analytics. Therefore, companies can easily analyze production data.
What KPIs should agricultural equipment manufacturers track?
Important KPIs include:
- Total units produced
- Production cost
- Revenue generated
- Defective units
- Completed orders
- Delayed orders
Can Power BI dashboards integrate with Excel data?
Yes. Power BI easily integrates with Excel, databases, and other business systems.
Therefore, companies can automatically update dashboard data.
Who should use the Agricultural Equipment Production Dashboard?
This dashboard benefits:
- Manufacturing managers
- Production supervisors
- Operations teams
- Financial analysts
- Business executives
All these stakeholders can use the dashboard to monitor production performance and make better strategic decisions.
Visit our YouTube channel to learn step-by-step video tutorials