Agricultural machinery plays a crucial role in modern farming. Tractors, harvesters, seeders, irrigation machines, and other farming equipment help farmers increase productivity and efficiency. However, managing machinery sales, service costs, maintenance records, warranty claims, and regional performance can quickly become complex.
Many agricultural equipment companies manage hundreds or even thousands of machinery transactions every month. They deal with multiple dealers, different customer types, service centers, and regional markets. If organizations rely only on traditional spreadsheets or scattered reports, they often struggle to analyze performance and make quick decisions.
Therefore, businesses need a smart analytical system that converts raw operational data into clear insights. This is exactly where the Agricultural Machinery Dashboard in Power BI becomes extremely valuable.
Click to Purchases Agricultural Machinery Dashboard in Power BI
The Agricultural Machinery Dashboard in Power BI is a powerful analytics solution that helps machinery manufacturers, distributors, and service managers monitor sales performance, track service costs, analyze customer trends, and evaluate regional demand using interactive data visualization.
Because Power BI provides powerful visualization tools, slicers, filters, and interactive charts, businesses can easily explore complex machinery data and identify important trends that support better decision-making.
In this detailed guide, we will explore everything about the Agricultural Machinery Dashboard in Power BI, including its features, dashboard structure, advantages, best practices, and how agricultural equipment businesses can use it to improve operational efficiency.
What is an Agricultural Machinery Dashboard in Power BI?
An Agricultural Machinery Dashboard in Power BI is an interactive data visualization tool designed to monitor machinery sales, service operations, warranty claims, and dealer performance.
Instead of reviewing multiple spreadsheets or manual reports, managers can access all important machinery performance indicators in one centralized dashboard.
This dashboard transforms raw data into meaningful visual insights such as:
-
Machinery sales performance
-
Service cost trends
-
Warranty claim analysis
-
Dealer performance monitoring
-
Customer type analysis
-
Regional machinery demand
-
Monthly sales trends
As a result, decision-makers quickly understand business performance and take faster strategic actions.
Moreover, Power BI dashboards allow users to filter data using slicers, making it easy to analyze specific machinery types, regions, dealers, or customer categories.
Why Do Agricultural Equipment Companies Need a Dashboard?
Agricultural equipment companies operate in a highly competitive and seasonal market. Machinery demand changes based on farming cycles, weather conditions, crop production, and regional farming practices.
However, many organizations face several operational challenges.
For example:
-
Tracking machinery sales across multiple regions
-
Monitoring dealer performance
-
Evaluating service and maintenance costs
-
Analyzing customer purchasing patterns
-
Monitoring warranty claims by machinery model
-
Measuring machinery downtime
-
Identifying high-performing product categories
Without a structured reporting system, companies cannot easily analyze these metrics.
Therefore, the Agricultural Machinery Dashboard in Power BI helps organizations solve these challenges by providing real-time analytics and interactive reporting.
Key Features of the Agricultural Machinery Dashboard in Power BI
Click to Purchases Agricultural Machinery Dashboard in Power BI
This dashboard contains five analytical pages, each designed to provide insights into different aspects of agricultural machinery performance.
Each page includes interactive slicers, allowing users to filter data instantly and analyze different scenarios.
Let us explore the dashboard structure in detail.
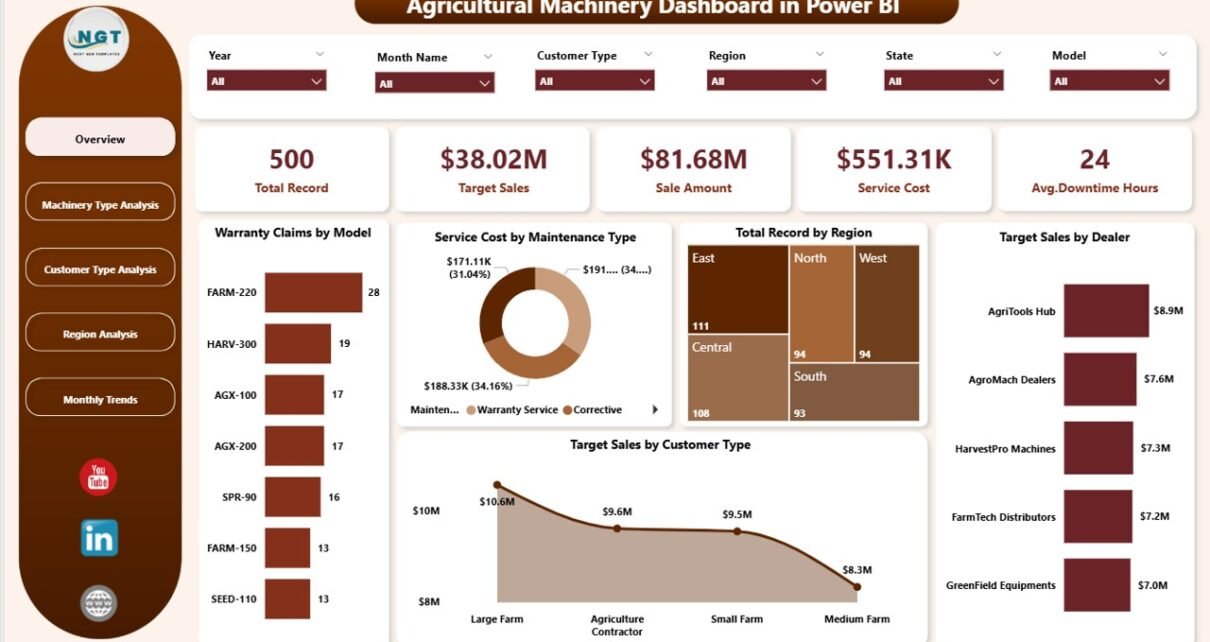
Overview Page: Complete Machinery Performance Snapshot
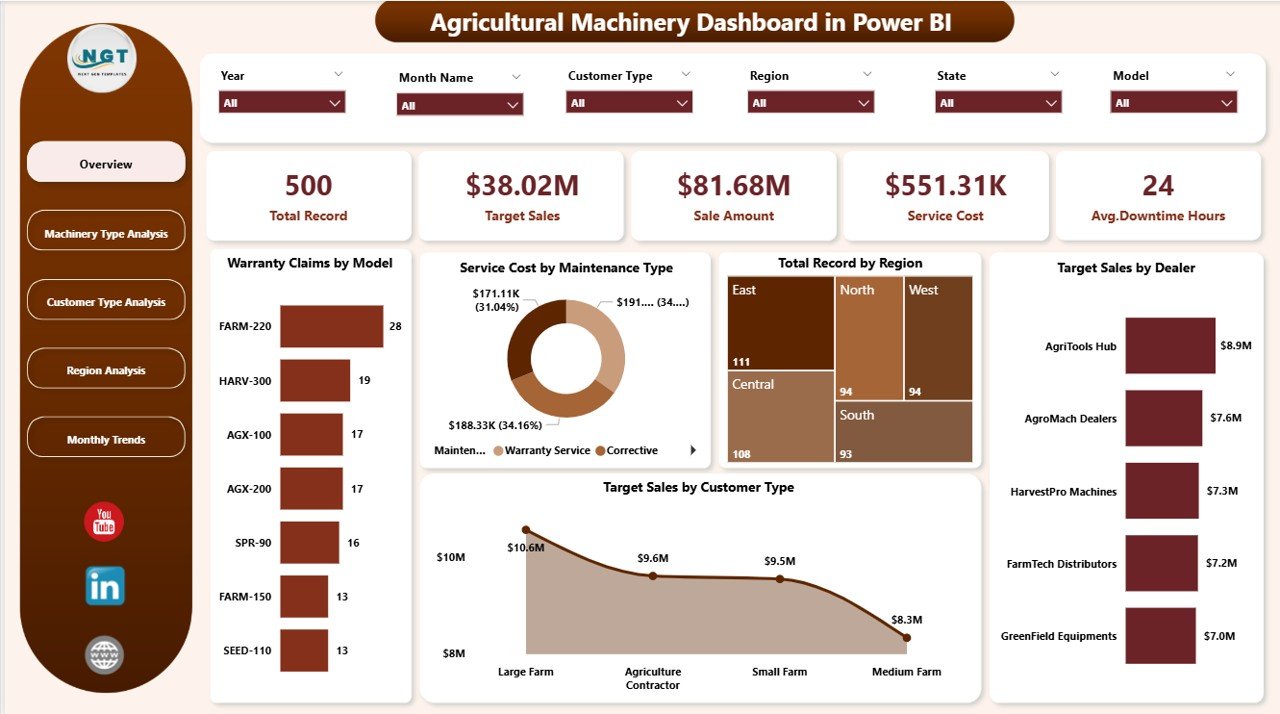
The Overview Page acts as the central monitoring screen of the dashboard. It provides a quick summary of the most important business metrics.
This page includes interactive slicers, which allow users to filter the dashboard based on different parameters such as region, machinery type, customer category, or dealer.
KPI Cards in the Overview Page
The page displays five important KPI cards:
-
Warranty Claims by Model
-
Service by Maintenance Type
-
Total Record by Region
-
Target Sales by Dealer
-
Target Sales by Customer Type
These KPI indicators help managers instantly evaluate business performance.
Why the Overview Page is Important
The Overview Page helps managers quickly answer important questions such as:
-
Which machinery models generate the highest warranty claims?
-
Which regions generate the most machinery transactions?
-
Which dealers achieve their sales targets?
-
Which customer segments drive machinery demand?
Because this information appears on one screen, managers quickly identify trends and performance issues.
Machinery Type Analysis: Understanding Product Performance
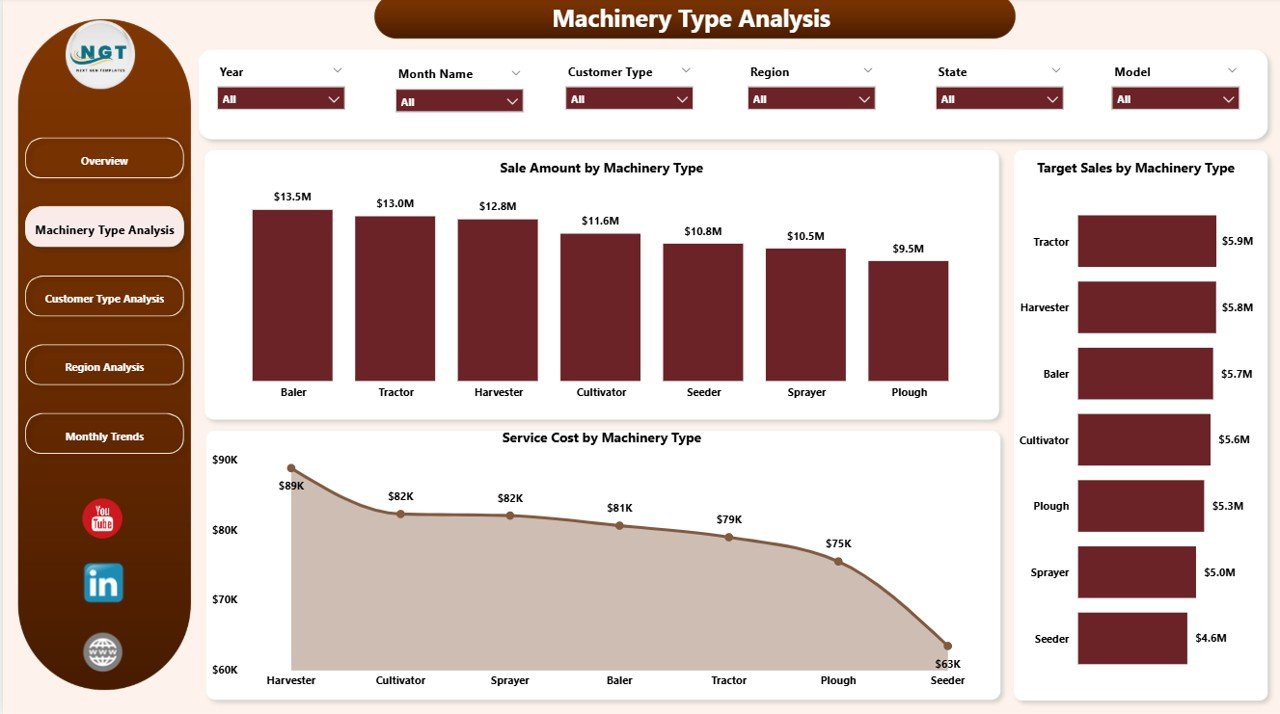
Agricultural equipment companies sell multiple types of machinery such as tractors, ploughs, harvesters, irrigation machines, and seeders.
However, each machinery type performs differently in the market.
The Machinery Type Analysis Page helps businesses analyze how each machinery category performs.
This page contains the following charts:
-
Sales Amount by Machinery Type
-
Target Sales by Machinery Type
-
Service Cost by Machinery Type
What Insights Does This Page Provide?
This page helps managers answer key questions such as:
-
Which machinery category generates the highest revenue?
-
Which machinery types struggle to achieve target sales?
-
Which machinery types require the highest maintenance costs?
As a result, companies can adjust product strategies and improve machinery performance.
Customer Type Analysis: Understanding Customer Segments
Click to Purchases Agricultural Machinery Dashboard in Power BI
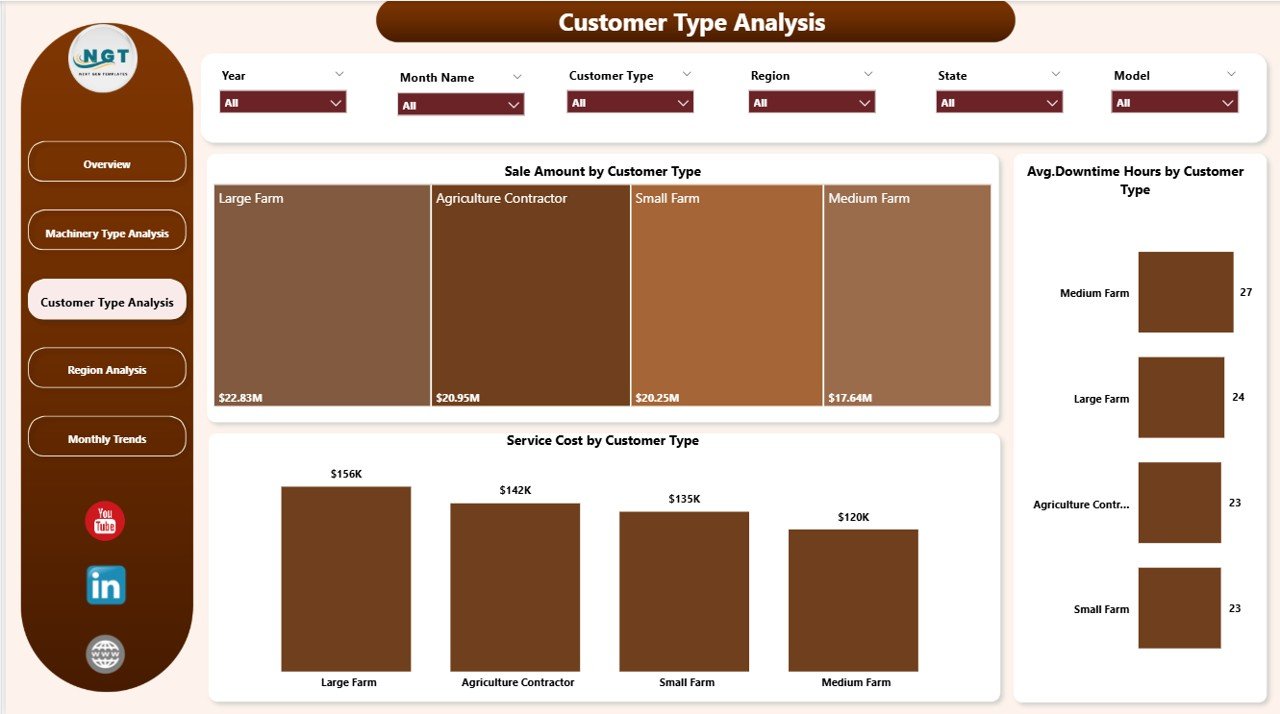
Agricultural machinery companies sell products to different types of customers.
For example:
-
Individual farmers
-
Agricultural cooperatives
-
Farming corporations
-
Government agricultural programs
-
Equipment rental companies
Each customer group behaves differently.
Therefore, the Customer Type Analysis Page helps businesses analyze customer behavior and sales performance.
Charts Included in this Page
This page includes three important charts:
-
Sales Amount by Customer Type
-
Average Downtime Hours by Customer Type
-
Service Cost by Customer Type
Benefits of Customer Analysis
Customer insights help businesses:
-
Identify high-value customer segments
-
Improve after-sales service
-
Reduce machinery downtime
-
Design targeted marketing campaigns
Moreover, businesses can customize sales strategies based on customer needs.
Region Analysis: Monitoring Regional Machinery Demand
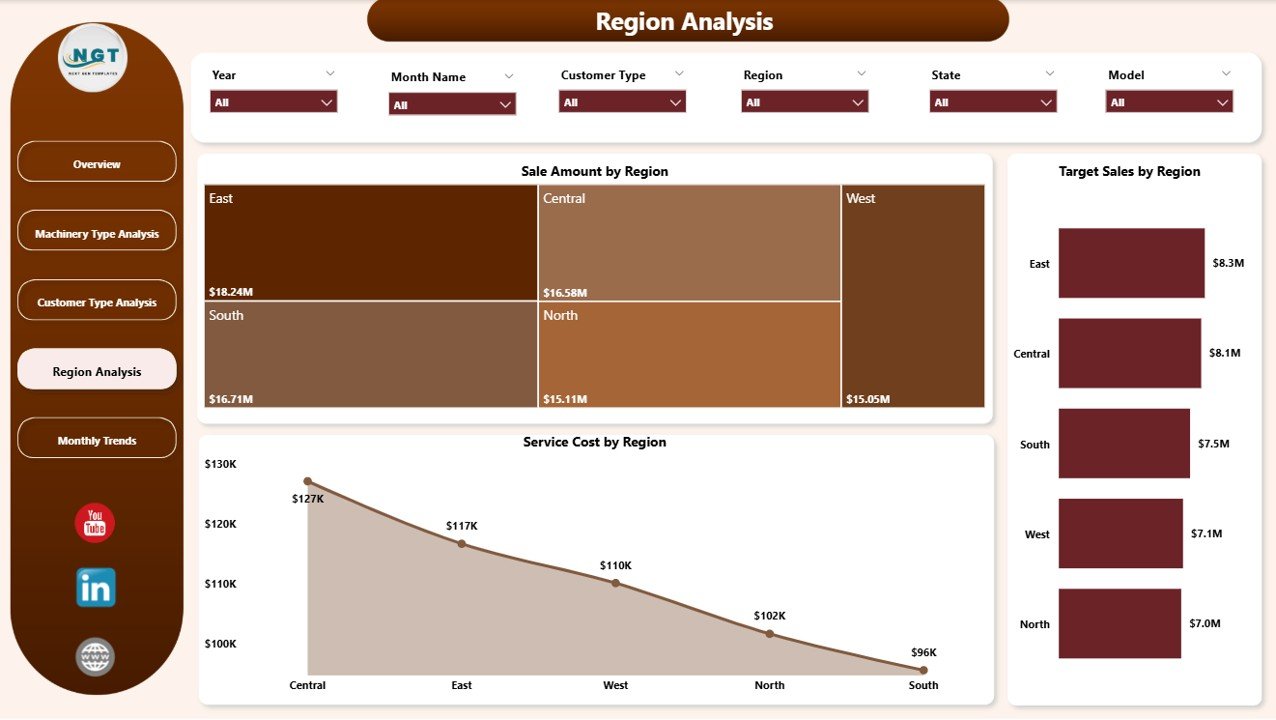
Agricultural machinery demand varies significantly across regions.
Different regions grow different crops and require different machinery types. Climate conditions and farming practices also influence machinery usage.
Therefore, the Region Analysis Page helps companies evaluate regional machinery performance.
Charts in the Region Analysis Page
The page includes three charts:
-
Sales Amount by Region
-
Target Sales by Region
-
Service Cost by Region
Why Regional Analysis Matters
Regional insights help organizations:
-
Identify high-demand farming regions
-
Evaluate dealer performance in each region
-
Monitor regional service costs
-
Improve machinery distribution strategies
As a result, businesses can expand operations in profitable regions.
Month Analysis: Tracking Seasonal Machinery Trends
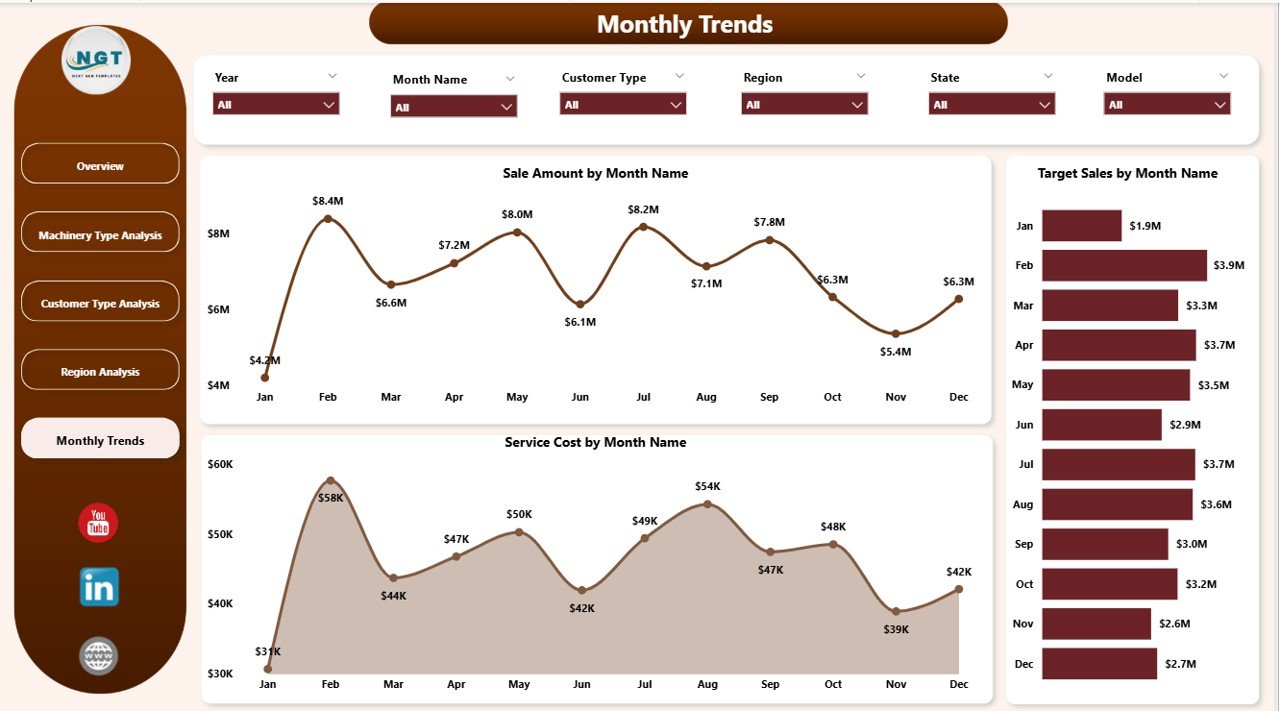
Agricultural machinery sales often follow seasonal patterns.
For example:
-
Farmers purchase tractors before planting seasons.
-
Harvesters become popular during harvesting periods.
-
Irrigation systems sell more during dry seasons.
Therefore, the Month Analysis Page helps businesses understand seasonal demand.
Charts in the Month Analysis Page
The page includes the following charts:
-
Sales Amount by Month
-
Target Sales by Month
-
Service Cost by Month
Why Monthly Analysis is Important
Monthly insights help businesses:
-
Predict future machinery demand
-
Adjust inventory planning
-
Optimize sales strategies
-
Plan maintenance resources
Consequently, organizations improve operational planning.
Advantages of the Agricultural Machinery Dashboard in Power BI
The Agricultural Machinery Dashboard offers several important benefits for equipment manufacturers and distributors.
1. Centralized Data Management
The dashboard combines multiple data sources into one centralized reporting system. As a result, managers easily access all important information in one place.
2. Faster Decision-Making
Because the dashboard provides real-time visual insights, decision-makers quickly identify trends and take immediate action.
3. Improved Sales Monitoring
The dashboard helps companies monitor sales performance across dealers, machinery types, regions, and customer segments.
4. Better Service Cost Control
Service cost monitoring allows organizations to identify high maintenance machinery models and improve product quality.
5. Clear Warranty Claim Tracking
Warranty claim analysis helps companies detect product issues early and improve manufacturing processes.
6. Improved Customer Insights
Customer analysis helps organizations understand purchasing behavior and improve customer service strategies.
7. Seasonal Demand Forecasting
Monthly sales analysis allows businesses to predict future machinery demand and adjust production accordingly.
Opportunities for Improvement
Click to Purchases Agricultural Machinery Dashboard in Power BI
Although the dashboard provides powerful insights, organizations can further improve it by implementing additional analytical features.
For example:
-
Integrate predictive analytics to forecast machinery demand
-
Add dealer performance scorecards
-
Include inventory management tracking
-
Monitor equipment utilization rates
-
Integrate IoT machinery performance data
-
Add maintenance scheduling dashboards
These improvements can significantly enhance decision-making capabilities.
Best Practices for the Agricultural Machinery Dashboard in Power BI
To maximize the benefits of this dashboard, organizations should follow several best practices.
1. Maintain Clean and Structured Data
Always maintain consistent and accurate data. Clean data ensures accurate analytics and reliable reports.
2. Use Interactive Filters and Slicers
Slicers allow users to analyze specific regions, machinery types, and customer segments quickly.
3. Update Data Regularly
Regular data updates ensure that managers always see the latest business performance.
4. Monitor KPIs Continuously
Managers should regularly review important KPIs such as sales amount, service cost, and warranty claims.
5. Use Visual Storytelling
Clear charts and visualizations help decision-makers quickly understand business trends.
6. Train Employees to Use the Dashboard
Organizations should train teams to use the dashboard effectively. Proper training improves adoption and productivity.
Who Can Benefit from the Agricultural Machinery Dashboard?
Several stakeholders can benefit from this powerful dashboard.
Agricultural Equipment Manufacturers
Manufacturers can monitor product performance, warranty claims, and service costs.
Machinery Dealers
Dealers can track sales performance and target achievement.
Farm Equipment Distributors
Distributors can analyze regional demand and improve supply chain planning.
Agricultural Service Centers
Service centers can monitor maintenance trends and equipment downtime.
Business Analysts
Analysts can evaluate machinery performance and identify growth opportunities.
How Does Power BI Improve Agricultural Machinery Analytics?
Power BI offers several advanced capabilities that significantly enhance machinery analytics.
These include:
-
Interactive dashboards
-
Real-time reporting
-
Automated data refresh
-
Drill-down data analysis
-
Custom visualizations
-
Integration with Excel and databases
Because of these features, Power BI becomes a powerful platform for agricultural business intelligence.
Conclusion
Agricultural machinery businesses operate in a dynamic and highly competitive market. Companies must monitor sales performance, maintenance costs, warranty claims, and regional demand to stay competitive.
However, traditional reporting methods cannot provide the level of insight required for modern decision-making.
The Agricultural Machinery Dashboard in Power BI solves this problem by transforming raw machinery data into clear and interactive visual insights.
With features such as Overview analysis, Machinery Type analysis, Customer Type insights, Regional performance tracking, and Monthly trend analysis, organizations gain a complete view of their machinery operations.
As a result, businesses improve decision-making, optimize sales strategies, control service costs, and enhance customer satisfaction.
Therefore, implementing an Agricultural Machinery Dashboard in Power BI can significantly improve operational efficiency and drive business growth in the agricultural equipment industry.
Frequently Asked Questions (FAQs)
What is an Agricultural Machinery Dashboard?
An Agricultural Machinery Dashboard is a data analytics tool that helps businesses monitor machinery sales, service costs, warranty claims, and regional performance.
Why should agricultural equipment companies use Power BI dashboards?
Power BI dashboards provide interactive visualization, real-time insights, and advanced analytics that help companies make faster and better business decisions.
What metrics can be tracked in this dashboard?
The dashboard can track several important metrics such as:
-
Sales amount
-
Service cost
-
Warranty claims
-
Customer type performance
-
Regional sales
-
Monthly sales trends
Can this dashboard track dealer performance?
Yes. The dashboard can monitor dealer target sales and performance across different regions.
Is Power BI suitable for agricultural businesses?
Yes. Power BI provides powerful visualization and analytics capabilities that help agricultural businesses monitor operations, analyze machinery demand, and improve decision-making.
Visit our YouTube channel to learn step-by-step video tutorials