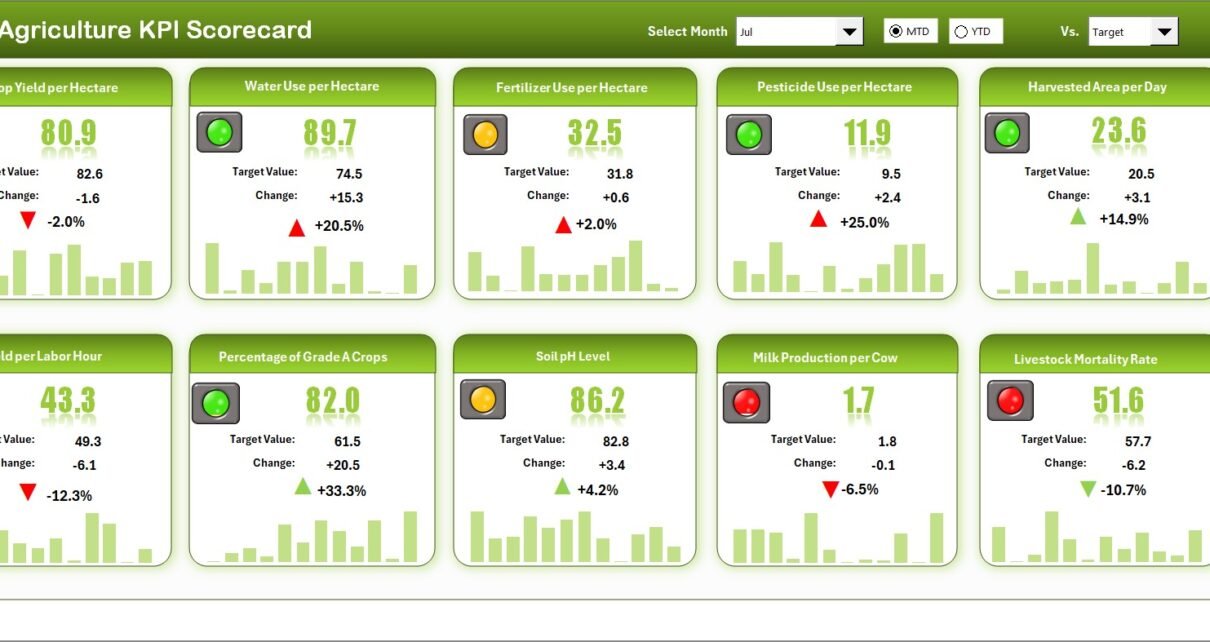
An Agriculture KPI Scorecard in Excel is a structured, visual reporting system that tracks key agricultural metrics. It helps users compare Actual vs Target performance for each KPI (Key Performance Indicator) on both a Month-to-Date (MTD) and Year-to-Date (YTD) basis.
Built entirely in Microsoft Excel, the scorecard provides flexibility, simplicity, and accessibility without requiring advanced software. It offers clear visibility into operations such as crop growth, irrigation efficiency, equipment performance, and labor utilization.
Unlike traditional reports, this scorecard brings all your agricultural data together in one dashboard — transforming raw figures into meaningful insights that drive timely decisions.
Click to Purchases Agriculture KPI Scorecard in Excel
🌾 Key Features of the Agriculture KPI Scorecard
The Agriculture KPI Scorecard in Excel comes with four interconnected worksheets. Each one serves a specific function to make performance monitoring easy and effective.
1. Scorecard Sheet
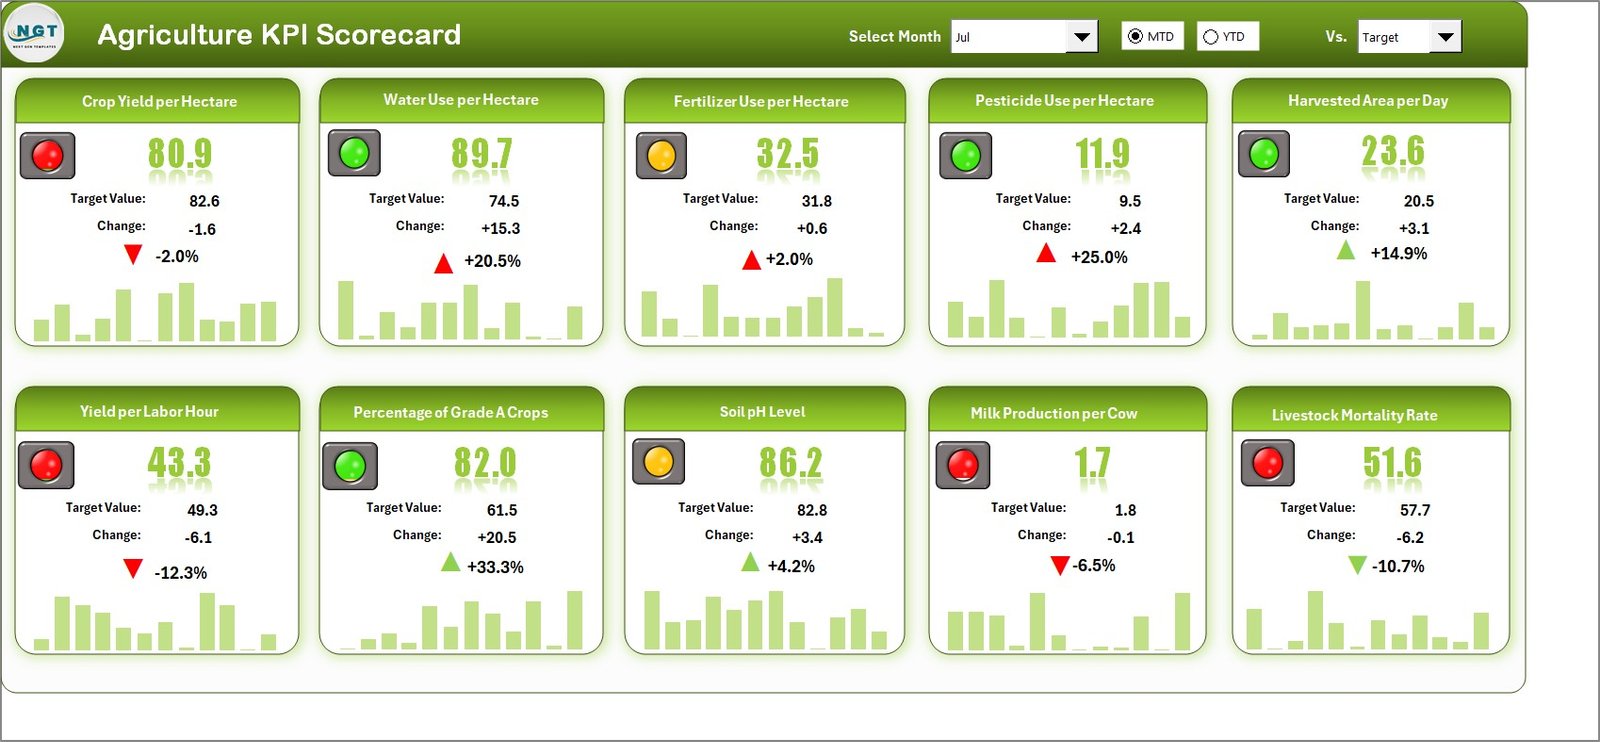
The Scorecard Sheet acts as the main dashboard where users can see all key metrics at a glance. It provides:
-
Dropdown Menus: Choose the month or switch between MTD and YTD views.
-
Actual vs Target Comparisons: Instantly check how your current performance measures against your goals.
-
Visual Indicators: Conditional formatting and color-coded status icons (like green for good, red for poor) help you quickly identify problem areas.
-
Comprehensive KPI Overview: Displays all major metrics with MTD and YTD summaries for each KPI.
This sheet serves as the control panel — giving management and field teams a quick, accurate overview of performance across multiple areas.
2. KPI Trend Sheet
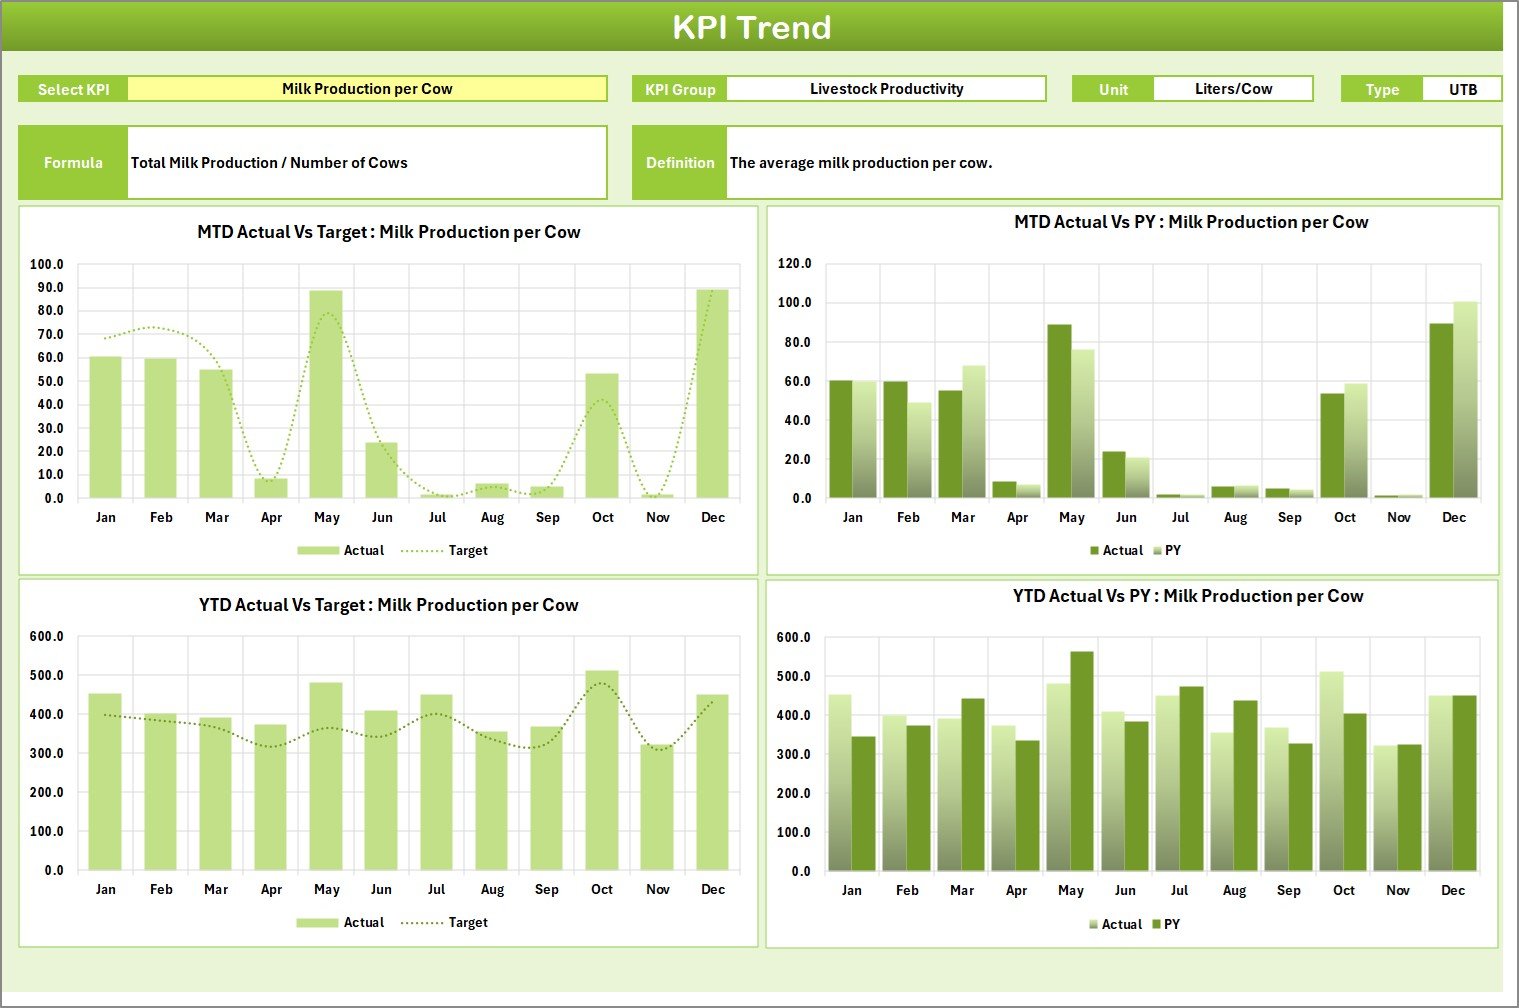
The KPI Trend Sheet allows deeper analysis of individual KPIs. Here, users can select a KPI name from a dropdown (cell C3) to display relevant details and charts.
Key highlights include:
-
KPI Details: KPI Group, Unit of Measure, KPI Type (Lower the Better or Upper the Better), Formula, and Definition.
-
Trend Analysis: View MTD and YTD charts showing Actual, Target, and Previous Year (PY) performance.
-
Visual Insights: Identify long-term trends and seasonal variations for each KPI.
This sheet helps in tracking changes over time and spotting areas where improvement efforts are working — or where intervention is needed.
3. Input Data Sheet
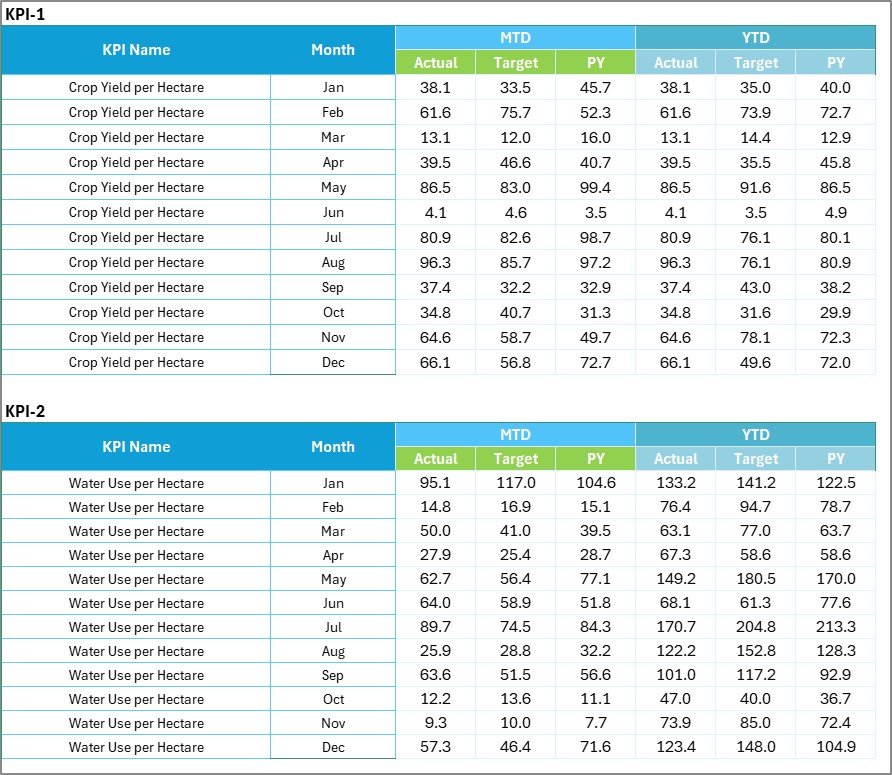
The Input Data Sheet is the backbone of the scorecard. It’s where users enter and maintain raw data.
-
Data Entry: Record monthly actuals, targets, and other key metrics for each KPI.
-
Update Flexibility: Add new results as they become available, ensuring the scorecard stays current.
-
Error-Free Management: Use data validation lists and proper formatting to reduce manual entry mistakes.
By maintaining clean and accurate input data, you can ensure reliable insights across all performance reports.
4. KPI Definition Sheet
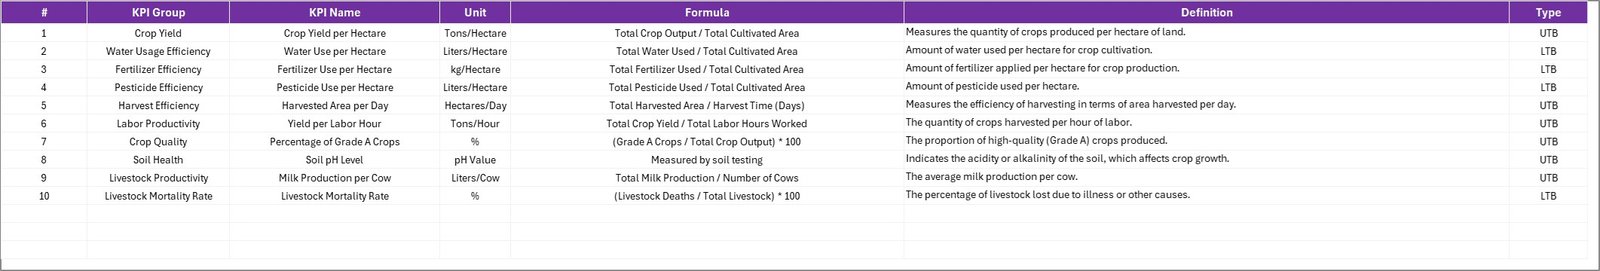
The KPI Definition Sheet acts as a reference library. It contains all the definitions and formulas used in your scorecard.
-
KPI Name & Group: Defines each KPI and categorizes it (e.g., Production, Resource Efficiency, Quality).
-
Unit & Formula: Clarifies measurement units (e.g., Tons, %, USD) and the calculation logic.
-
Definition: Provides a short explanation of what the KPI measures.
This sheet ensures consistency in interpretation — so everyone in your team understands how performance is being measured.
Click to Purchases Agriculture KPI Scorecard in Excel
🌻 Importance of Using a KPI Scorecard in Agriculture
Data-driven agriculture is the future of farming. A KPI scorecard bridges the gap between operational activities and performance evaluation.
Here’s why it matters:
-
Enhances Decision-Making: Managers can make quick, fact-based decisions by reviewing up-to-date metrics.
-
Improves Accountability: Each department or team can see its contribution toward the overall goal.
-
Saves Time: Instead of manually calculating results, the scorecard updates automatically with each data entry.
-
Increases Productivity: Visual trends reveal strengths and inefficiencies, allowing timely corrective actions.
-
Promotes Continuous Improvement: By comparing performance over months or years, you can track long-term progress and adjust strategies accordingly.
🌾 Common KPIs for Agriculture Performance Tracking
When building your Agriculture KPI Scorecard in Excel, consider including these categories and example KPIs:
1. Crop Production KPIs
-
Crop Yield (kg per hectare)
-
Harvest Efficiency (%)
-
Seed Germination Rate (%)
-
Land Utilization (%)
2. Resource Efficiency KPIs
-
Water Usage Efficiency (liters per kg of crop)
-
Fertilizer Utilization (%)
-
Fuel Consumption per Acre
3. Financial Performance KPIs
-
Cost per Hectare (USD)
-
Revenue per Crop Type
-
Profit Margin (%)
-
Return on Investment (ROI)
4. Labor and Operations KPIs
-
Labor Hours per Acre
-
Equipment Downtime (hours)
-
Training Completion Rate (%)
5. Sustainability and Environmental KPIs
-
Carbon Emission Reduction (%)
-
Soil Health Index
-
Waste Recycling Rate (%)
Each KPI should be measurable, relevant, and linked to your agricultural goals.
🌾 How to Use the Agriculture KPI Scorecard in Excel
-
Start with the KPI Definition Sheet: Define each KPI with clear formulas and units.
-
Enter Monthly Data: Record actual and target values for each KPI in the Input Data Sheet.
-
Monitor Trends: Use the KPI Trend Sheet to view MTD and YTD performance trends.
-
Review Scorecard Dashboard: Analyze visual summaries to identify areas performing well and those needing improvement.
-
Update Regularly: Keep data current to ensure accurate insights for meetings or reports.
By following this workflow, your scorecard becomes a living, dynamic tool that evolves with your operations.
Click to Purchases Agriculture KPI Scorecard in Excel
🌱 Advantages of Agriculture KPI Scorecard in Excel
Implementing this tool offers numerous benefits across management levels:
✅ 1. Real-Time Performance Tracking
You can instantly see whether targets are being met for each KPI.
✅ 2. Cost-Effective Tool
Excel eliminates the need for expensive software or licenses.
✅ 3. User-Friendly Interface
Even non-technical staff can operate the dashboard easily using dropdowns and color-coded visuals.
✅ 4. Customizable Framework
You can add or modify KPIs, formulas, or visuals according to your farm’s unique needs.
✅ 5. Data-Driven Decision Support
The scorecard converts data into actionable insights, leading to smarter strategies.
✅ 6. Enhanced Collaboration
Teams can review the same file in shared environments like OneDrive or Google Drive, improving coordination.
🌾 Opportunities for Improvement
While the Agriculture KPI Scorecard in Excel is a powerful tool, there’s always room for enhancement:
-
📊 Automation Integration: Use Excel VBA or Power Query to automate data refreshes.
-
🌍 Data Connectivity: Connect with real-time systems like IoT sensors for live updates.
-
💡 Visualization Upgrades: Add Power BI or Excel Power Pivot to build interactive dashboards.
-
🔍 Accuracy Checks: Implement validation rules to prevent incorrect data entry.
-
🧩 Scalability: As your farm expands, integrate new data sources without compromising performance.
By continuously improving your scorecard, you can maintain accuracy and scalability while saving time.
🌾 Best Practices for Using the Agriculture KPI Scorecard
To get the most value from your scorecard, follow these best practices:
🌿 1. Define Clear Goals
Start by identifying what you want to measure — whether it’s crop yield, cost control, or sustainability.
🌿 2. Use SMART KPIs
Ensure each KPI is Specific, Measurable, Achievable, Relevant, and Time-bound.
🌿 3. Standardize Data Entry
Maintain consistency in units, naming conventions, and data sources to ensure reliable analysis.
🌿 4. Update Regularly
Review and update your scorecard monthly to reflect current performance.
🌿 5. Use Visuals Wisely
Incorporate conditional formatting, charts, and indicators to highlight key insights clearly.
🌿 6. Encourage Collaboration
Allow multiple users to access and update the scorecard in shared platforms to promote transparency.
🌿 7. Back Up Data
Keep a backup copy of the workbook to prevent accidental loss of critical performance records.
🌿 8. Review KPI Relevance
Periodically reassess your KPIs to ensure they still align with your evolving agricultural goals.
🌻 Example: How KPI Scorecard Supports Decision-Making
Imagine a large farm cooperative tracking irrigation efficiency and fertilizer use.
The Agriculture KPI Scorecard quickly reveals that irrigation costs increased by 20% compared to last year while crop yield remained constant.
By examining the KPI Trend Sheet, managers notice the Water Usage Efficiency KPI dropping gradually. This insight leads to a decision to invest in drip irrigation systems, reducing water consumption and improving ROI within two seasons.
This example shows how a simple Excel-based scorecard can transform day-to-day management into strategic decision-making.
🌾 Conclusion
The Agriculture KPI Scorecard in Excel is a must-have tool for modern agricultural management. It empowers organizations to monitor critical metrics, compare actual performance against targets, and make data-backed decisions that enhance productivity and sustainability.
Whether you’re managing a small farm, a cooperative, or a large agribusiness, this scorecard provides the structure you need to track progress efficiently. With clear visuals, trend analysis, and flexible customization, it bridges the gap between data and action — helping you cultivate success, season after season.
Click to Purchases Agriculture KPI Scorecard in Excel
🌾 Frequently Asked Questions (FAQs)
1. What is a KPI in agriculture?
A KPI (Key Performance Indicator) in agriculture measures performance in areas like crop yield, water use, soil health, and financial efficiency.
2. How does an Agriculture KPI Scorecard help farmers?
It helps farmers monitor operational and financial performance, identify inefficiencies, and make data-driven decisions for better productivity.
3. Can I customize the KPI Scorecard in Excel?
Yes. You can add new KPIs, adjust formulas, and modify visuals to suit your specific farming operations.
4. What are the main data sources for the scorecard?
Common data sources include field reports, equipment logs, water usage records, weather data, and financial statements.
5. Does this scorecard require advanced Excel knowledge?
No. It’s designed for ease of use — anyone familiar with Excel basics can operate it.
6. How often should I update the KPI Scorecard?
Ideally, you should update it monthly or quarterly depending on your farming cycle and reporting needs.
7. Can I share this scorecard with my team online?
Yes. You can share it via cloud platforms like OneDrive or Google Drive for collaborative access.
8. What types of charts work best for agriculture KPIs?
Use bar charts, line charts, and conditional formatting icons to visualize trends effectively.
9. Can the scorecard track multiple farms?
Absolutely. You can extend the template to include multiple locations or departments by adding filters or slicers.
10. Is this scorecard suitable for small farms?
Yes. It’s flexible enough to serve both small-scale and large-scale agricultural businesses.
Click to Purchases Agriculture KPI Scorecard in Excel
Visit our YouTube channel to learn step-by-step video tutorials