Artificial Intelligence continues to transform modern organizations. Today, companies use AI models for customer service, marketing automation, fraud detection, predictive analytics, and decision-making. However, as AI adoption grows, organizations must also manage AI risk, compliance, data sensitivity, and governance policies.
Without proper monitoring, AI models may create ethical issues, compliance violations, biased results, or financial risks. Therefore, organizations need a structured system that helps them track AI performance and governance metrics clearly.
This is exactly where the AI Governance Dashboard in Power BI becomes extremely valuable.
Click to Purchases AI Governance Dashboard in Power BI
The AI Governance Dashboard in Power BI helps organizations monitor AI models, track governance compliance, analyze risk levels, and evaluate operational costs through powerful visual analytics. Instead of reviewing multiple reports and spreadsheets, decision-makers can view everything in a single interactive dashboard.
Moreover, Power BI transforms complex governance data into clear visuals, interactive charts, and dynamic insights. As a result, organizations can quickly identify governance issues, manage risks, and improve AI accountability.
In this comprehensive guide, you will learn everything about the AI Governance Dashboard in Power BI, including its features, dashboard structure, advantages, best practices, and frequently asked questions.
What is an AI Governance Dashboard in Power BI?
An AI Governance Dashboard in Power BI is a data visualization and analytics solution that helps organizations monitor and manage their artificial intelligence systems responsibly.
Instead of manually tracking AI model performance and compliance status in scattered documents, organizations can use this dashboard to monitor all governance metrics in one place.
The dashboard typically tracks:
-
AI model compliance status
-
Risk levels of AI models
-
Governance scores
-
AI incidents and issues
-
Model development and deployment statistics
-
Data sensitivity and cost analysis
Because Power BI supports interactive filtering, slicers, and drill-down analysis, users can quickly explore insights across different departments, regions, and AI model types.
Therefore, organizations can maintain transparency, accountability, and responsible AI management.
Why Do Organizations Need AI Governance?
AI systems influence many critical decisions. For example, banks use AI for credit scoring, hospitals use AI for diagnostics, and companies use AI for customer behavior prediction.
However, AI models may also introduce several challenges such as:
-
Biased predictions
-
Compliance violations
-
Data privacy risks
-
Uncontrolled AI model usage
-
Lack of transparency
Because of these risks, organizations must implement AI governance frameworks.
AI governance ensures that:
-
AI systems follow ethical guidelines
-
Models comply with regulatory standards
-
Data privacy remains protected
-
AI usage stays transparent and accountable
Therefore, a Power BI AI Governance Dashboard helps organizations track and enforce these policies efficiently.
Key Features of the AI Governance Dashboard in Power BI
The AI Governance Dashboard in Power BI contains five analytical pages that provide detailed insights into AI governance metrics.
Each page focuses on a different aspect of AI monitoring and compliance.
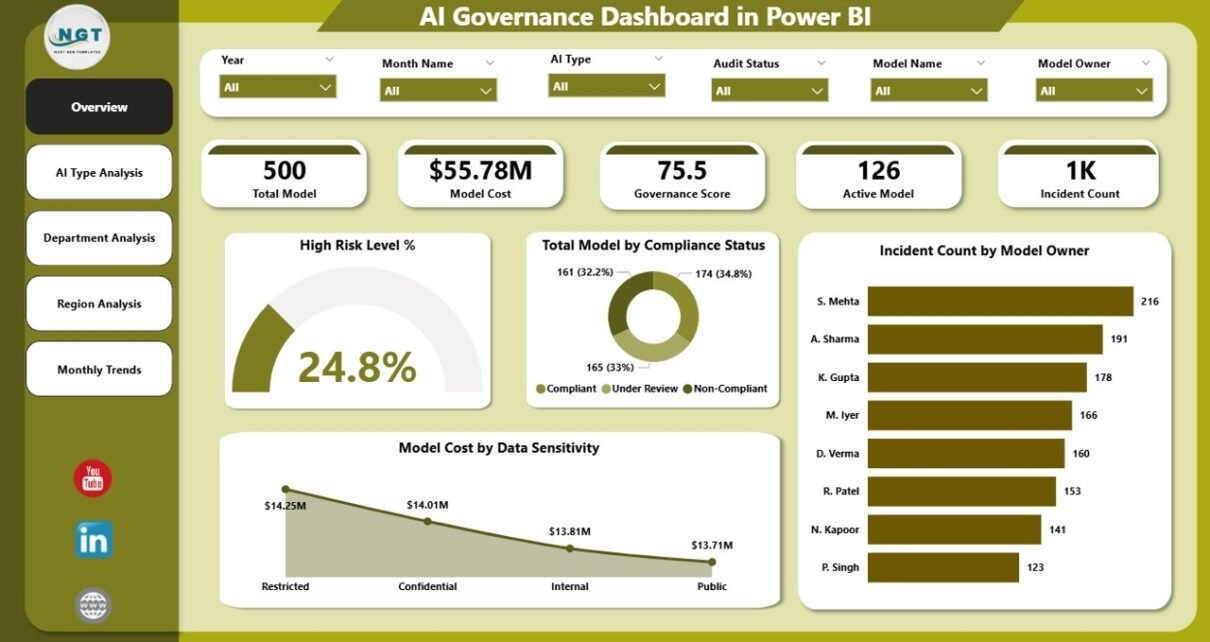
1. Overview Page
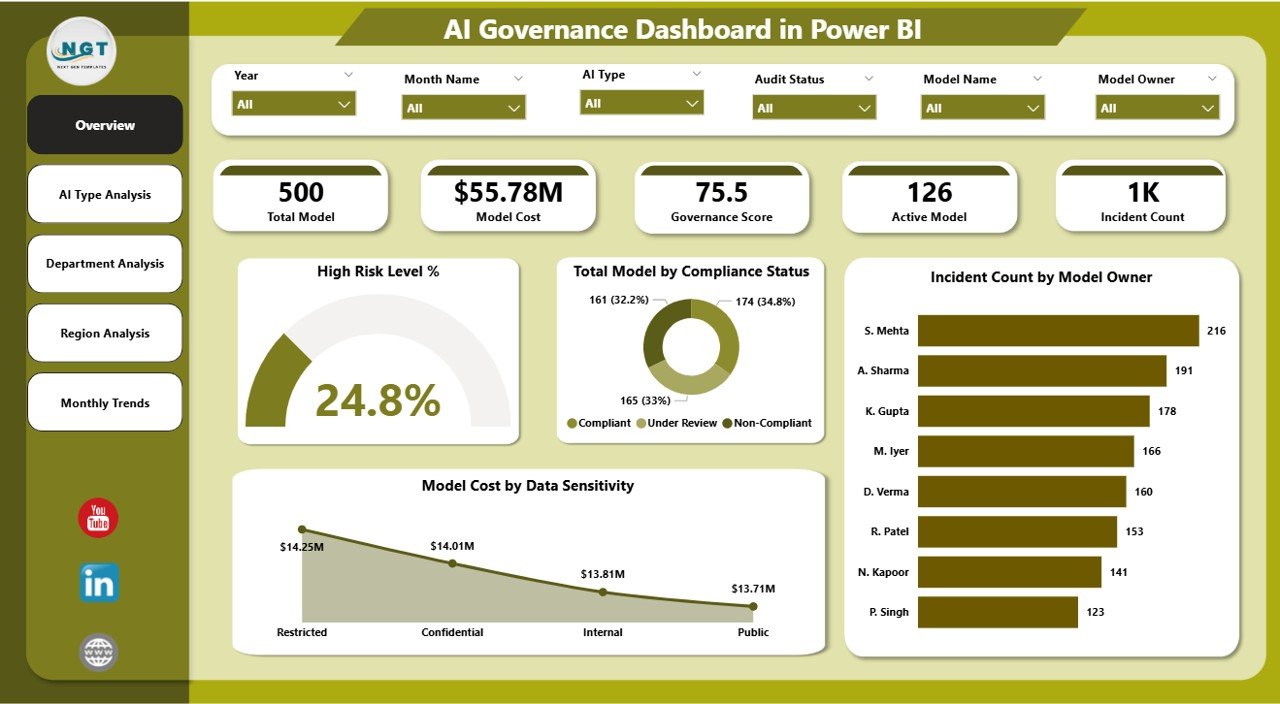
The Overview Page serves as the central control panel of the dashboard.
Users can quickly understand the overall governance status of AI systems through high-level KPI indicators and visual charts.
The page includes interactive slicers, allowing users to filter data based on specific parameters such as department, region, or AI model type.
Key KPI Cards
The overview page displays the following KPI cards:
-
High Risk Level % – Shows the percentage of AI models classified as high risk.
-
Total Model by Compliance Status – Displays the number of AI models categorized by compliance level.
-
Incident Count by Model Owner – Tracks the number of incidents associated with each model owner.
-
Model Cost by Data Sensitivity – Shows how much organizations spend on AI models based on data sensitivity.
These KPIs allow executives and governance teams to quickly assess AI risk exposure and operational costs.
2. AI Type Analysis Dashboard
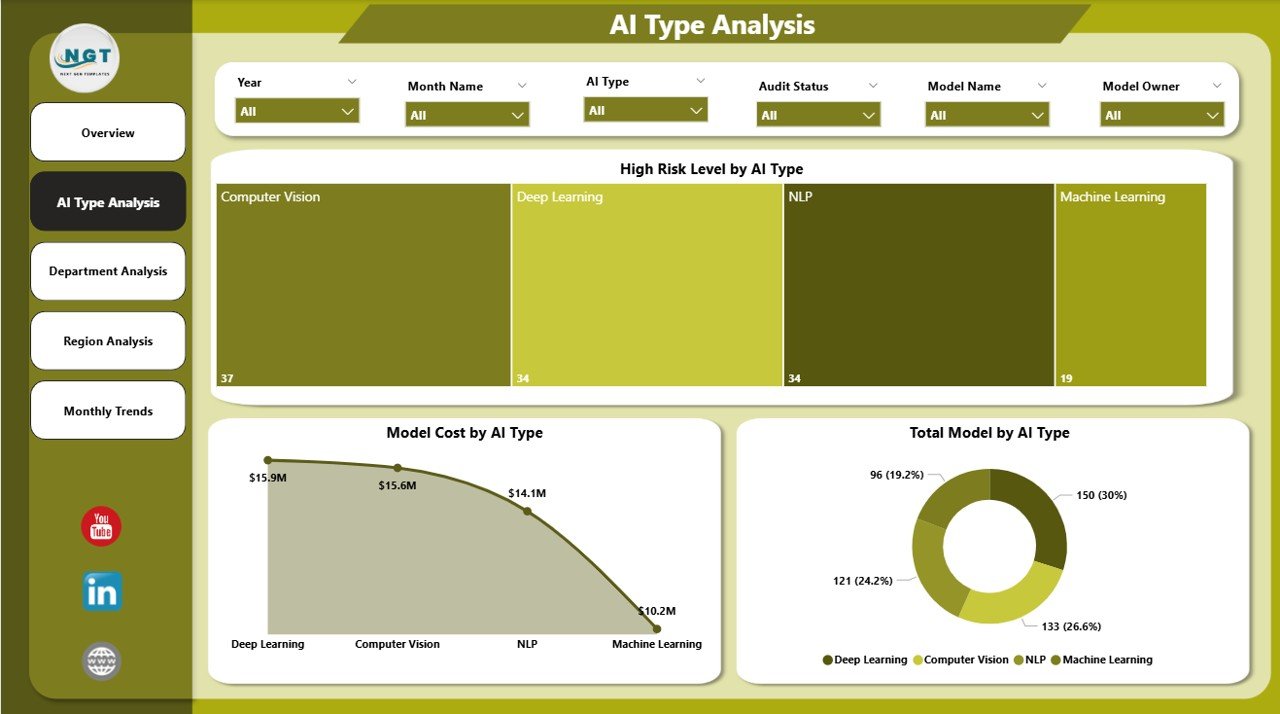
The AI Type Analysis Page focuses on analyzing AI models based on their type or category.
Different AI systems serve different purposes such as machine learning models, natural language processing tools, computer vision systems, and recommendation engines.
Therefore, organizations must monitor governance metrics across each AI type.
Charts Included
This page contains the following visualizations:
-
High Risk Level by AI Type – Identifies which AI categories carry higher governance risks.
-
Model Cost by AI Type – Shows operational costs associated with each AI model category.
-
Total Model by AI Type – Displays how many AI models exist within each category.
These insights help organizations understand where AI investments and governance risks concentrate.
Click to Purchases AI Governance Dashboard in Power BI
3. Department Analysis Dashboard
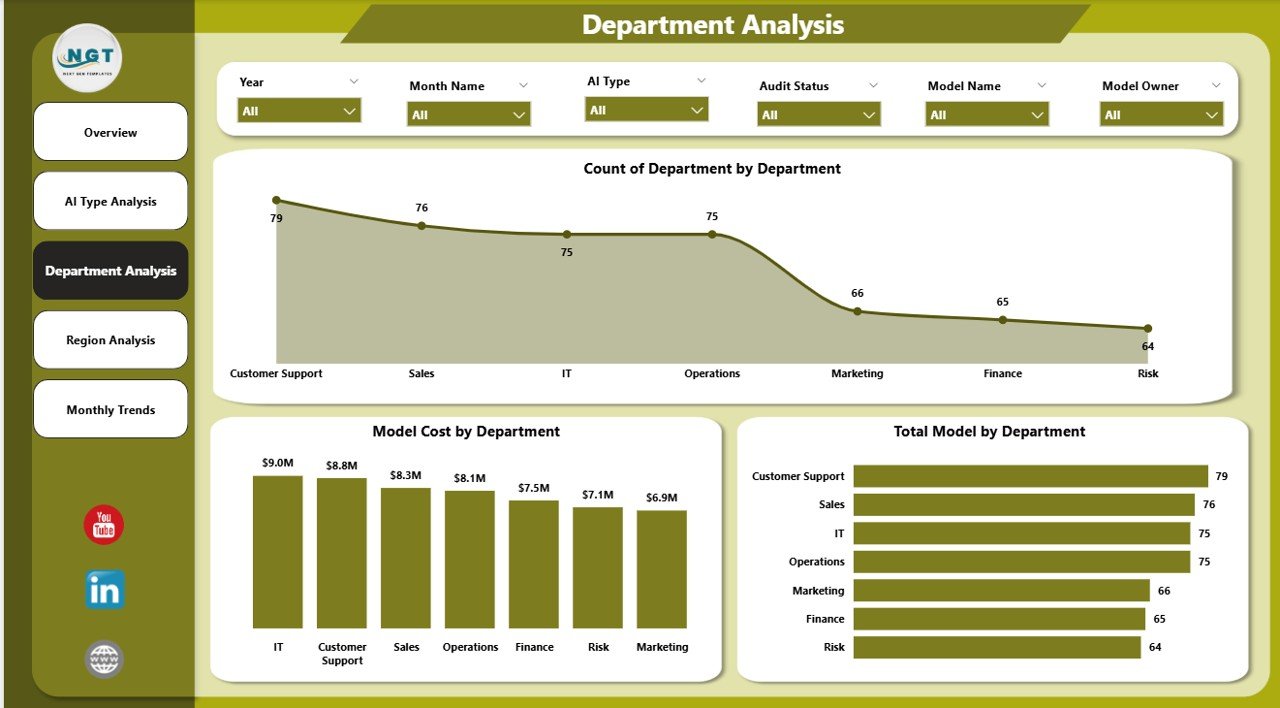
Many departments across an organization deploy AI models for different purposes.
For example:
-
Marketing teams use AI for campaign optimization
-
Finance teams use AI for fraud detection
-
HR teams use AI for recruitment analysis
Because each department manages its own AI systems, governance teams must monitor departmental performance.
Charts Included
The Department Analysis Page includes:
-
Governance Score by Department – Evaluates how well each department follows AI governance policies.
-
Model Cost by Department – Shows the operational cost of AI models used by each department.
-
Total Model by Department – Displays the number of AI models used within departments.
These insights help organizations identify departments that require stronger governance oversight.
4. Region Analysis Dashboard
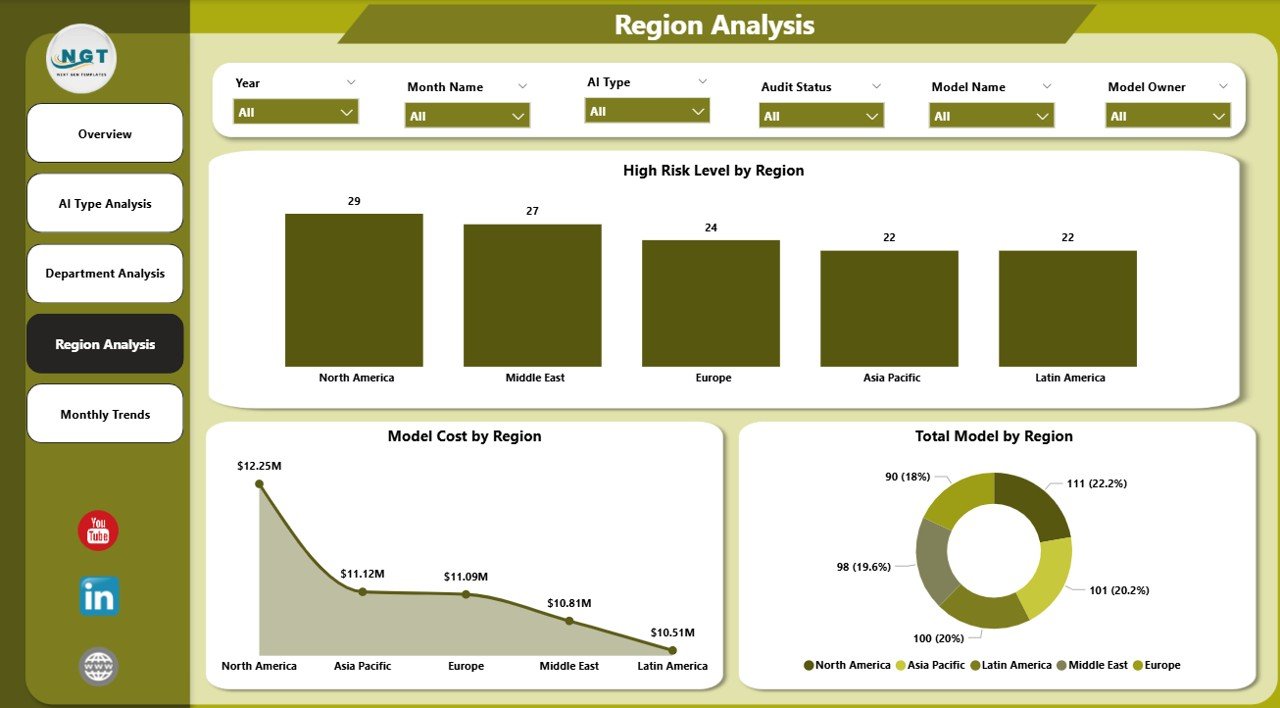
Large organizations operate across multiple geographic regions. However, AI regulations and governance standards may vary across regions.
Therefore, organizations must analyze AI models regionally.
Charts Included
The Region Analysis Page includes:
-
High Risk Level by Region – Shows regions where AI models present higher risk levels.
-
Model Cost by Region – Displays AI spending across geographic locations.
-
Total Model by Region – Shows how many AI models operate within each region.
These insights allow global organizations to manage AI governance consistently across locations.
5. Month Analysis Dashboard
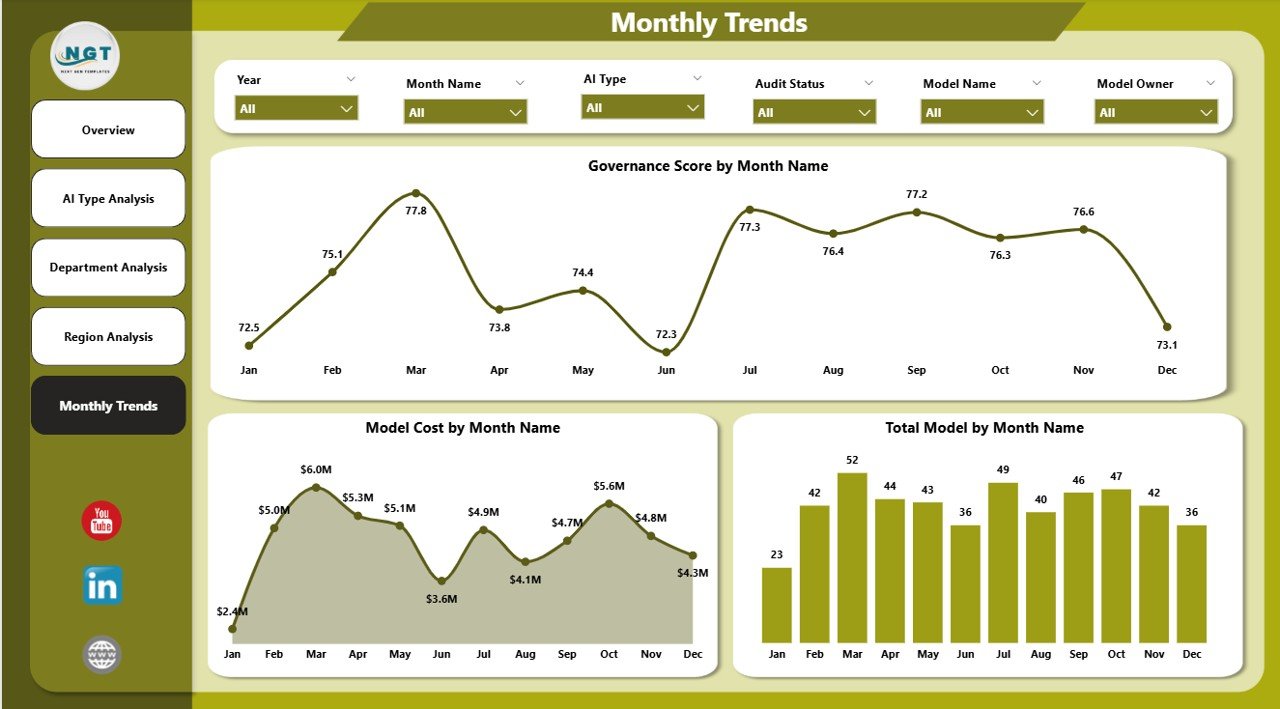
AI governance requires continuous monitoring. Therefore, organizations must track governance trends over time.
The Month Analysis Page focuses on temporal analysis.
Charts Included
-
Governance Score by Month – Shows how governance compliance changes over time.
-
Model Cost by Month – Tracks monthly AI operational expenses.
-
Total Model by Month – Displays the growth of AI model deployments over time.
This analysis helps organizations understand AI adoption trends and governance improvements.
Advantages of the AI Governance Dashboard in Power BI
Organizations gain multiple benefits by implementing this dashboard.
1. Centralized AI Monitoring
The dashboard consolidates all governance metrics into a single interface. Therefore, teams no longer need to review multiple reports.
2. Improved Risk Management
Organizations can quickly identify high-risk AI models. As a result, governance teams can take corrective action immediately.
3. Better Compliance Tracking
The dashboard helps track compliance status across AI models. Therefore, organizations remain aligned with regulatory requirements.
4. Faster Decision-Making
Because Power BI provides real-time insights, leaders can make faster and smarter decisions.
5. Cost Visibility
Click to Purchases AI Governance Dashboard in Power BI
The dashboard clearly shows how much organizations spend on AI models. Consequently, teams can optimize AI investments.
6. Departmental Accountability
The dashboard highlights which departments follow governance policies and which ones require improvement.
7. Scalable AI Oversight
As organizations deploy more AI models, the dashboard continues to monitor them efficiently.
Best Practices for the AI Governance Dashboard in Power BI
Organizations should follow several best practices when implementing AI governance dashboards.
Define Clear Governance Metrics
First, organizations should clearly define governance metrics such as:
-
Risk level classification
-
Compliance status
-
Governance score
-
Incident tracking
Clear metrics ensure accurate analysis.
Maintain Accurate Data Sources
The dashboard should connect to reliable data sources such as:
-
AI model registries
-
compliance management systems
-
incident management platforms
-
financial systems
Accurate data improves dashboard insights.
Update Governance Data Regularly
Organizations should update governance data frequently. Regular updates ensure that the dashboard reflects the latest AI activity.
Implement Role-Based Access
Not all employees should access sensitive governance data.
Therefore, organizations should implement role-based access control within Power BI.
Monitor High-Risk AI Models Closely
Governance teams should prioritize monitoring high-risk AI models.
These models often require:
-
additional validation
-
regulatory review
-
strict monitoring policies
Integrate Compliance Frameworks
Organizations should align their dashboards with established frameworks such as:
-
Responsible AI principles
-
Ethical AI standards
-
Data protection regulations
This approach ensures strong governance.
How Does Power BI Improve AI Governance?
Power BI offers several capabilities that improve AI governance management.
Interactive Data Visualization
Power BI transforms raw governance data into easy-to-understand visual dashboards.
Decision-makers can instantly identify risks and compliance gaps.
Real-Time Analytics
Organizations can monitor governance metrics in real time. Therefore, they can detect issues quickly.
Advanced Filtering and Slicers
Power BI allows users to filter dashboards by:
-
AI type
-
department
-
region
-
time period
This flexibility makes analysis easier.
Integration with Multiple Data Sources
Power BI integrates with many platforms such as:
-
databases
-
cloud services
-
enterprise systems
Therefore, organizations can consolidate governance data efficiently.
Scalability
Power BI supports organizations with thousands of AI models. Therefore, it scales easily as AI adoption grows.
Who Can Benefit from the AI Governance Dashboard?
Many professionals and teams can benefit from this dashboard.
AI Governance Teams
They monitor risk levels, compliance status, and model incidents.
Data Science Teams
They track AI model performance and deployment statistics.
Risk Management Teams
They analyze governance risks across departments and regions.
Executives and Leadership
They gain high-level insights into AI investments and governance status.
Compliance Officers
They ensure AI systems follow regulatory requirements.
Future of AI Governance Dashboards
Click to Purchases AI Governance Dashboard in Power BI
AI governance will become even more important as AI technologies evolve.
In the future, governance dashboards may include:
-
automated risk detection
-
AI model explainability analysis
-
bias monitoring tools
-
regulatory compliance automation
-
AI lifecycle management
Organizations that invest in governance dashboards today will build responsible and sustainable AI systems.
Conclusion
Artificial Intelligence provides enormous opportunities for innovation and efficiency. However, organizations must manage AI systems responsibly.
The AI Governance Dashboard in Power BI helps organizations monitor AI models, track governance metrics, manage risks, and ensure compliance.
Through interactive visuals, dynamic analysis, and centralized monitoring, this dashboard empowers organizations to maintain transparent, ethical, and compliant AI systems.
As AI adoption continues to grow, governance dashboards will play a critical role in ensuring responsible AI management.
Organizations that implement AI governance dashboards today will gain greater control, better visibility, and stronger regulatory compliance.
Frequently Asked Questions (FAQs)
What is AI governance?
AI governance refers to the policies, processes, and controls used to manage artificial intelligence systems responsibly. It ensures AI models follow ethical guidelines, regulatory requirements, and operational standards.
Why is AI governance important?
AI governance helps organizations reduce risks such as bias, compliance violations, and data privacy issues. It also improves transparency and accountability in AI systems.
What does an AI Governance Dashboard track?
An AI Governance Dashboard tracks metrics such as:
-
AI risk levels
-
compliance status
-
incident counts
-
governance scores
-
AI model costs
-
AI deployment statistics
Why use Power BI for AI governance dashboards?
Power BI provides powerful data visualization, real-time analytics, interactive filtering, and integration with multiple data sources. Therefore, it makes AI governance monitoring more effective.
Who should use an AI Governance Dashboard?
AI governance dashboards help:
-
AI governance teams
-
data science teams
-
compliance officers
-
risk management professionals
-
executives and leadership teams
Can small organizations use AI governance dashboards?
Yes. Even small organizations benefit from governance dashboards because they help track AI models, manage risks, and maintain compliance efficiently.
Visit our YouTube channel to learn step-by-step video tutorials