Artificial Intelligence continues to transform how organizations operate, innovate, and compete. However, as AI adoption increases, governance, compliance, transparency, and accountability become equally important. Because of this growing need, organizations must monitor AI governance metrics in a structured and reliable way.
That is exactly where an AI Governance KPI Dashboard in Power BI becomes extremely valuable.
This in-depth guide explains what an AI Governance KPI Dashboard in Power BI is, why organizations need it, how it works, and how each dashboard page supports strong AI oversight. Moreover, this article explores its advantages, best practices, and frequently asked questions so you can confidently implement it in your organization.
Click to Purchases AI Governance KPI Dashboard in Power BI
What Is an AI Governance KPI Dashboard in Power BI?
An AI Governance KPI Dashboard in Power BI is an interactive analytics solution designed to track, analyze, and visualize key performance indicators related to AI governance.
Instead of managing scattered spreadsheets, emails, and manual reports, this dashboard centralizes all AI governance KPIs in one Power BI file. As a result, governance teams, risk managers, compliance leaders, and executives gain a clear and real-time view of AI performance.
Moreover, this dashboard uses Excel as a data source, which makes it easy to update, flexible to maintain, and accessible to business users without advanced technical skills.
Why Do Organizations Need an AI Governance KPI Dashboard?
AI systems influence decisions that affect customers, employees, finances, and compliance. Therefore, organizations must ensure transparency, fairness, and accountability across AI initiatives.
However, manual governance processes often create gaps. As a result, risks increase and compliance weakens.
An AI Governance KPI Dashboard in Power BI solves these challenges by:
-
Centralizing AI governance metrics
-
Tracking performance against defined targets
-
Highlighting risks and deviations instantly
-
Enabling data-driven governance decisions
Because Power BI offers interactive visuals and slicers, stakeholders can explore insights quickly and confidently.
What Are the Key Objectives of an AI Governance KPI Dashboard?
Organizations design this dashboard to achieve several critical objectives.
These objectives include:
-
Monitoring AI governance performance regularly
-
Comparing actual performance against defined targets
-
Tracking month-to-date (MTD) and year-to-date (YTD) metrics
-
Comparing current year performance with previous year data
-
Improving transparency and accountability
As a result, organizations move from reactive governance to proactive AI oversight.
What Are the Key Features of the AI Governance KPI Dashboard in Power BI?
This ready-to-use dashboard includes three structured pages inside the Power BI Desktop file. Each page serves a specific governance purpose.
Let us explore each page in detail.
How Does the Summary Page of the AI Governance KPI Dashboard Work?
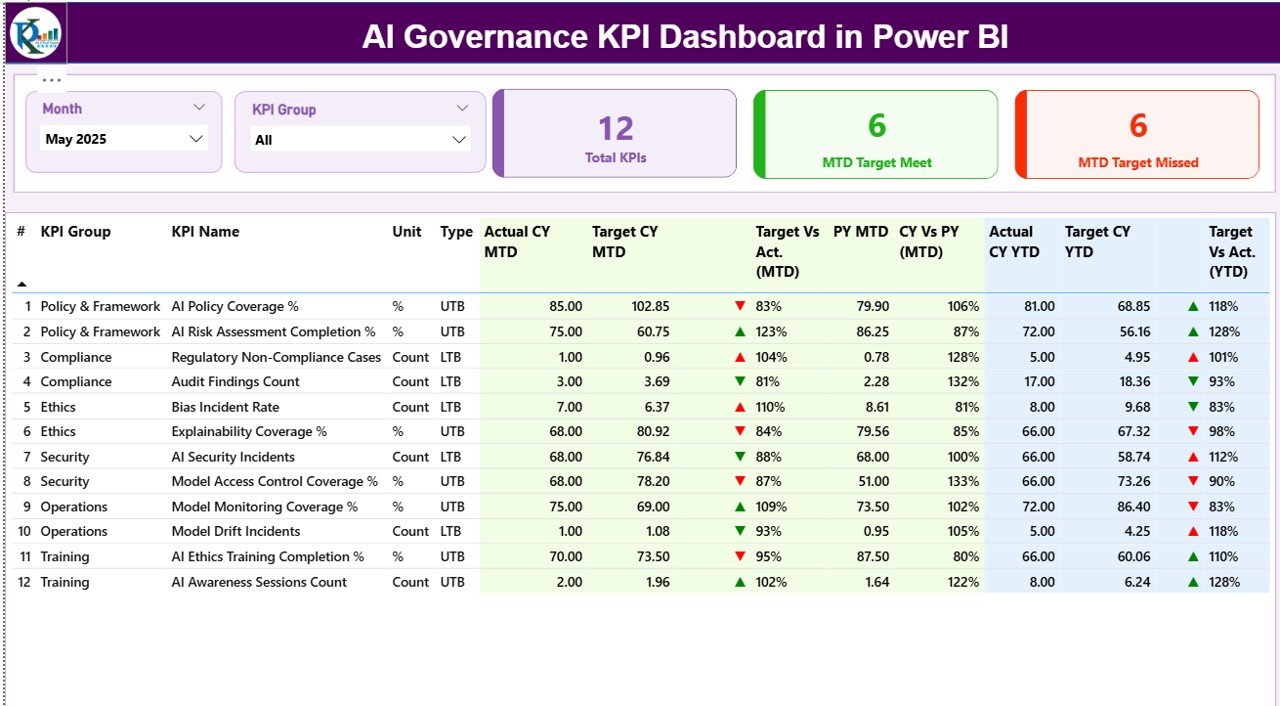
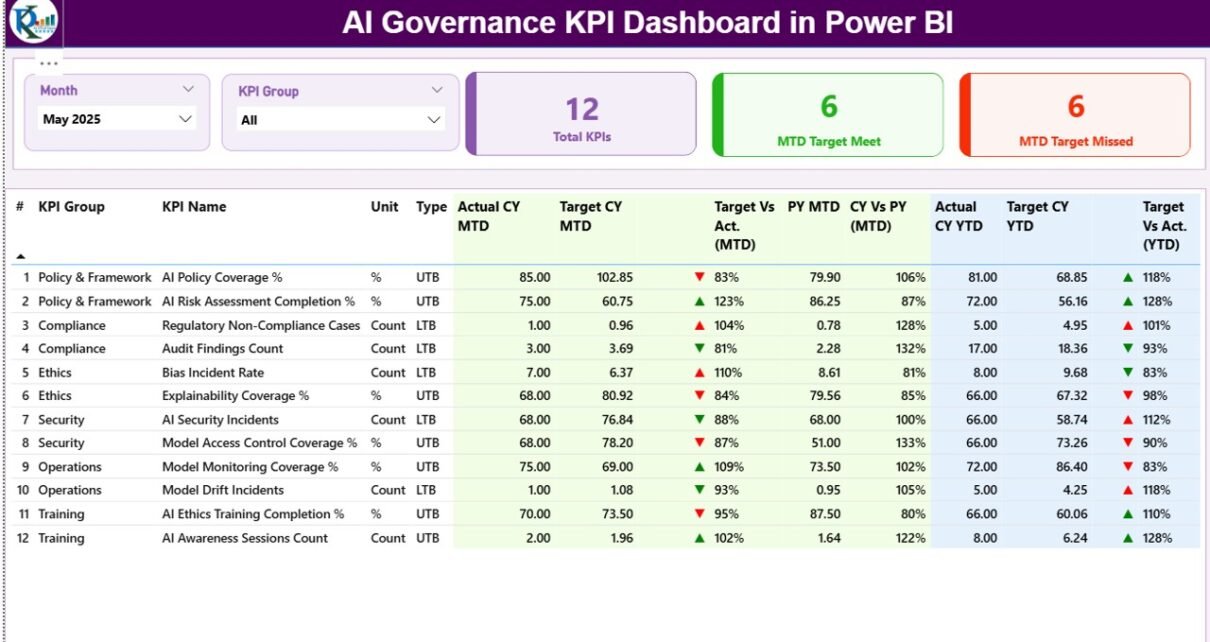
The Summary Page acts as the main landing page of the dashboard. It provides a high-level view of all AI governance KPIs.
Top-Level Slicers
At the top of the Summary Page, you will find:
-
Month slicer – Allows users to select a specific reporting month
-
KPI Group slicer – Enables filtering KPIs by category or governance domain
Because of these slicers, users can instantly customize the dashboard view.
KPI Performance Cards
Just below the slicers, the dashboard displays three KPI cards:
-
Total KPIs Count – Shows the total number of AI governance KPIs
-
MTD Target Met Count – Displays how many KPIs achieved the MTD target
-
MTD Target Missed Count – Highlights KPIs that failed to meet targets
These cards provide instant clarity on overall governance performance.
Detailed KPI Table Explained
Below the cards, the Summary Page shows a detailed KPI table with rich performance metrics.
The table includes the following columns:
-
KPI Number
Displays the sequence number of each KPI. -
KPI Group
Shows the governance category of the KPI, such as Ethics, Risk, Compliance, or Transparency. -
KPI Name
Displays the descriptive name of the KPI. -
Unit
Indicates the unit of measurement, such as %, Count, Score, or Ratio. -
Type (LTB or UTB)
Defines whether the KPI follows:-
LTB (Lower the Better) or
-
UTB (Upper the Better)
-
Month-to-Date (MTD) Performance Metrics
The Summary Page also captures detailed MTD performance data, including:
-
Actual CY MTD – Actual KPI value for the current year month-to-date
-
Target CY MTD – Target KPI value for the current year month-to-date
-
MTD Icon – Uses red ▼ or green ▲ icons to indicate performance status
-
Target vs Actual (MTD) – Shows performance as a percentage using:
Actual / Target -
PY MTD – Previous year MTD value for comparison
-
CY vs PY (MTD) – Displays growth or decline compared to last year
Because of this structure, users can quickly assess short-term performance.
Year-to-Date (YTD) Performance Metrics
Click to Purchases AI Governance KPI Dashboard in Power BI
Similarly, the Summary Page includes YTD performance metrics, such as:
-
Actual CY YTD
-
Target CY YTD
-
YTD Icon – Visual indicator of YTD target achievement
-
Target vs Actual (YTD)
-
PY YTD
-
CY vs PY (YTD)
As a result, stakeholders gain a long-term governance performance view.
How Does the KPI Trend Page Help Governance Analysis?
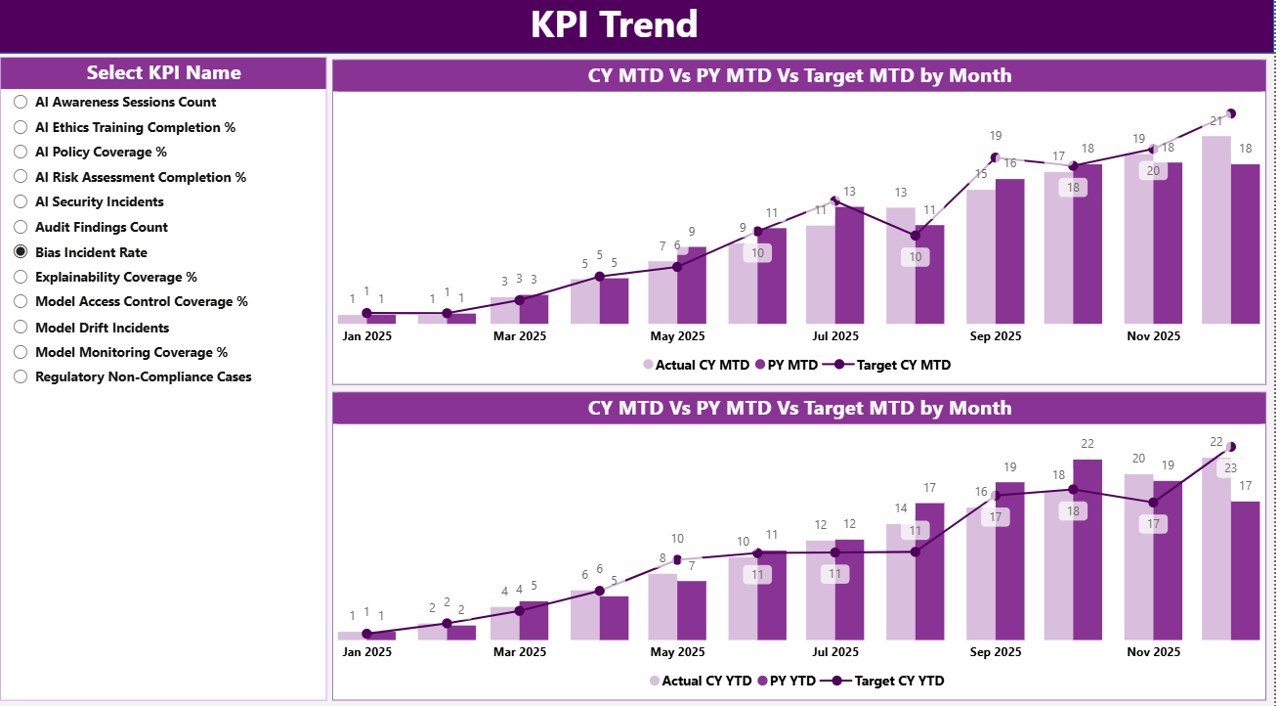
The KPI Trend Page focuses on performance trends over time.
KPI Selection Slicer
On the left side, the dashboard provides a KPI Name slicer. This slicer allows users to select one KPI at a time.
Trend Visualization Using Combo Charts
This page includes two combo charts:
-
MTD Trend Chart
Displays:-
Current Year Actual
-
Previous Year Actual
-
Target values
-
-
YTD Trend Chart
Shows long-term performance trends using the same comparison logic.
Because of these visuals, users can easily identify performance patterns, gaps, and improvements.
What Is the Role of the KPI Definition Page?
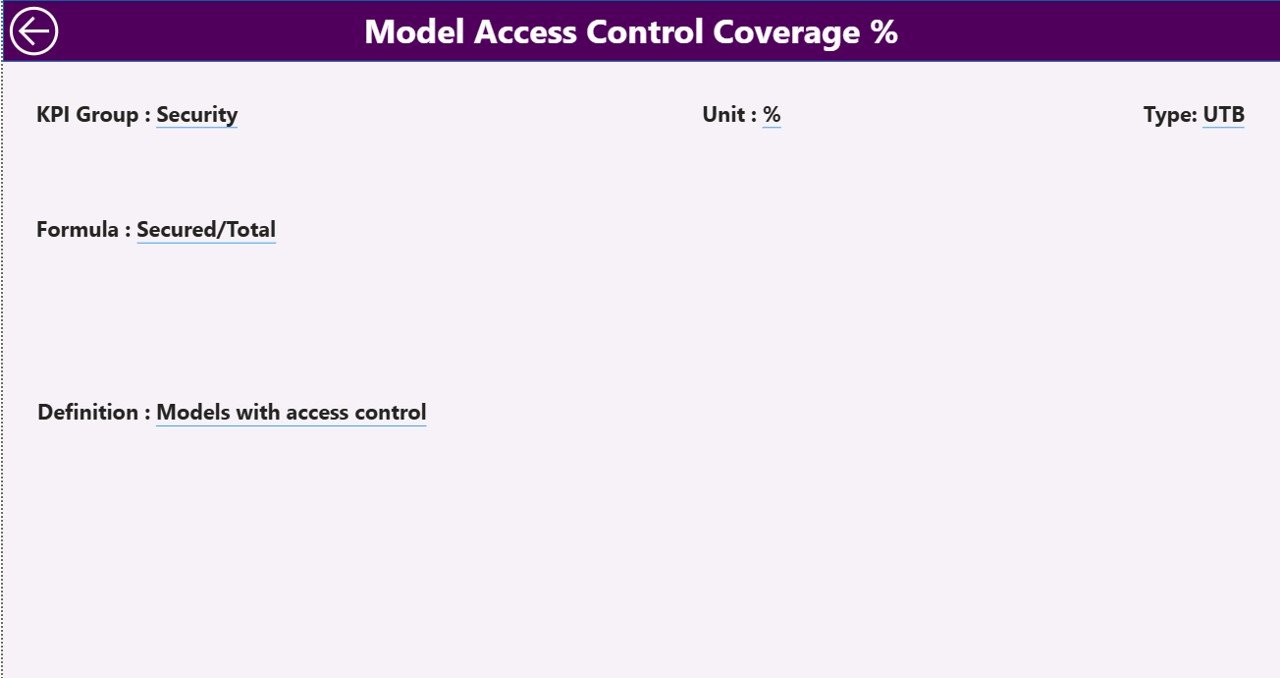
The KPI Definition Page acts as a reference and drill-through page.
Key Characteristics
-
This page remains hidden by default
-
Users can drill through from the Summary Page
-
It displays:
-
KPI Formula
-
KPI Definition
-
KPI Type and Unit
-
Easy Navigation
A Back button appears at the top-left corner of the page. Users can click it to return to the Summary Page instantly.
As a result, the dashboard remains clean while still providing detailed documentation when needed.
How Does the Excel Data Source Power the Dashboard?
The AI Governance KPI Dashboard uses an Excel file as its data source, which makes data management simple and flexible.
The Excel file includes three structured worksheets.
What Is the Input_Actual Sheet Used For?
The Input_Actual sheet stores actual KPI performance data.
You must fill:
-
KPI Name
-
Month (use the first date of the month)
-
MTD Actual value
-
YTD Actual value
Because of this structure, Power BI can aggregate and visualize data accurately.
What Is the Input_Target Sheet Used For?
Click to Purchases AI Governance KPI Dashboard in Power BI
The Input_Target sheet stores target KPI values.
You must enter:
-
KPI Name
-
Month (first date of the month)
-
MTD Target value
-
YTD Target value
This separation of actual and target data improves governance clarity.
What Information Goes into the KPI Definition Sheet?
The KPI Definition sheet documents governance KPIs clearly.
It includes:
-
KPI Number
-
KPI Group
-
KPI Name
-
Unit
-
Formula
-
Definition
-
Type (LTB or UTB)
As a result, governance teams maintain transparency and consistency.
Advantages of AI Governance KPI Dashboard in Power BI
An AI Governance KPI Dashboard offers multiple strategic benefits.
1. Centralized AI Governance Monitoring
This dashboard brings all AI governance metrics into one place. Therefore, teams avoid fragmented reporting.
2. Improved Transparency and Accountability
Because KPIs remain visible to stakeholders, accountability increases across teams.
3. Real-Time Performance Tracking
Power BI visuals update instantly when users refresh data. As a result, decision-makers always see the latest information.
4. Easy Comparison of Targets and Results
The dashboard compares actual values against targets for both MTD and YTD. Therefore, governance gaps become visible immediately.
5. Historical Performance Analysis
By comparing current year and previous year data, organizations identify trends and improvement areas.
6. User-Friendly and Scalable Design
Excel-based data input keeps the system easy to maintain while Power BI ensures scalability.
Best Practices for the AI Governance KPI Dashboard in Power BI
To get maximum value, organizations should follow these best practices.
1. Define Clear and Measurable KPIs
Always define KPIs with clear formulas and ownership.
2. Update Data Consistently
Ensure teams update actual and target data monthly without delays.
3. Use KPI Groups Strategically
Group KPIs logically, such as Ethics, Risk, Compliance, and Transparency.
4. Review Trends Regularly
Analyze MTD and YTD trends frequently to identify risks early.
5. Maintain KPI Documentation
Keep KPI definitions updated to avoid confusion.
6. Limit Overcrowding
Focus on meaningful KPIs instead of tracking too many metrics.
Conclusion: Why AI Governance KPI Dashboard in Power BI Matters
Click to Purchases AI Governance KPI Dashboard in Power BI
AI governance plays a critical role in responsible AI adoption. However, without structured monitoring, governance efforts weaken quickly.
An AI Governance KPI Dashboard in Power BI provides clarity, transparency, and actionable insights. It transforms raw governance data into interactive visuals that support confident decision-making.
By using Excel as a data source and Power BI for visualization, organizations gain a flexible yet powerful governance solution.
Frequently Asked Questions (FAQs)
What is the main purpose of an AI Governance KPI Dashboard in Power BI?
The dashboard helps organizations track, analyze, and monitor AI governance KPIs in a centralized and visual way.
Can non-technical users update this dashboard?
Yes. Users only need to update the Excel data source. Power BI handles visualization automatically.
How often should organizations update AI governance data?
Organizations should update data monthly to ensure accurate MTD and YTD reporting.
Can this dashboard support multiple KPI groups?
Yes. The KPI Group slicer allows filtering across different governance categories.
Does the dashboard support trend analysis?
Yes. The KPI Trend Page displays MTD and YTD trends for selected KPIs.
Is this dashboard customizable?
Yes. Organizations can add KPIs, modify visuals, and adjust slicers as needed.
Visit our YouTube channel to learn step-by-step video tutorials