Airline catering plays a vital role in the overall passenger experience. Meals, beverages, and onboard services directly affect customer satisfaction, brand image, and airline loyalty. Therefore, airline catering teams must track performance carefully, analyze trends regularly, and take quick corrective actions when needed.
That is exactly why an Airline Catering KPI Dashboard in Excel becomes an essential performance management tool for airline catering operations.
In this detailed and SEO-friendly guide, you will learn what an Airline Catering KPI Dashboard in Excel is, why it matters, how it works, how each worksheet supports decision-making, and how to use it effectively. Moreover, this article explains the advantages, best practices, and frequently asked questions so you can confidently implement and scale this dashboard in real-world airline catering environments.
Click to buy Airline Catering KPI Dashboard in Excel
What Is an Airline Catering KPI Dashboard in Excel?
An Airline Catering KPI Dashboard in Excel is a structured, interactive, and ready-to-use performance tracking solution designed to monitor key performance indicators (KPIs) related to airline catering operations.
Instead of managing scattered Excel sheets, emails, or manual reports, this dashboard consolidates all catering KPIs into one centralized system. As a result, catering managers, operations heads, and airline leadership teams gain instant visibility into actual performance, targets, and historical comparisons.
Because the dashboard uses Excel, it remains easy to use, cost-effective, and flexible. Moreover, teams can update data monthly without advanced technical skills.
Why Do Airline Catering Teams Need a KPI Dashboard in Excel?
Airline catering operations involve multiple moving parts. Food preparation, quality control, cost management, supplier coordination, waste reduction, and on-time delivery all happen simultaneously. Therefore, teams must track performance continuously.
However, manual tracking often leads to delays, data inconsistency, and missed improvement opportunities. That is why an Airline Catering KPI Dashboard in Excel becomes essential.
Key Reasons to Use This Dashboard
- It centralizes all catering KPIs in one place
- It improves visibility across months and years
- It enables faster, data-driven decisions
- It reduces manual reporting effort
- It supports performance accountability
As a result, airline catering teams gain control, clarity, and confidence.
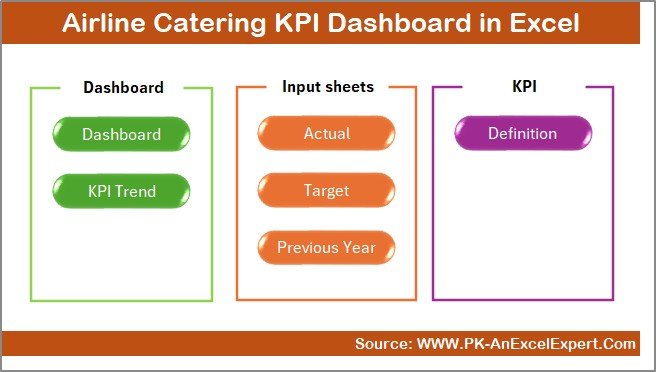
What Are the Key Features of the Airline Catering KPI Dashboard in Excel?
This Airline Catering KPI Dashboard in Excel includes 7 well-structured worksheets, each designed for a specific purpose. Together, these worksheets create a complete performance management system.
Let us explore each worksheet in detail.
Summary Page
The Summary Page works as the index or navigation hub of the dashboard.
Key Highlights of the Summary Page
- It acts as the first landing page
- It includes 6 navigation buttons
- Each button redirects users to a specific worksheet
- It improves usability and navigation speed
Because of this structure, users do not waste time searching for sheets. Instead, they move directly to the required section with a single click.
Click to buy Airline Catering KPI Dashboard in Excel
Dashboard Sheet
The Dashboard Sheet serves as the heart of the entire KPI dashboard.
Key Functionalities of the Dashboard Sheet
- Month selection drop-down available at cell D3
- Automatic refresh of all KPIs based on selected month
- Clear presentation of MTD (Month-to-Date) metrics
- Clear presentation of YTD (Year-to-Date) metrics
KPIs Displayed on the Dashboard
For each KPI, the dashboard displays:
MTD Metrics
- MTD Actual
- MTD Target
- MTD Previous Year
- Target vs Actual comparison
- Previous Year vs Actual comparison
YTD Metrics
- YTD Actual
- YTD Target
- YTD Previous Year
- Target vs Actual comparison
- Previous Year vs Actual comparison
Visual Performance Indicators
- Up arrows for positive performance
- Down arrows for negative performance
- Conditional formatting for quick interpretation
As a result, users can instantly identify strong-performing and underperforming KPIs without reading long reports.

Click to buy Airline Catering KPI Dashboard in Excel
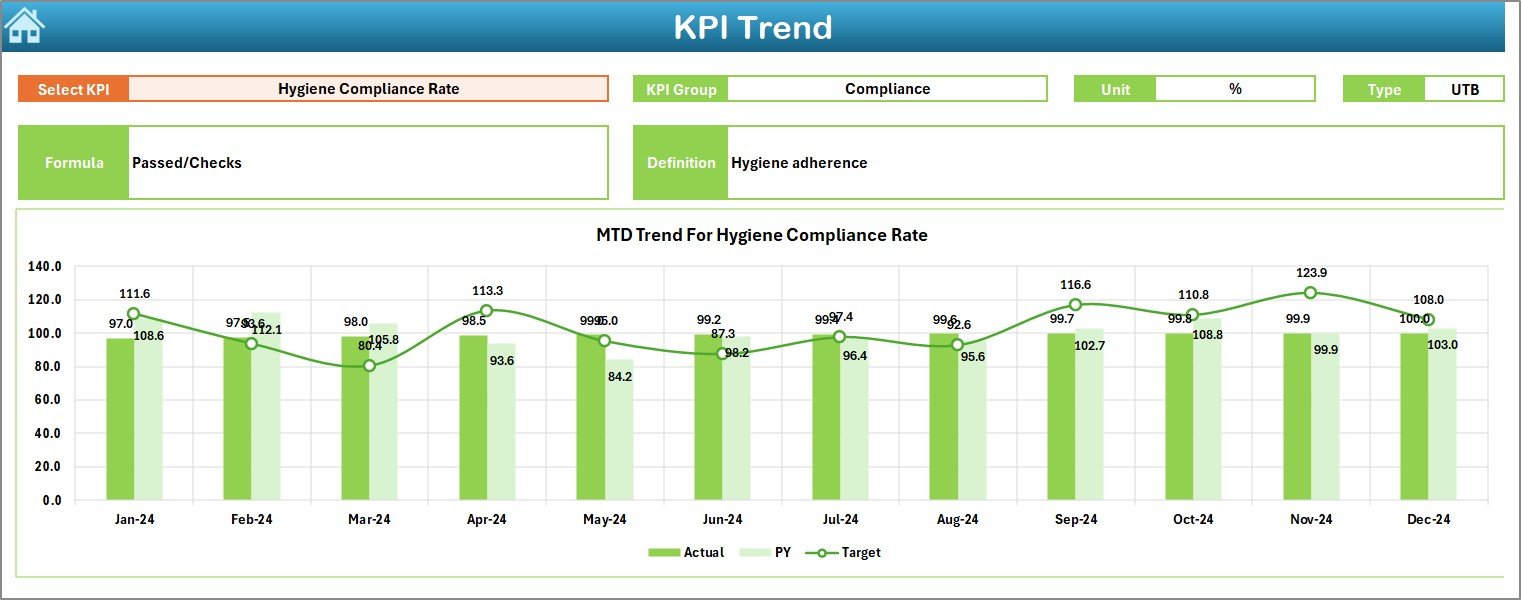
Trend Sheet
The Trend Sheet focuses on deep KPI-level analysis.
How to Use the Trend Sheet
- Select the KPI Name from the drop-down at cell C3
- View detailed KPI metadata and trends
KPI Details Displayed on the Trend Sheet
- KPI Group
- KPI Unit
- KPI Type (Lower the Better or Upper the Better)
- KPI Formula
- KPI Definition
Trend Charts Included
- MTD trend chart for Actual, Target, and Previous Year
- YTD trend chart for Actual, Target, and Previous Year
Because of these trend visuals, catering managers can easily identify seasonal patterns, recurring issues, and improvement trends.
Click to buy Airline Catering KPI Dashboard in Excel
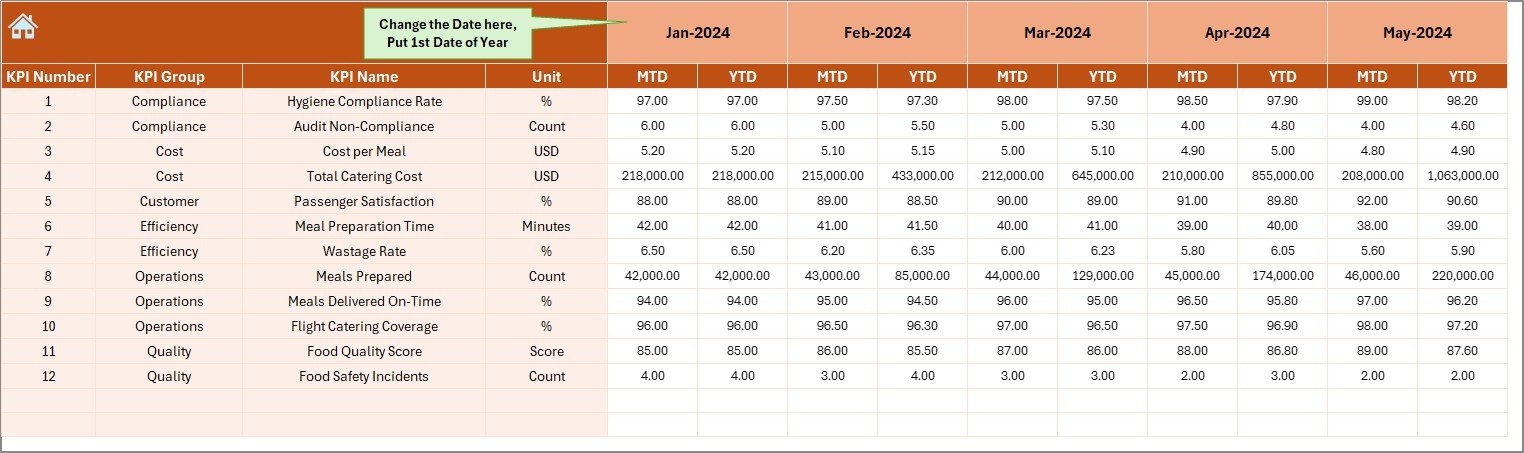
Actual Numbers Input Sheet
The Actual Numbers Input Sheet allows users to enter real performance data.
Key Features of the Actual Numbers Input Sheet
- Input MTD and YTD actual values
- Month selection available at cell E1
- Flexible month control by entering the first month of the year
- Structured and clean data entry layout
As a result, teams can update actual data quickly without breaking formulas or visuals.
Click to buy Airline Catering KPI Dashboard in Excel
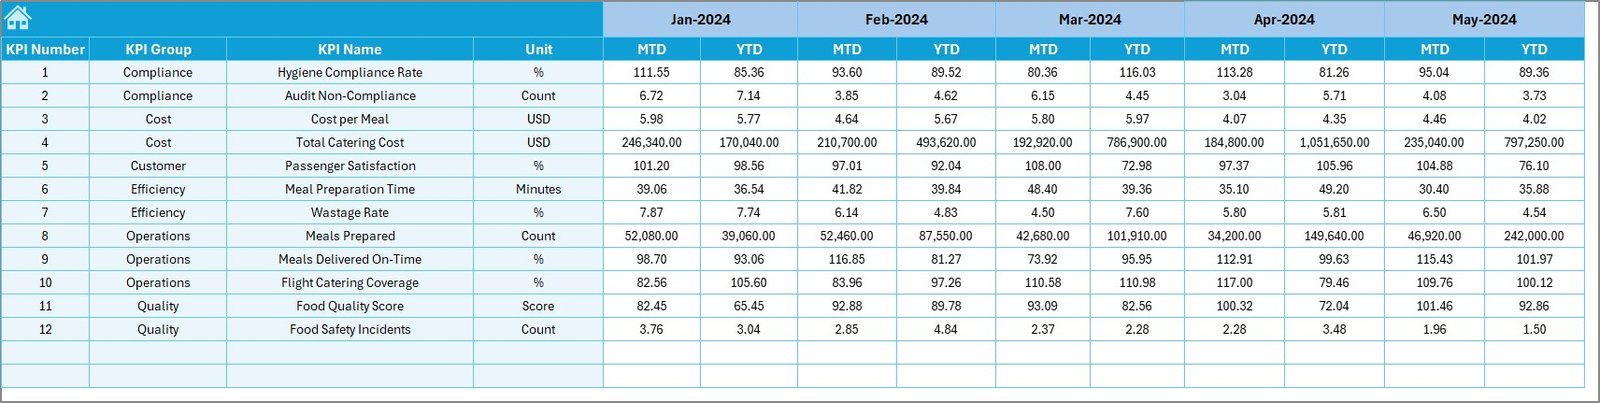
Target Sheet
The Target Sheet plays a critical role in performance planning and goal tracking.
Key Uses of the Target Sheet
- Enter monthly MTD targets for each KPI
- Enter cumulative YTD targets
- Align catering performance goals with airline objectives
Because targets exist alongside actuals, teams can measure progress clearly and objectively.
Click to buy Airline Catering KPI Dashboard in Excel
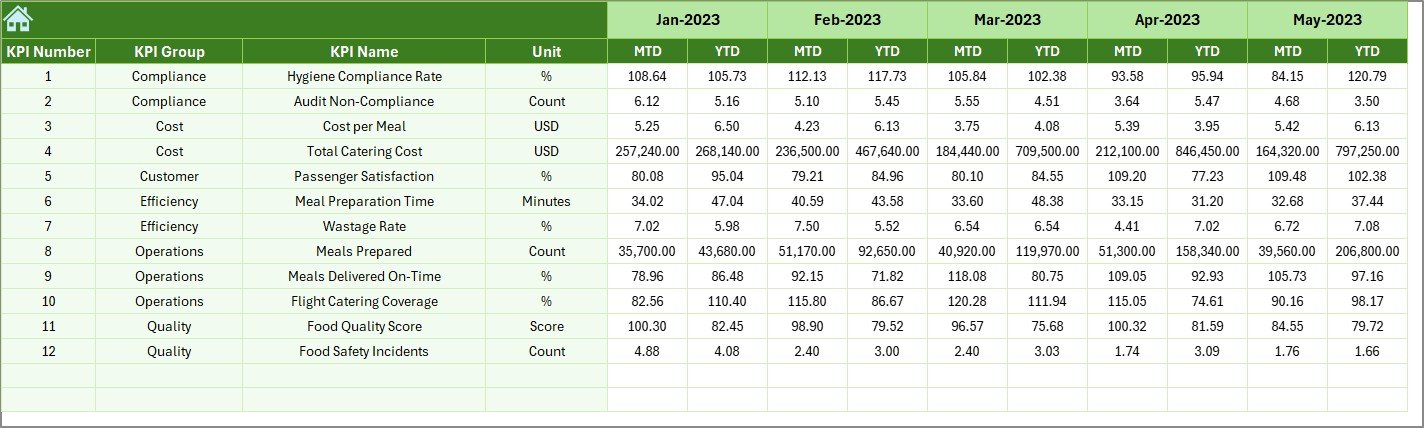
Previous Year Number Sheet
The Previous Year Number Sheet allows historical performance comparison.
Benefits of the Previous Year Sheet
- Enter previous year MTD data
- Enter previous year YTD data
- Enable year-over-year performance analysis
- Identify long-term improvement or decline
Because of this sheet, airline catering teams can track performance maturity over time.
Click to buy Airline Catering KPI Dashboard in Excel
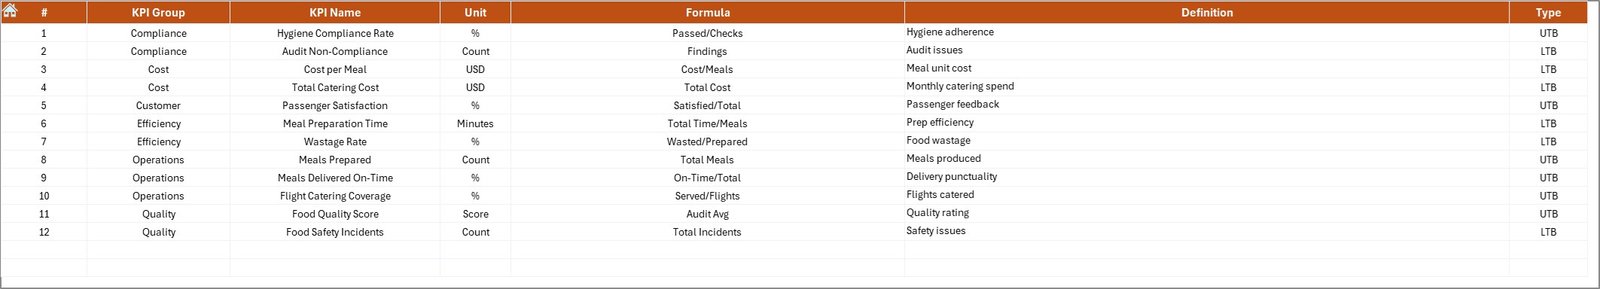
KPI Definition Sheet
The KPI Definition Sheet acts as the foundation of the entire dashboard.
Information Captured in the KPI Definition Sheet
- KPI Name
- KPI Group
- KPI Unit
- KPI Formula
- KPI Definition
This sheet ensures clarity, consistency, and standardization across teams. Moreover, new users can quickly understand what each KPI measures and why it matters.
What Are Typical KPIs Tracked in an Airline Catering KPI Dashboard?
An Airline Catering KPI Dashboard in Excel typically tracks KPIs such as:
- Meal delivery accuracy rate
- Catering cost per passenger
- Food waste percentage
- On-time catering delivery rate
- Customer satisfaction score
- Supplier defect rate
- Inventory turnover ratio
- Compliance and hygiene score
These KPIs help teams balance cost efficiency, quality, and service reliability.
Advantages of Airline Catering KPI Dashboard in Excel
Why Should Airlines Use This Dashboard?
The Airline Catering KPI Dashboard in Excel offers several strong advantages.
- Centralized Performance Monitoring
All KPIs remain available in one structured dashboard. Therefore, teams avoid confusion and duplication.
- Improved Decision-Making
Clear visuals and comparisons support faster and smarter decisions.
- Cost-Effective Solution
Excel-based dashboards avoid expensive BI tools while still delivering strong insights.
- Easy Customization
Teams can add, remove, or modify KPIs easily.
- Time-Saving Reporting
Automated calculations reduce manual reporting effort significantly.
- Enhanced Accountability
Targets and actuals create clear responsibility for performance outcomes.
Best Practices for the Airline Catering KPI Dashboard in Excel
How Can You Use This Dashboard Effectively?
Follow these best practices to maximize value.
- Define Clear KPIs
Always align KPIs with airline catering goals.
- Maintain Data Accuracy
Update actual, target, and previous year data consistently.
- Review Monthly Trends
Use the Trend Sheet to detect issues early.
- Use Visual Indicators Wisely
Do not overload the dashboard with unnecessary formatting.
- Train Users
Ensure team members understand KPI definitions and usage.
- Review Targets Regularly
Adjust targets based on operational realities and seasonality.
How Does This Dashboard Improve Airline Catering Operations?
This dashboard improves airline catering operations by:
- Highlighting inefficiencies quickly
- Reducing food waste and cost overruns
- Improving service consistency
- Supporting compliance and quality control
- Enhancing strategic planning
As a result, airlines achieve better operational stability and customer satisfaction.
Conclusion: Why Airline Catering KPI Dashboard in Excel Is a Must-Have Tool
An Airline Catering KPI Dashboard in Excel transforms raw operational data into meaningful insights. It provides clarity, structure, and control over catering performance across months and years.
Because the dashboard includes summary navigation, interactive KPIs, trend analysis, target tracking, and historical comparison, it supports both operational and strategic decision-making.
Therefore, airlines and catering service providers that adopt this dashboard gain a competitive advantage through data-driven excellence.
Frequently Asked Questions About Airline Catering KPI Dashboard in Excel
What is the main purpose of an Airline Catering KPI Dashboard in Excel?
The main purpose is to track, analyze, and improve catering performance using structured KPIs.
Can non-technical users use this dashboard?
Yes, Excel-based dashboards remain user-friendly and require no advanced technical skills.
How often should data be updated?
Teams should update data monthly to ensure accurate MTD and YTD analysis.
Can this dashboard support multiple airlines or catering units?
Yes, users can customize KPIs and data structures for different operations.
Does this dashboard replace BI tools?
While it does not fully replace enterprise BI tools, it offers a powerful and cost-effective alternative.
Can KPIs be customized?
Yes, users can modify KPIs easily using the KPI Definition Sheet.
Visit our YouTube channel to learn step-by-step video tutorials
Watch the step-by-step video tutorial:
Click to buy Airline Catering KPI Dashboard in Excel