Gym Fitness Business Dashboard in Power BI
Gym Fitness Business Dashboard in Power BI is a professionally designed, interactive analytics template built specifically for gym owners, fitness studio managers, health club operators, and personal training business owners who want to monitor every critical metric of their fitness business from one powerful dashboard. Whether you run a single gym or manage a multi-location fitness chain, this Power BI Dashboard Template transforms your raw gym data into stunning visual insights that drive smarter business decisions.
Click here to Purchase Gym Fitness Business Dashboard in Power BI
This template includes 5 interactive analysis pages — Overview, Membership Analysis, Revenue Breakdown, Member Engagement, and Acquisition & Retention — tracking 5 high-level KPIs: Total Revenue, Total PT Revenue, Total Operating Cost, Total Monthly Fees, and Profit Margin. With 16 dynamic charts and multiple interactive slicers, you get complete visibility into every aspect of your gym’s financial and operational health.
Key Features of Gym Fitness Business Dashboard in Power BI
- 5 Interactive Dashboard Pages — Overview, Membership Analysis, Revenue Breakdown, Member Engagement, and Acquisition & Retention cover every dimension of gym business analytics.
- 5 High-Level KPI Cards — Track Total Revenue, Total PT Revenue, Total Operating Cost, Total Monthly Fees, and Profit Margin at a glance on the Overview page.
- 16 Dynamic Charts — Revenue trends, membership distribution, class popularity, referral source tracking, satisfaction scores, operating costs, and profitability insights across all 5 pages.
- Interactive Slicers and Filters — Apply quick filters on every page to drill down by membership type, location, class type, referral source, and time period.
- Multi-Location Support — Compare performance across multiple gym branches to identify top-performing and underperforming locations.
- Membership Revenue Tracking — Separate analysis of monthly membership fees and personal training revenue by type and location.
- Member Satisfaction Monitoring — Track average satisfaction scores by membership type to improve retention strategies.
- Plug-and-Play Power BI File — Simply open the .pbix file in Power BI Desktop, replace sample data, and refresh to see your own gym analytics.
Dashboard Pages Explained
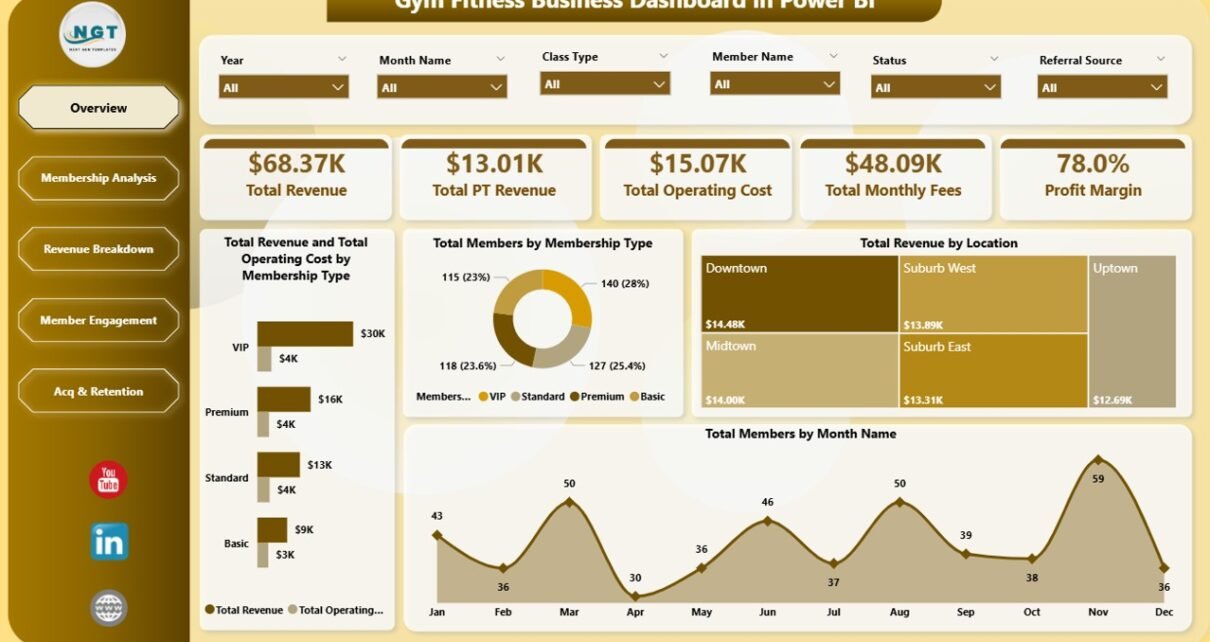
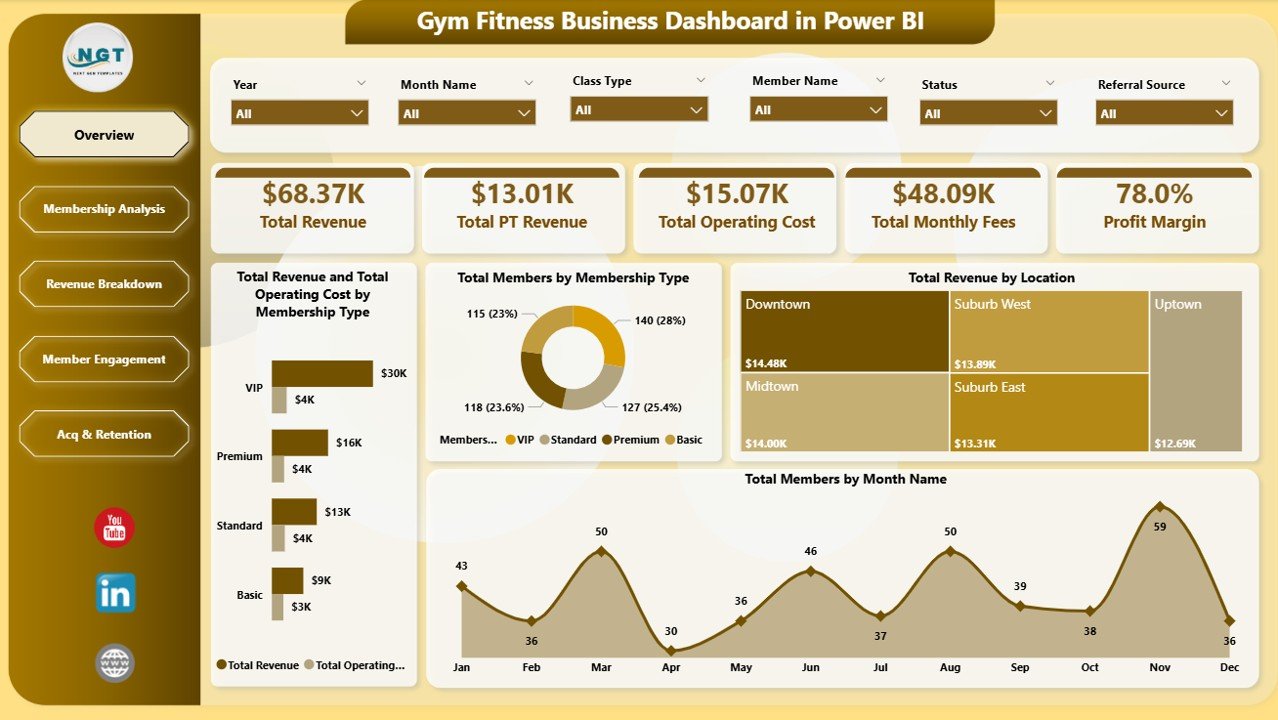
1. Overview Page
The Overview page serves as the command center for your gym business. At the top, 5 KPI cards display Total Revenue, Total PT Revenue, Total Operating Cost, Total Monthly Fees, and Profit Margin — giving you an instant snapshot of financial health. Below the cards, 4 interactive charts deliver critical analysis: Total Revenue and Total Operating Cost by Membership Type allows you to compare income against expenses across different membership tiers to identify your most profitable segments. Total Members by Membership Type shows the distribution of your member base so you can understand which plans are most popular. Total Revenue by Location breaks down earnings across your gym branches, and Total Members by Month Name reveals membership enrollment trends over time, helping you spot seasonal patterns and growth opportunities.
Gym Fitness Business Dashboard in Power BI
2. Membership Analysis
The Membership Analysis page dives deep into how your different membership tiers and locations contribute to revenue. It features 3 targeted charts: Total Monthly Fees and Total PT Revenue by Membership Type compares recurring membership income against personal training revenue across each tier, helping you understand the total value each membership category generates. Total Monthly Fees and Total PT Revenue by Location breaks down these same revenue streams by gym branch so you can see which locations drive the most membership and training income. Avg Satisfaction by Membership Type reveals which membership tiers have the happiest members — a critical metric for predicting retention and designing better membership packages.
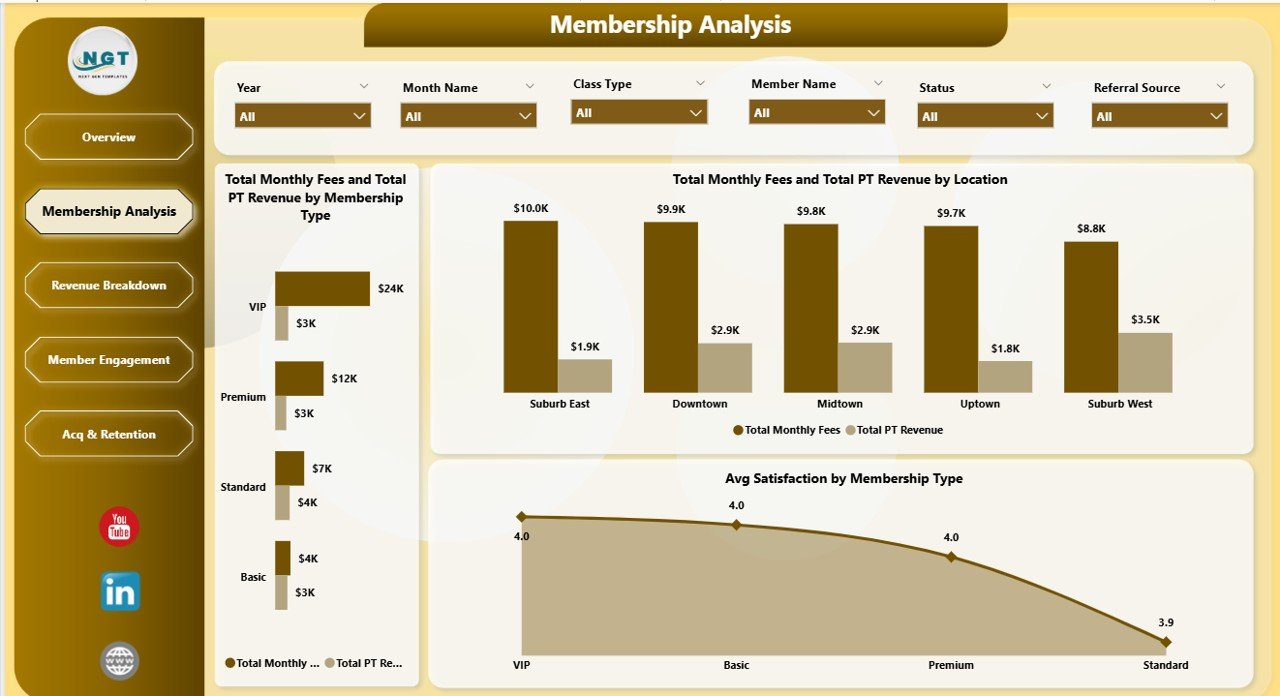
Membership Analysis
3. Revenue Breakdown
The Revenue Breakdown page helps you understand exactly where your money comes from. It includes 3 insightful charts: Total Revenue by Class Type shows which fitness classes — such as yoga, HIIT, spinning, or strength training — generate the most income, helping you optimize your class schedule and instructor allocation. Total Revenue by Referral Source reveals which marketing channels bring in the highest-paying members, guiding your advertising budget decisions. Active Members by Class Type helps you understand class popularity and capacity utilization so you can balance demand across your offerings.
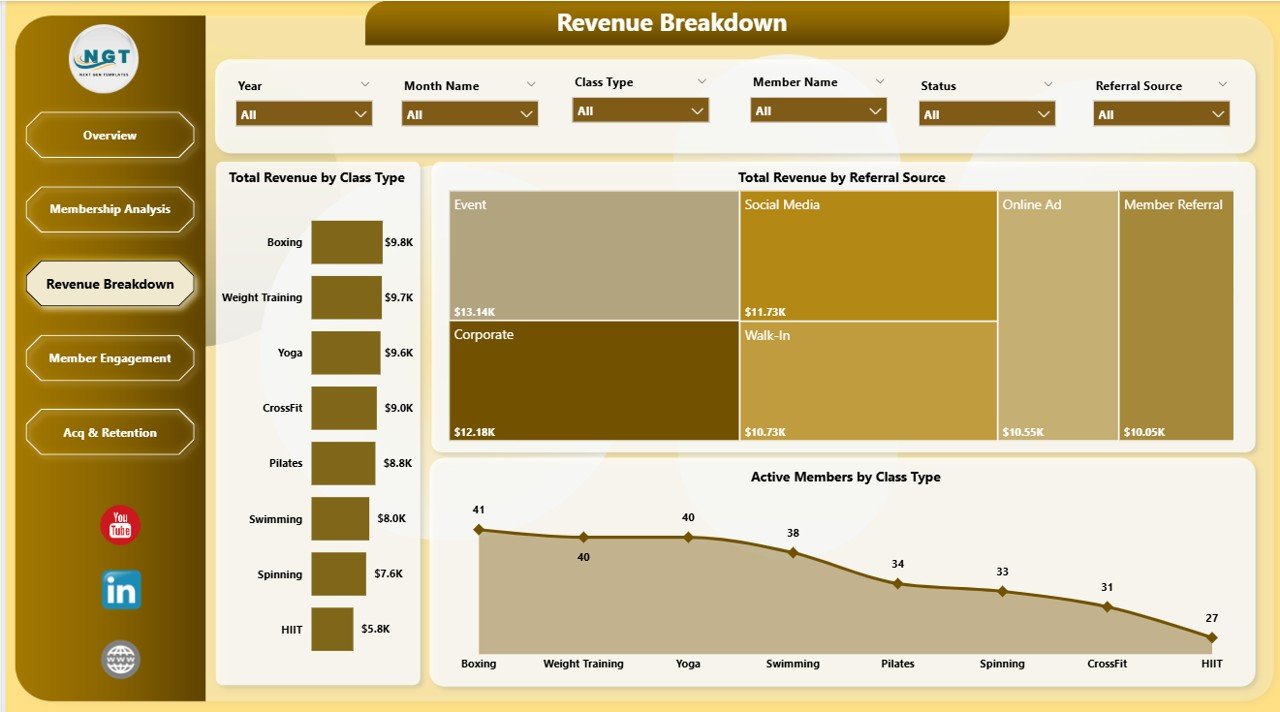
Revenue Breakdown
4. Member Engagement
The Member Engagement page focuses on understanding how engaged and satisfied your members are across different dimensions. It features 3 powerful charts: Total Revenue by Location compares earnings across different gym branches to identify which locations generate the most engagement-driven revenue. Avg Satisfaction by Membership Type measures member happiness at each tier, providing actionable insights for improving service quality. Active Members by Referral Source shows which acquisition channels bring the most engaged, long-term members — helping you invest more in high-quality lead sources.
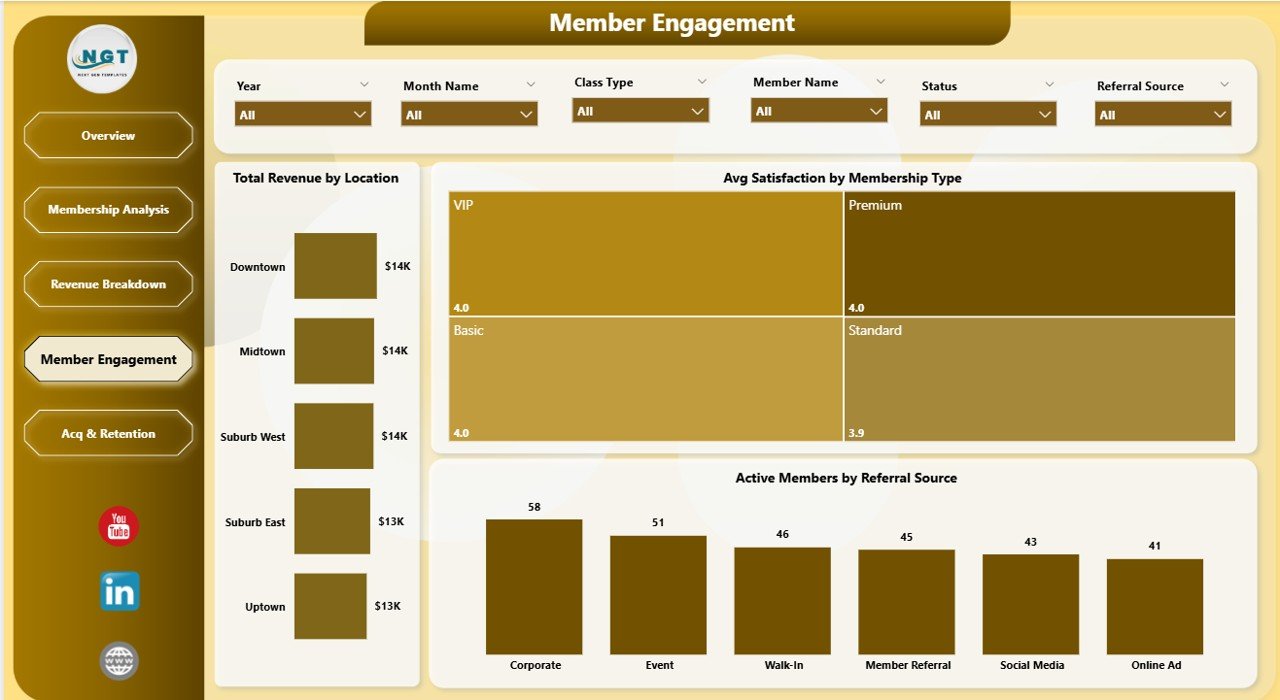
Member Engagement
5. Acquisition & Retention
The Acquisition & Retention page evaluates your cost structure and profitability trends over time. It includes 3 key charts: Total Operating Cost by Location helps you identify which gym branches cost the most to operate so you can optimize expenses. Total Monthly Fees by Location shows the recurring revenue each branch generates, and when compared with operating costs, reveals true branch-level profitability. Profit Margin by Month Name tracks your overall profitability trend over time to help you spot seasonal dips and plan strategies to maintain healthy margins year-round.
Click here to Purchase Gym Fitness Business Dashboard in Power BI
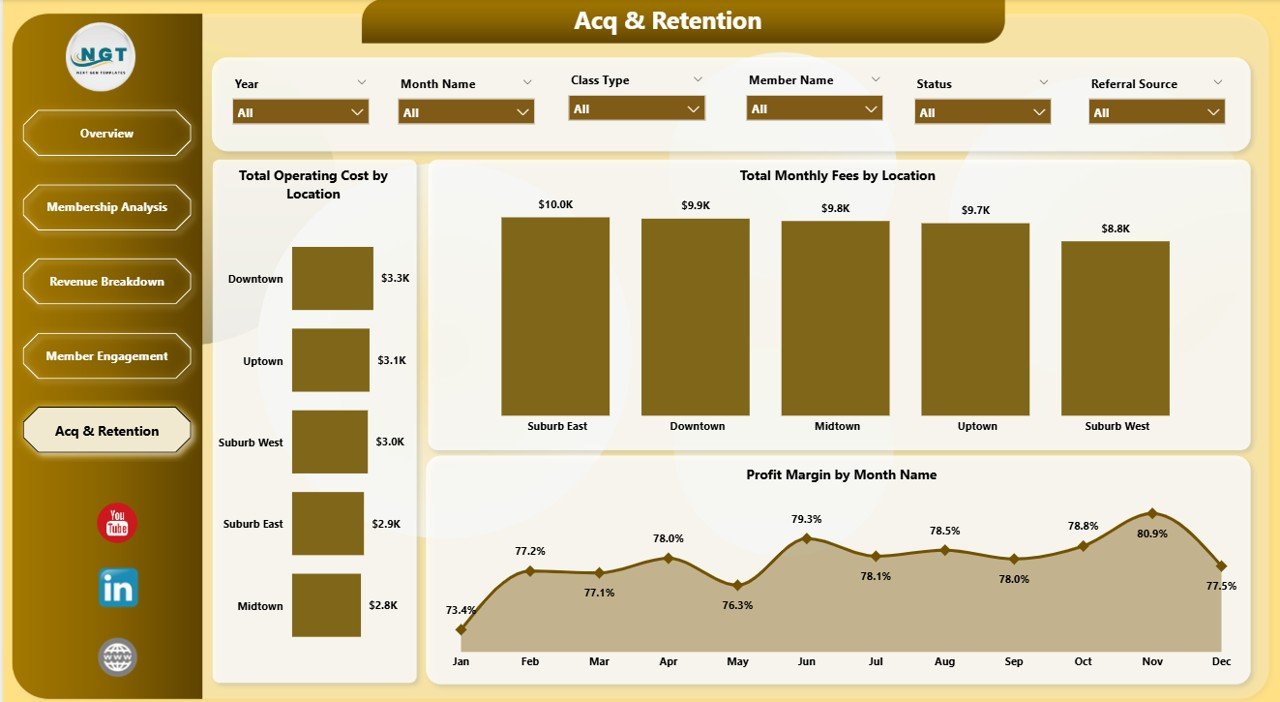
Acquisition & Retention
Advantages of Gym Fitness Business Dashboard in Power BI
- Complete Business Visibility — Five dedicated pages cover every angle from high-level KPIs to granular membership and revenue analysis, eliminating the need for multiple disconnected reports.
- Data-Driven Decision Making — With 16 interactive charts and real-time slicers, you can quickly answer critical questions like which membership tier is most profitable, which location needs attention, and which referral sources deliver the best ROI.
- Multi-Location Comparison — If you operate multiple gym branches, this dashboard makes it easy to compare revenue, costs, member satisfaction, and profitability across all locations in one view.
- Time-Saving Automation — Once connected to your data source, all charts and KPIs refresh automatically. No manual spreadsheet work needed.
- Professional Presentation — The polished design makes it easy to share insights with business partners, investors, or franchise stakeholders.
Opportunities for Improvement
- Add Churn Rate Tracking — Including a dedicated member churn rate metric would help gym owners proactively identify retention risks before they impact revenue.
- Include Class Attendance Rates — Adding attendance vs. capacity utilization metrics for each class type would help optimize scheduling and instructor allocation.
- Revenue Forecasting — A predictive analytics page using historical trends to forecast future revenue would add significant strategic planning value.
- Personal Trainer Performance — Individual trainer revenue and satisfaction tracking would help identify top-performing staff and coaching opportunities.
Best Practices for Using This Gym Dashboard
- Update Data Regularly — Refresh your data weekly or monthly to keep all KPIs and charts current for timely decision-making.
- Use Slicers Strategically — Filter by specific locations, membership types, or time periods to drill into problem areas and identify hidden opportunities.
- Share with Stakeholders — Publish the dashboard to Power BI Service so managers at each location can access insights from their browser or mobile device.
- Set KPI Targets — Establish monthly or quarterly targets for Total Revenue, Profit Margin, and Member Satisfaction to benchmark your gym’s performance.
- Combine with Other Templates — Use this alongside the Gym Fitness Business Dashboard in Excel for offline analysis or the Fitness Studios Dashboard in Power BI for specialized fitness studio metrics.
Explore Relevant Templates
- Gym Fitness Business Dashboard in Excel — The Excel version with pivot tables, slicers, and automated charts for Microsoft Excel users.
- Fitness Studios Dashboard in Power BI — Track fitness studio KPIs including class attendance, instructor performance, and revenue analytics.
- CrossFit Gym KPI Scorecard in Excel — Monitor CrossFit-specific KPIs with MTD, YTD, and target comparisons.
- Fitness Industry KPI Scorecard in Google Sheets — Cloud-based KPI tracking for fitness businesses in Google Sheets.
- Sports Equipment Manufacturing KPI Dashboard in Power BI — Track manufacturing KPIs for sports equipment businesses.
Frequently Asked Questions
What is the best Power BI template for gym business analytics?
The Gym Fitness Business Dashboard in Power BI is one of the best templates available for gym business analytics. It includes 5 interactive pages covering overview metrics, membership analysis, revenue breakdown, member engagement, and acquisition and retention — giving gym owners a complete operational picture with 16 dynamic charts and 5 high-level KPI cards.
How do I track gym membership revenue in Power BI?
The Gym Fitness Business Dashboard in Power BI tracks membership revenue through dedicated charts showing Total Monthly Fees and Total PT Revenue by Membership Type and by Location. The Overview page also displays Total Revenue and Total Monthly Fees as KPI cards for instant visibility into your membership income.
Can I use this gym dashboard for multiple locations?
Yes. The dashboard is specifically designed for multi-location gym businesses. Multiple charts break down revenue, operating costs, monthly fees, member satisfaction, and active members by location, making it easy to compare branch-level performance and identify top-performing locations.
Do I need Power BI Pro to use this template?
No. You can open and use this .pbix file with the free Power BI Desktop application from Microsoft. Power BI Pro is only needed if you want to publish the dashboard to the cloud and share it with other users through Power BI Service.
What KPIs does this gym dashboard track?
The dashboard tracks 5 primary KPIs: Total Revenue, Total PT Revenue, Total Operating Cost, Total Monthly Fees, and Profit Margin. Beyond these top-level metrics, it provides detailed analysis across membership types, locations, class types, referral sources, and monthly trends through 16 interactive charts spread across 5 dashboard pages.
How do I replace the sample data with my own gym data?
Open the .pbix file in Power BI Desktop, go to Transform Data or Home tab, and connect your own data source such as an Excel file or database. Map your columns to match the existing data structure, then click Refresh All. All 5 dashboard pages will update automatically with your real gym business data.
Click here to Purchase Gym Fitness Business Dashboard in Power BI
Conclusion
The Gym Fitness Business Dashboard in Power BI is a must-have tool for any gym owner or fitness business manager who wants to move beyond guesswork and make data-driven decisions. With 5 interactive pages, 5 KPI cards, 16 dynamic charts, and powerful slicers, this template gives you everything you need to monitor revenue, track memberships, analyze class performance, measure member engagement, and optimize profitability across all your gym locations.
Click here to Purchase Gym Fitness Business Dashboard in Power BI
Visit our YouTube channel for step-by-step video tutorials: Youtube.com/@PK-AnExcelExpert