Alternative medicine continues to grow rapidly across the globe. As more patients choose holistic treatments, wellness centers, clinics, and practitioners must manage performance more carefully than ever. However, many alternative medicine organizations still rely on scattered Excel sheets, manual reports, and delayed summaries. As a result, leaders often struggle to track progress, compare results, and make timely decisions.
That is exactly where an Alternative Medicine KPI Dashboard in Power BI becomes a powerful solution.
In this in-depth and SEO-friendly guide, you will learn what an Alternative Medicine KPI Dashboard in Power BI is, why it matters, how it works, and how each dashboard page supports smarter decisions. Moreover, this article explains advantages, best practices, implementation steps, and frequently asked questions so you can confidently use this dashboard in real-world alternative healthcare operations.
Click to buy Alternative Medicine KPI Dashboard in Power BI
What Is an Alternative Medicine KPI Dashboard in Power BI?
An Alternative Medicine KPI Dashboard in Power BI is a ready-to-use, interactive performance reporting tool designed to track, analyze, and visualize key metrics related to holistic healthcare services.
Instead of switching between multiple spreadsheets for actuals, targets, and historical comparisons, this dashboard brings everything into one centralized view. Because the dashboard runs on Power BI and uses Excel as a data source, it remains flexible, familiar, and highly scalable.
More importantly, this dashboard helps clinic owners, wellness managers, and healthcare administrators:
- Monitor operational and clinical KPIs in real time
- Compare actual performance against targets
- Analyze trends across months and years
- Identify areas that need immediate attention
- Support data-driven strategic planning
As a result, decision-making becomes faster, clearer, and more confident.
Why Do Alternative Medicine Organizations Need KPI Dashboards?
Alternative medicine focuses on personalized care, long-term outcomes, and patient trust. Therefore, performance tracking must remain consistent and transparent. However, manual reporting often creates delays and errors.
A KPI dashboard solves these challenges because it:
- Centralizes all KPIs in one place
- Eliminates manual calculations
- Improves visibility across services and time periods
- Supports accountability and continuous improvement
Moreover, when leadership sees performance clearly, they can align clinical quality with financial sustainability.
How Does the Alternative Medicine KPI Dashboard in Power BI Work?
The dashboard uses Power BI Desktop for visualization and an Excel file as its data source. You only need to update the Excel sheets, and Power BI automatically refreshes all visuals.
Because of this design, even non-technical users can maintain the dashboard easily. At the same time, analysts can extend it further if required.
What Pages Are Available in the Alternative Medicine KPI Dashboard?
The dashboard contains three structured and purpose-driven pages. Each page plays a unique role in performance monitoring.
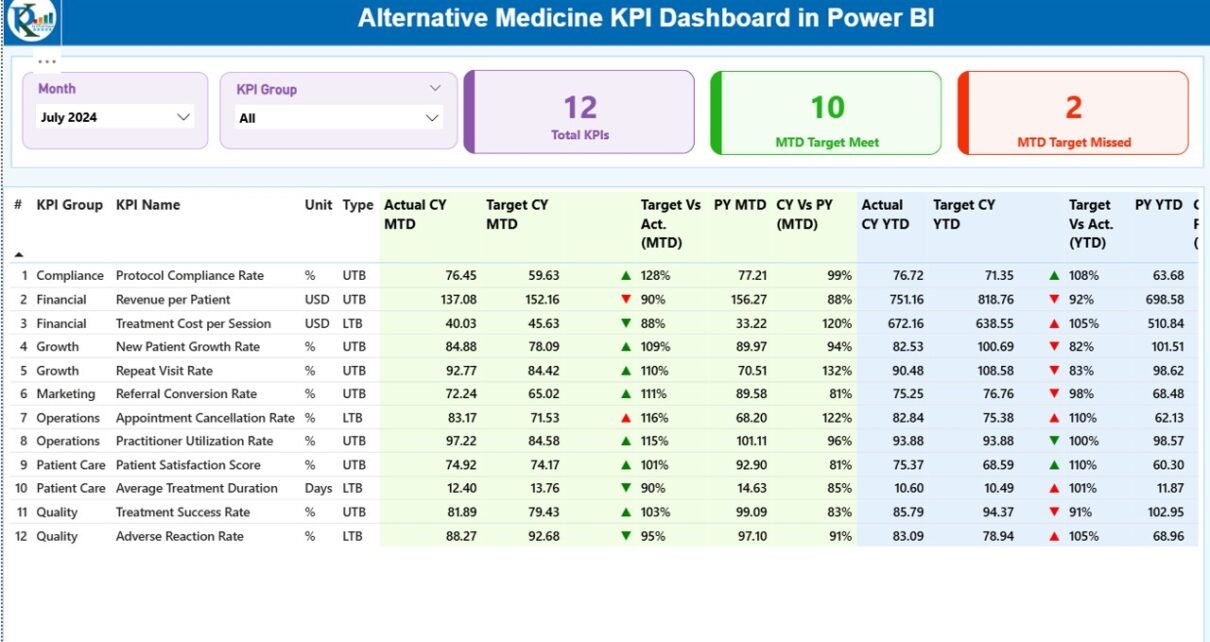
Summary Page
The Summary Page serves as the main landing page of the dashboard. It provides a high-level overview of all KPIs at a glance.
Key Elements of the Summary Page
At the top of the page, you will find interactive slicers that allow quick filtering:
- Month slicer to analyze specific periods
- KPI Group slicer to focus on selected KPI categories
Below the slicers, the dashboard displays three important KPI cards:
- Total KPIs Count
- MTD Target Met Count
- MTD Target Missed Count
These cards immediately highlight overall performance status.

Click to buy Alternative Medicine KPI Dashboard in Power BI
KPI Table
The detailed KPI table forms the core of the Summary Page. It displays comprehensive KPI-level insights using clearly defined columns.
KPI Identification Columns
- KPI Number – Sequential number for easy reference
- KPI Group – Category or group of the KPI
- KPI Name – Name of the KPI
- Unit – Measurement unit (%, count, hours, etc.)
- Type – KPI type:
LTB (Lower the Better)
UTB (Upper the Better)
Month-to-Date (MTD) Performance Columns
Actual CY MTD – Current year actual MTD value
Target CY MTD – Current year target MTD value
MTD Icon –
▲ Green arrow for target met
▼ Red arrow for target missed
Target vs Actual (MTD) – Percentage calculated as:
Actual MTD / Target MTD
PY MTD – Previous year MTD value
CY vs PY (MTD) – Percentage comparison between current and previous year MTD
Year-to-Date (YTD) Performance Columns
Actual CY YTD – Current year actual YTD value
Target CY YTD – Current year target YTD value
YTD Icon – Visual indicator of YTD performance
Target vs Actual (YTD) – Percentage calculated as:
Actual YTD / Target YTD
PY YTD – Previous year YTD value
CY vs PY (YTD) – Percentage comparison between current and previous year YTD
Because of this structure, users can analyze performance deeply without leaving the main page.
KPI Trend Page
The KPI Trend Page focuses on time-based analysis. It helps users understand how each KPI performs over time.
Key Features of the KPI Trend Page
Two combo charts that display:
Current Year Actuals
Previous Year Actuals
Targets
Separate views for MTD trends and YTD trends
- KPI Name slicer on the left to select a specific KPI
As a result, users can easily spot patterns, seasonality, and long-term improvements or declines.

Click to buy Alternative Medicine KPI Dashboard in Power BI
KPI Definition Page
The KPI Definition Page acts as a drill-through reference page. It remains hidden by default to keep the dashboard clean.
From the Summary Page, users can drill through to this page to view:
- KPI Formula
- KPI Definition
- Measurement Unit
- KPI Type (LTB or UTB)
This feature ensures clarity and consistency across teams. Moreover, it reduces confusion and improves KPI governance.
To return to the main dashboard, users simply click the Back button available at the top-left corner.

Click to buy Alternative Medicine KPI Dashboard in Power BI
What Excel Data Is Required for the Dashboard?
The dashboard uses an Excel file with three mandatory worksheets. These sheets act as the single source of truth.
Input_Actual Sheet
In this sheet, users enter actual KPI values.
Required columns include:
- KPI Name
- Month (use the first date of the month)
- MTD Value
- YTD Value
Input_Target Sheet
This sheet stores target values.
Required columns include:
- KPI Name
- Month (use the first date of the month)
- Target MTD Value
- Target YTD Value
KPI Definition Sheet
This sheet defines the structure of each KPI.
Required fields include:
- KPI Number
- KPI Group
- KPI Name
- Unit
- Formula
- Definition
- Type (LTB or UTB)
Once users update these sheets, Power BI automatically refreshes all visuals.
Advantages of Alternative Medicine KPI Dashboard in Power BI
Using a KPI dashboard delivers several strategic and operational benefits.
Key Advantages
- Centralized performance monitoring
- Real-time visibility into KPIs
- Clear comparison of Actual vs Target
- Strong historical analysis with CY vs PY views
- Reduced manual effort and reporting errors
- Better accountability across teams
- Improved strategic planning and forecasting
Because of these advantages, alternative medicine organizations can scale sustainably while maintaining quality care.
Who Should Use This Dashboard?
This dashboard supports a wide range of roles, including:
- Alternative medicine clinic owners
- Wellness center managers
- Holistic healthcare administrators
- Operations and quality managers
- Strategy and planning teams
Moreover, consultants and analysts can customize it further for client-specific needs.
Best Practices for the Alternative Medicine KPI Dashboard in Power BI
To get maximum value from the dashboard, follow these best practices.
Data Management Best Practices
- Update Excel data consistently every month
- Use standardized KPI definitions
- Validate data before refreshing Power BI
Dashboard Usage Best Practices
- Review Summary Page daily or weekly
- Use Trend Page for monthly and quarterly reviews
- Drill through KPI definitions when discrepancies arise
Governance Best Practices
- Assign KPI ownership
- Review targets annually
- Align KPIs with clinical and business goals
By following these practices, organizations can ensure long-term dashboard success.
How Does This Dashboard Improve Decision-Making?
Clear visuals remove ambiguity. As a result, leaders can:
- Identify underperforming KPIs quickly
- Take corrective action earlier
- Allocate resources effectively
- Improve patient outcomes and satisfaction
Therefore, decisions move from assumptions to insights.
Conclusion
The Alternative Medicine KPI Dashboard in Power BI transforms raw data into actionable intelligence. It provides clarity, structure, and confidence for decision-makers in holistic healthcare organizations. With its intuitive design, Excel-based data input, and powerful Power BI visuals, this dashboard simplifies performance management without sacrificing depth.
When organizations track what truly matters, they improve both care quality and operational efficiency. This dashboard makes that possible.
Frequently Asked Questions (FAQs)
What is an Alternative Medicine KPI Dashboard in Power BI?
It is an interactive reporting solution that tracks and visualizes key alternative medicine performance metrics using Power BI and Excel.
Can non-technical users maintain this dashboard?
Yes. Users only need to update Excel sheets. Power BI handles all calculations and visuals automatically.
Does the dashboard support MTD and YTD analysis?
Yes. It provides detailed MTD and YTD metrics along with target comparisons and historical analysis.
Can I customize KPIs for my clinic?
Yes. You can add, modify, or remove KPIs directly from the Excel data source.
Is this dashboard suitable for small clinics?
Yes. The design scales easily, making it suitable for both small clinics and large wellness organizations.
Visit our YouTube channel to learn step-by-step video tutorials
Watch the step-by-step video tutorial:
Click to buy Alternative Medicine KPI Dashboard in Power BI