Amazon FBA Seller Dashboard in Excel is a comprehensive analytics template built for Amazon FBA sellers who want complete visibility into their revenue, profitability, customer behavior, and marketplace performance. Whether you run a single-product store or manage hundreds of ASINs across multiple Amazon marketplaces, this dashboard gives you instant insights through 5 interactive pages, 15+ dynamic charts, and real-time KPI cards — all powered by pivot tables that update with a single click.
If you are an Amazon seller looking for the best way to track your FBA business in Excel, this template eliminates the need for expensive third-party tools. Simply paste your sales data, hit Refresh All, and watch as every chart and metric updates automatically. From revenue trends and profit margins to refund rates and PPC spend analysis, this Amazon FBA Dashboard Excel template covers every critical aspect of your seller business.
Key Features of Amazon FBA Seller Dashboard in Excel
This Amazon FBA Seller Dashboard in Excel is packed with features designed to help sellers make data-driven decisions. Here are the standout capabilities that make this template a must-have for any Amazon FBA business:
- 5 Interactive Dashboard Pages — Overview, Sales Analysis, Marketplace Insights, Profitability, and Customer Metrics provide a 360-degree view of your Amazon FBA operations.
- Real-Time KPI Cards — The Overview page displays 5 key metrics at a glance: Total Records, Total Revenue, Total Net Profit, Refund Rate, and Average Customer Rating.
- 15+ Dynamic Charts — Visualize revenue by month, fulfillment method, marketplace, and product category with professionally designed charts that update automatically.
- Interactive Slicers — Filter the entire dashboard by month, category, fulfillment method, and marketplace with one click.
- Multi-Marketplace Comparison — Compare performance across Amazon US, UK, Canada, Germany, and other marketplaces side by side.
- PPC Spend and Amazon Fees Tracking — Monitor your advertising costs and platform fees to understand true profitability.
- Pivot Table Architecture — All charts are powered by pivot tables in the Support Sheet, ensuring fully dynamic and auto-refreshing analytics.
- No VBA or Macros Required — Works with standard Excel features; compatible with Excel 2016+ on Windows and Mac.
Dashboard Pages Explained
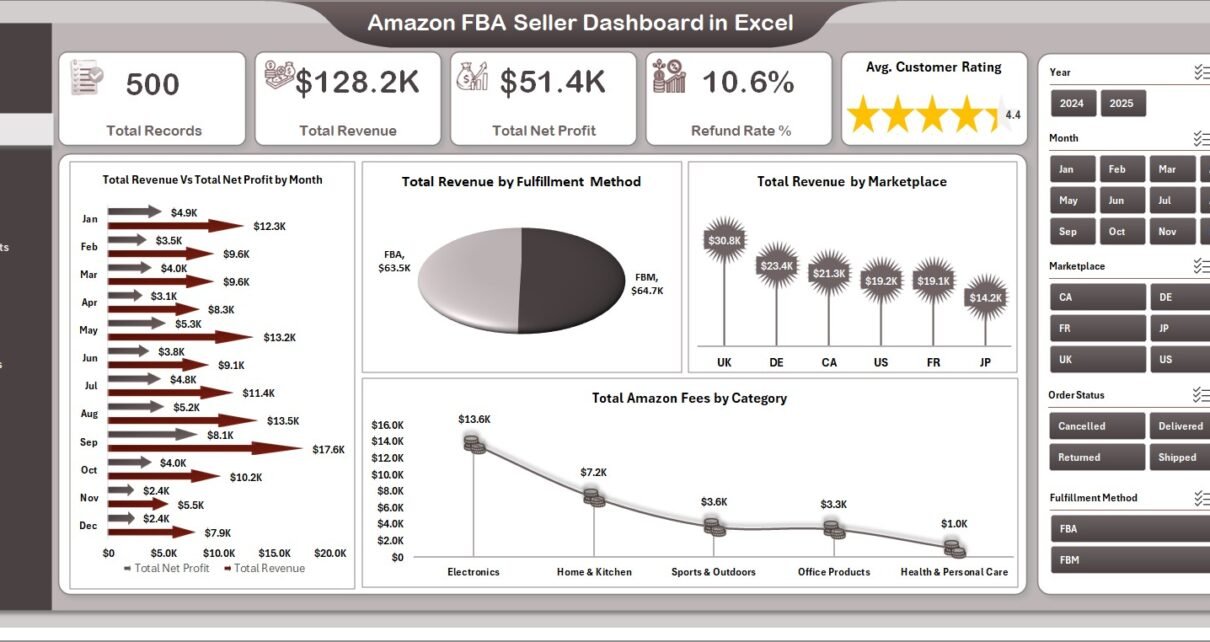
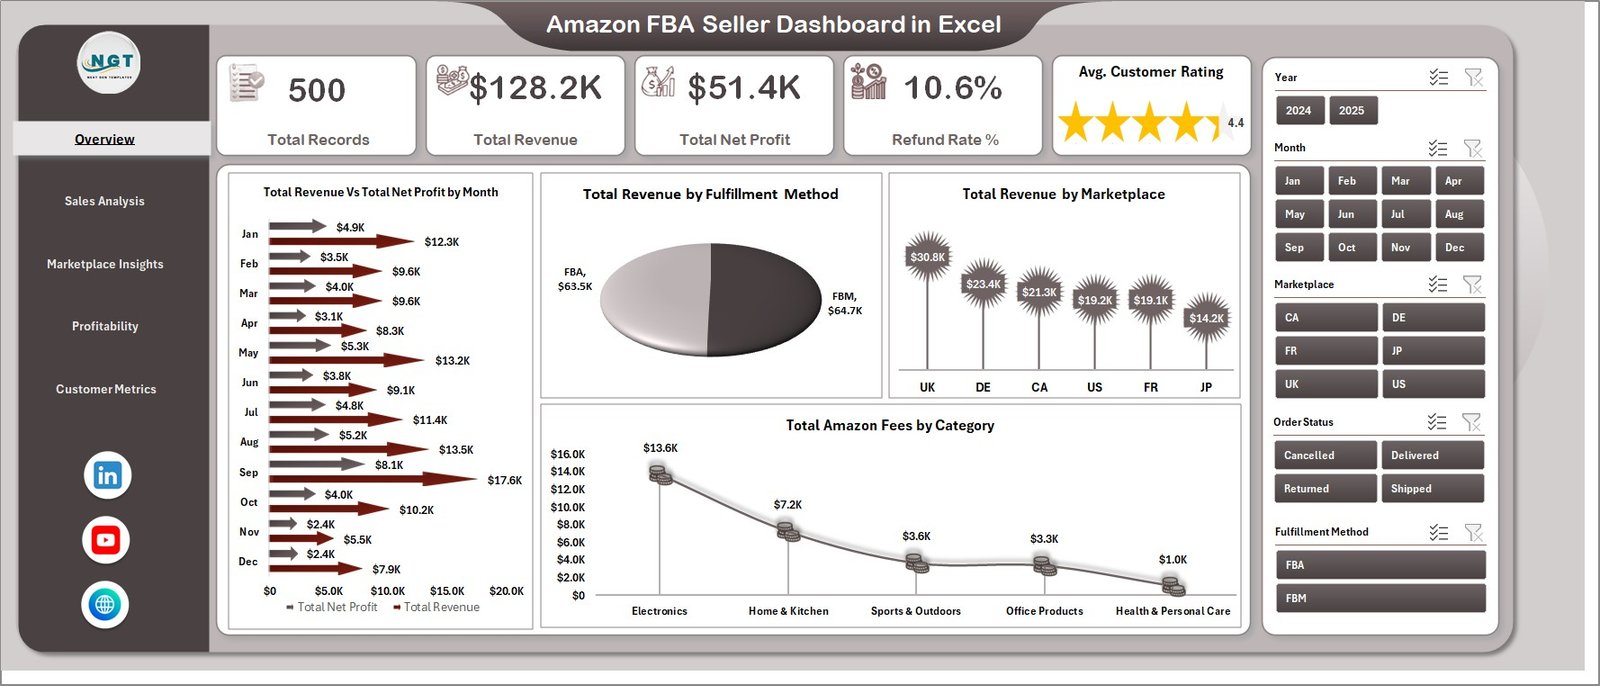
1. Overview Page
The Overview page is your command center for Amazon FBA analytics. At the top, you will find 5 KPI cards displaying Total Records, Total Revenue, Total Net Profit, Refund Rate, and Average Customer Rating. These cards give you an instant snapshot of your overall business health.
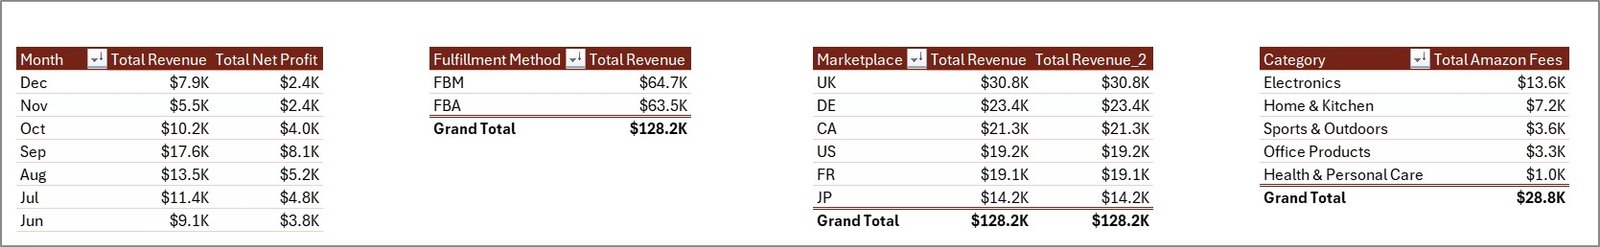
Below the KPI cards, you will find 4 powerful charts that break down your performance from different angles. Total Revenue Vs Total Net Profit by Month helps you track monthly profitability trends and identify seasonal patterns. Total Revenue by Fulfillment Method shows how your FBA and FBM channels compare. Total Revenue by Marketplace reveals which Amazon marketplaces generate the most sales. Total Amazon Fees by Category lets you monitor how much Amazon charges you across different product categories.
Multiple slicers are available on this page, allowing you to filter the entire dashboard by specific criteria. This means you can quickly isolate performance data for a particular month, category, fulfillment method, or marketplace.
Amazon FBA Seller Dashboard in Excel
2. Sales Analysis
The Sales Analysis page dives deeper into your revenue and product performance. Here you can explore Total Revenue by Top Five Product Name to identify your best-selling products. The Total Revenue Vs Total Net Profit by Fulfillment Method chart helps you understand which fulfillment channel delivers better margins. Profit Margin % by Month reveals how your margins fluctuate over time, while Avg. Customer Rating by Category shows which product categories receive the highest customer satisfaction scores.
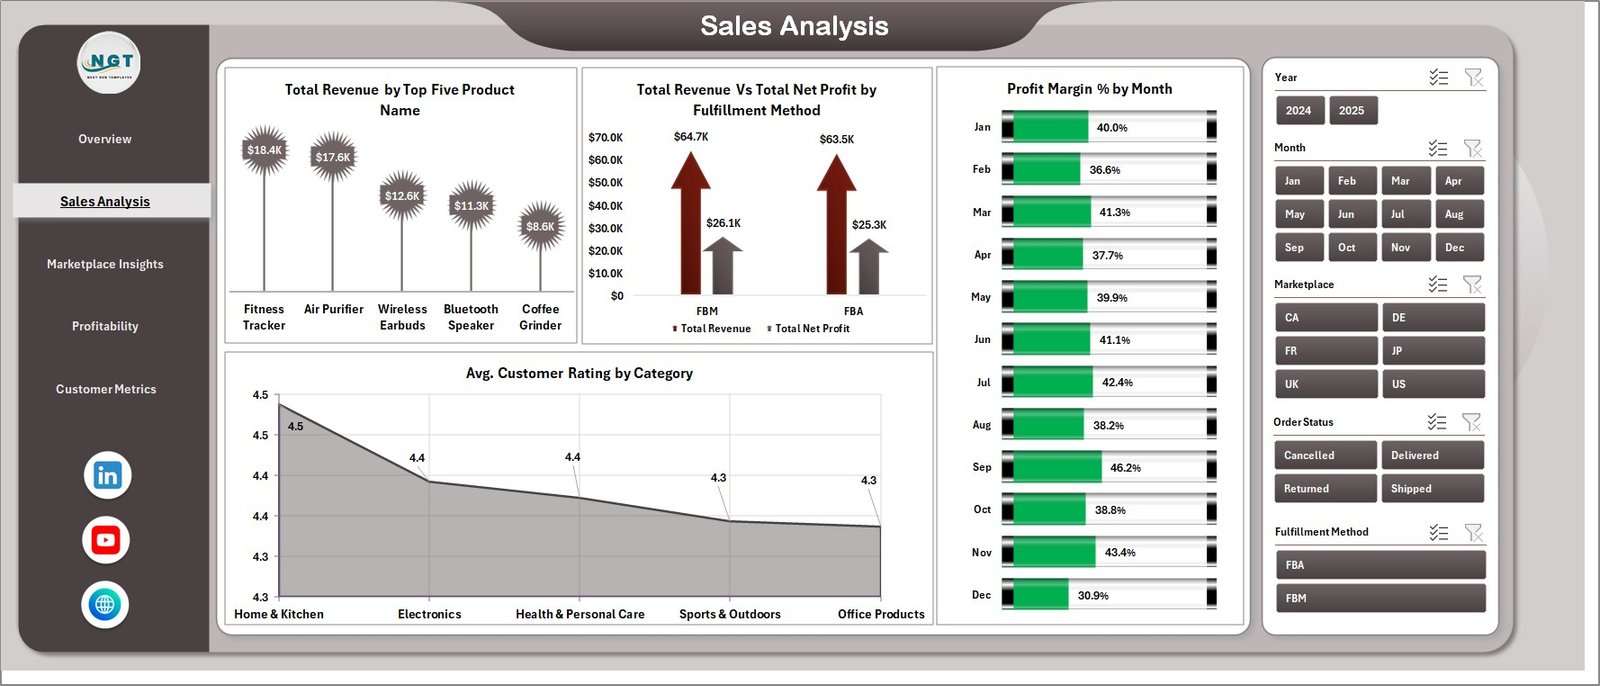
Sales Analysis
3. Marketplace Insights
The Marketplace Insights page is dedicated to comparing your performance across different Amazon marketplaces. It features Total Net Profit by Marketplace, Total Units Sold by Marketplace, Total PPC Spend Vs Total Amazon Fees by Marketplace, and Avg. Order Value by Marketplace. This page is essential for sellers operating in multiple regions who need to understand where their money is being made — and where it is being spent.
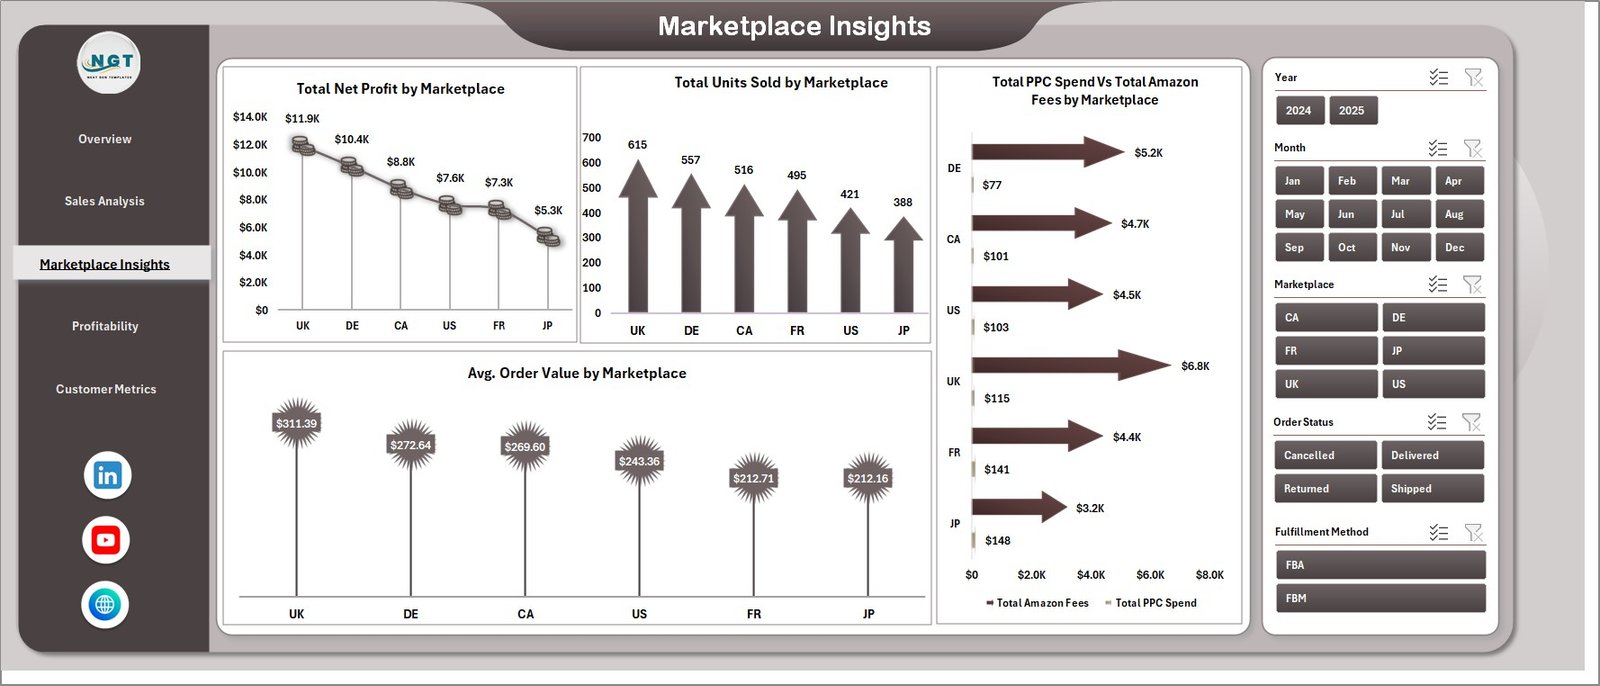
Marketplace Insights
4. Profitability
The Profitability page focuses entirely on your bottom line. Total Net Profit by Category reveals which product categories contribute most to your profits. Total Net Profit by Fulfillment Method shows whether FBA or FBM is more profitable for your business. Total Net Profit by Month tracks your profit trends over time, and Profit Margin % by Top Five Product Name highlights which specific products deliver the highest margins.
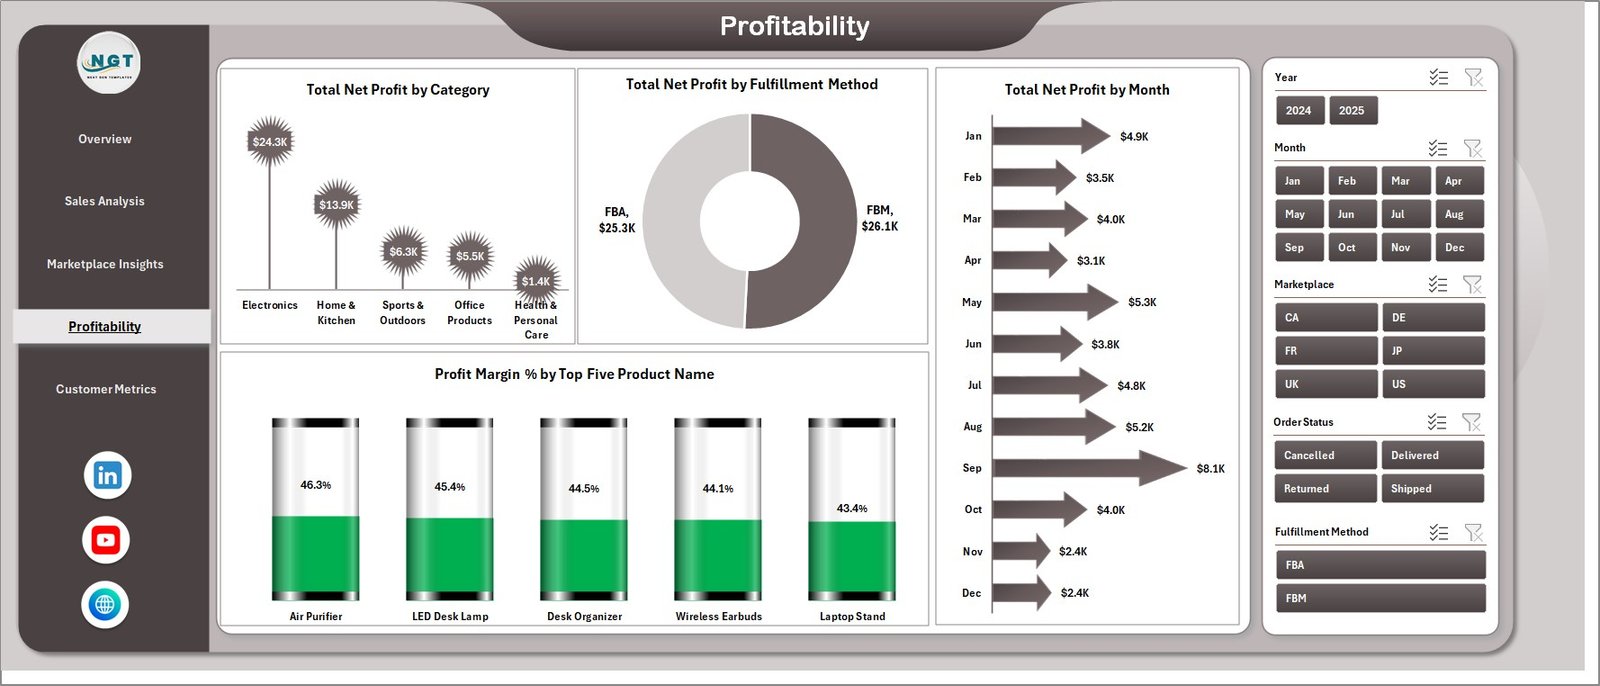
Profitability
5. Customer Metrics
The Customer Metrics page helps you understand your buyers better. Total Units Sold by Category shows which categories move the most volume. Refund Rate % by Month tracks how refund trends change over time, helping you identify quality or listing issues early. Avg. Customer Rating by Marketplace reveals how customer satisfaction varies across different Amazon regions.
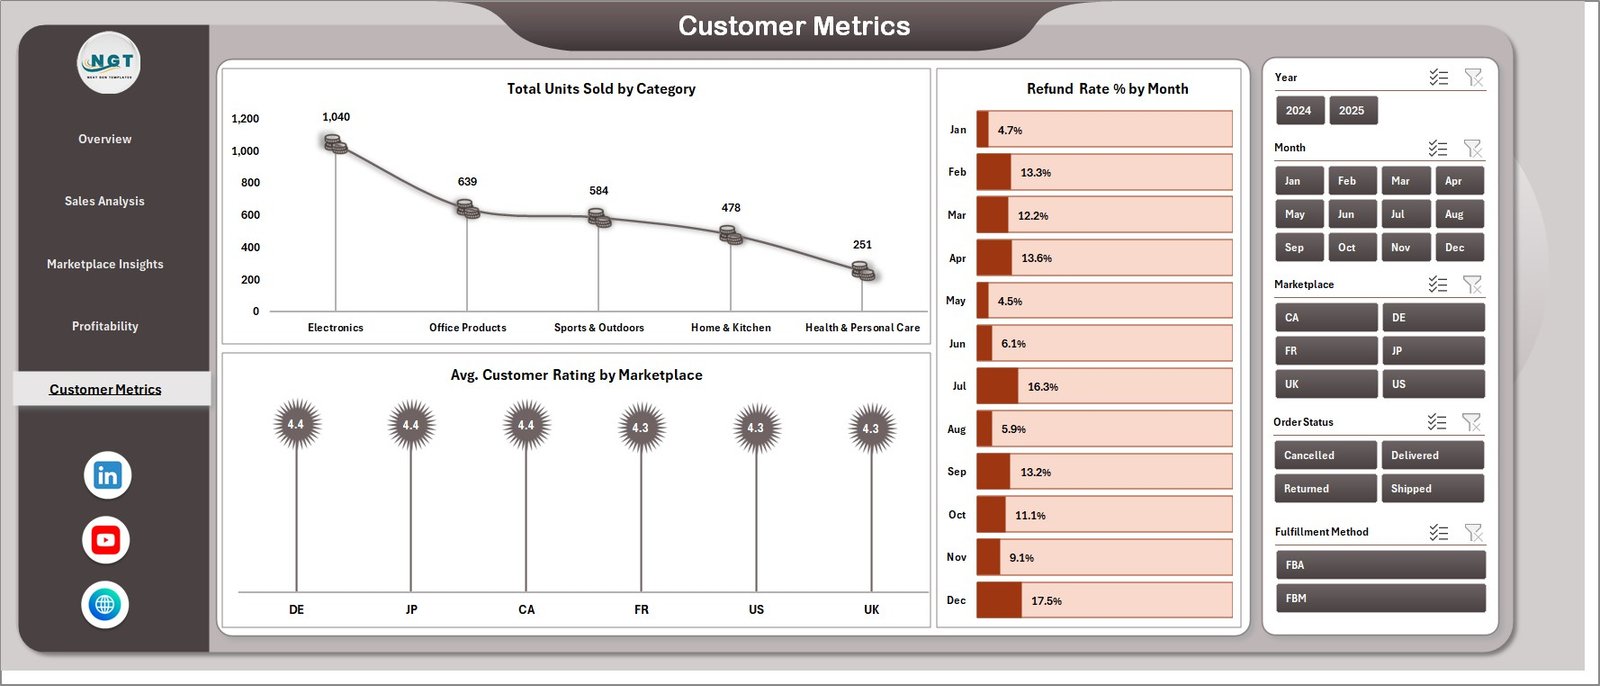
Customer Metrics
6. Data Sheet
The Data Sheet is where you enter all your Amazon FBA sales data. Simply replace the sample records with your actual data in the same column format. The dashboard is designed to work with fields like Order Date, Product Name, Category, Marketplace, Fulfillment Method, Revenue, Net Profit, Amazon Fees, PPC Spend, Units Sold, Customer Rating, and Refund Status. Once your data is in place, all you need to do is refresh the pivot tables.

Data Sheet Tab
7. Support Sheet
The Support Sheet contains multiple pivot tables that power every chart and KPI card across the dashboard. After updating your data in the Data Sheet, navigate to the Data tab in the Excel Ribbon and click Refresh All. Every pivot table will recalculate, and all 15+ charts will update automatically. You can keep this sheet hidden during everyday use — it works entirely behind the scenes.
Support Sheet Tab
Advantages of Amazon FBA Seller Dashboard in Excel
- Eliminates expensive third-party tools — Get comprehensive Amazon analytics without monthly subscription fees.
- Complete business visibility — Track revenue, profit, fees, PPC spend, refunds, and customer ratings in one file.
- Multi-marketplace support — Compare performance across all Amazon regions instantly.
- One-click refresh — Update your entire dashboard by clicking Refresh All after adding new data.
- Professional presentation-ready — Share polished reports with partners, investors, or team members.
- Fully customizable — Add new charts, modify existing ones, or extend the data model to fit your specific needs.
Opportunities for Improvement
- Add an Inventory Tracking page to monitor stock levels, reorder points, and days of supply by product.
- Include a PPC Campaign Performance breakdown with ACOS, ROAS, and impression data for advertising optimization.
- Add a Returns Analysis section to track return reasons and identify products with quality issues.
- Integrate a Competitor Price Tracking sheet to benchmark your pricing against market averages.
Best Practices for Using This Dashboard
- Update data weekly — Regular data entry ensures your charts always reflect the latest performance.
- Use slicers strategically — Filter by marketplace first, then by category to identify region-specific trends.
- Monitor refund rates closely — A rising refund rate by month may indicate listing accuracy or product quality issues.
- Compare FBA vs FBM margins — Use the Profitability page to determine which fulfillment method delivers better returns.
- Export charts for reports — Copy charts directly into PowerPoint presentations for business reviews.
- Keep the Support Sheet hidden — This prevents accidental edits to the pivot tables that power the dashboard.
Explore Relevant Templates
If you found this Amazon FBA Seller Dashboard useful, you may also want to explore these related templates from NextGenTemplates.com:
- Etsy Seller Analytics Dashboard in Excel — Track your Etsy shop metrics with a similar multi-page dashboard layout.
- Online Marketplaces Dashboard in Excel — A versatile dashboard for sellers operating across multiple e-commerce platforms.
- Online Marketplaces KPI Dashboard in Excel — Focus on key performance indicators across your marketplace businesses.
- Online Marketplaces KPI Scorecard in Excel — A scorecard-style template for monitoring marketplace KPIs at a glance.
- E-Commerce Sales Performance Dashboard in Google Sheets — Prefer Google Sheets? Try this cloud-based alternative for e-commerce analytics.
Browse the full collection of Excel Dashboard Templates and Sales & Marketing Templates on NextGenTemplates.com.
Frequently Asked Questions
What is the best Excel template for tracking Amazon FBA sales?
The Amazon FBA Seller Dashboard in Excel is one of the best templates for tracking FBA sales. It includes 5 interactive dashboard pages covering revenue analysis, marketplace insights, profitability, and customer metrics with 15+ dynamic charts and real-time KPI cards. You can download it from NextGenTemplates.com.
How do I track Amazon FBA profit margins in Excel?
This dashboard includes dedicated Profit Margin % charts on both the Sales Analysis and Profitability pages. The Profit Margin % by Month chart shows how your margins change over time, while Profit Margin % by Top Five Product Name identifies your most and least profitable products. All calculations are automatic once you enter your data.
Can I compare Amazon FBA and FBM performance with this dashboard?
Yes. The dashboard includes charts for Total Revenue by Fulfillment Method and Total Net Profit by Fulfillment Method, letting you directly compare FBA versus FBM performance in terms of both revenue and profitability.
Do I need to know pivot tables to use this Amazon FBA dashboard?
No. The pivot tables are pre-built in the Support Sheet and work behind the scenes. You simply enter data in the Data Sheet, click Refresh All in the Data tab, and the entire dashboard updates. No pivot table knowledge is needed.
How do I track Amazon PPC spend and advertising costs in Excel?
The Marketplace Insights page includes a Total PPC Spend Vs Total Amazon Fees by Marketplace chart that shows your advertising costs alongside platform fees for each marketplace. This helps you understand the true cost of selling on each Amazon region.
Is this Amazon FBA dashboard compatible with Excel on Mac?
Yes. The Amazon FBA Seller Dashboard works on both Windows and Mac versions of Microsoft Excel 2016 or later. For the best experience with slicers and pivot charts, use the desktop version rather than Excel Online.
Conclusion
The Amazon FBA Seller Dashboard in Excel is a powerful, affordable, and easy-to-use analytics solution for Amazon sellers of all sizes. With 5 interactive pages, 15+ charts, real-time KPI cards, and interactive slicers, it provides everything you need to track revenue, analyze profitability, compare marketplaces, and monitor customer behavior — all without expensive third-party software.
🛒 Click here to Purchase Amazon FBA Seller Dashboard in Excel
🎥 Watch step-by-step video tutorials on our YouTube channel:
👉 Youtube.com/@PK-AnExcelExpert