Financial institutions face increasing pressure to detect suspicious transactions and prevent financial crimes. Banks, fintech companies, and regulatory bodies must monitor millions of transactions daily. However, many organizations still rely on manual reports and disconnected systems. As a result, compliance teams struggle to identify risks quickly.
Therefore, companies now adopt data-driven AML solutions. One of the most powerful tools is the Anti-Money Laundering (AML) Dashboard in Power BI.
In this detailed guide, you will learn everything about this dashboard, including its features, benefits, best practices, and use cases. Moreover, you will understand how it improves compliance efficiency and reduces financial risks.
Click to Purchases Anti-Money Laundering (AML) Dashboard in Power BI
What is an Anti-Money Laundering (AML) Dashboard in Power BI?
An AML Dashboard in Power BI is an interactive analytics tool designed to monitor suspicious financial activities, track alerts, and measure compliance performance.
It collects data from multiple systems and transforms it into visual insights. As a result, compliance teams can easily analyze trends, identify risks, and take action.
With this dashboard, organizations can:
-
Monitor suspicious transactions in real time
-
Track alerts and investigation progress
-
Measure compliance performance
-
Analyze risk levels across customers and regions
-
Improve regulatory reporting
Because Power BI offers dynamic visuals and real-time updates, decision-makers gain better control over financial risks.
Why Do Organizations Need an AML Dashboard?
Money laundering activities continue to evolve. Therefore, organizations must stay proactive.
However, without a proper dashboard:
-
Alerts become difficult to manage
-
Investigations take longer
-
Data remains scattered
-
Compliance reporting becomes inefficient
As a result, organizations face penalties and reputational damage.
Key Reasons to Use an AML Dashboard
-
It centralizes all AML data
-
It improves visibility of suspicious activities
-
It speeds up investigations
-
It enhances reporting accuracy
-
It supports faster decision-making
Therefore, an AML dashboard becomes essential for modern compliance teams.
Key Features of the Anti-Money Laundering (AML) Dashboard in Power BI
This dashboard includes 5 powerful pages. Each page provides a different perspective of AML data.
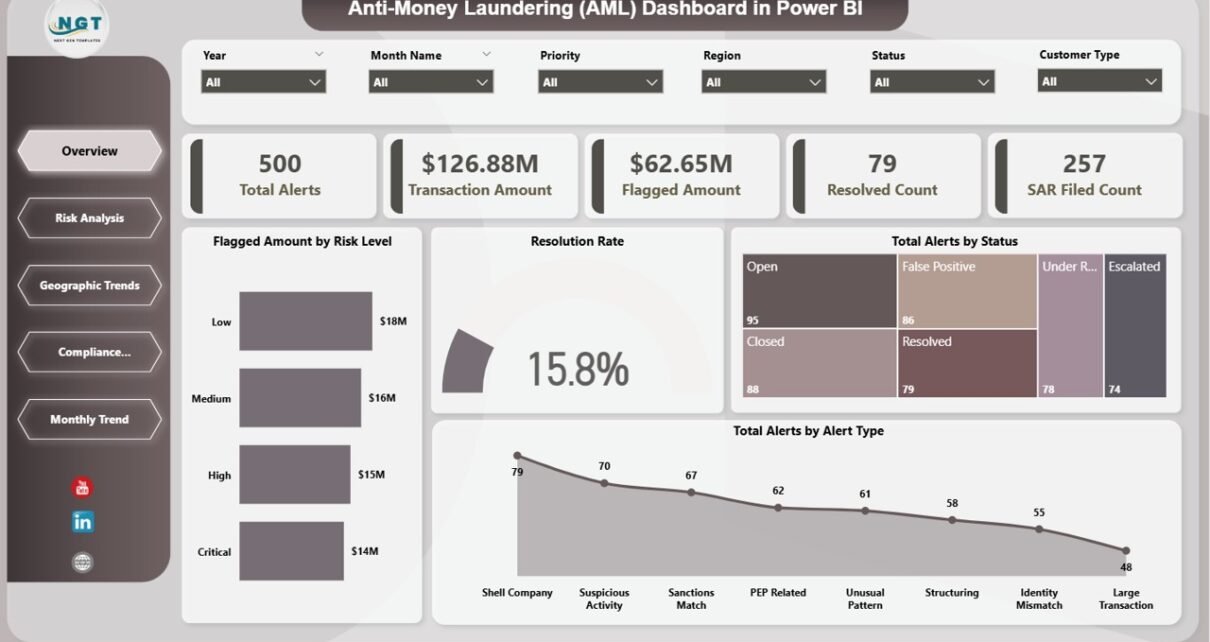
1. Overview Page – Complete AML Snapshot
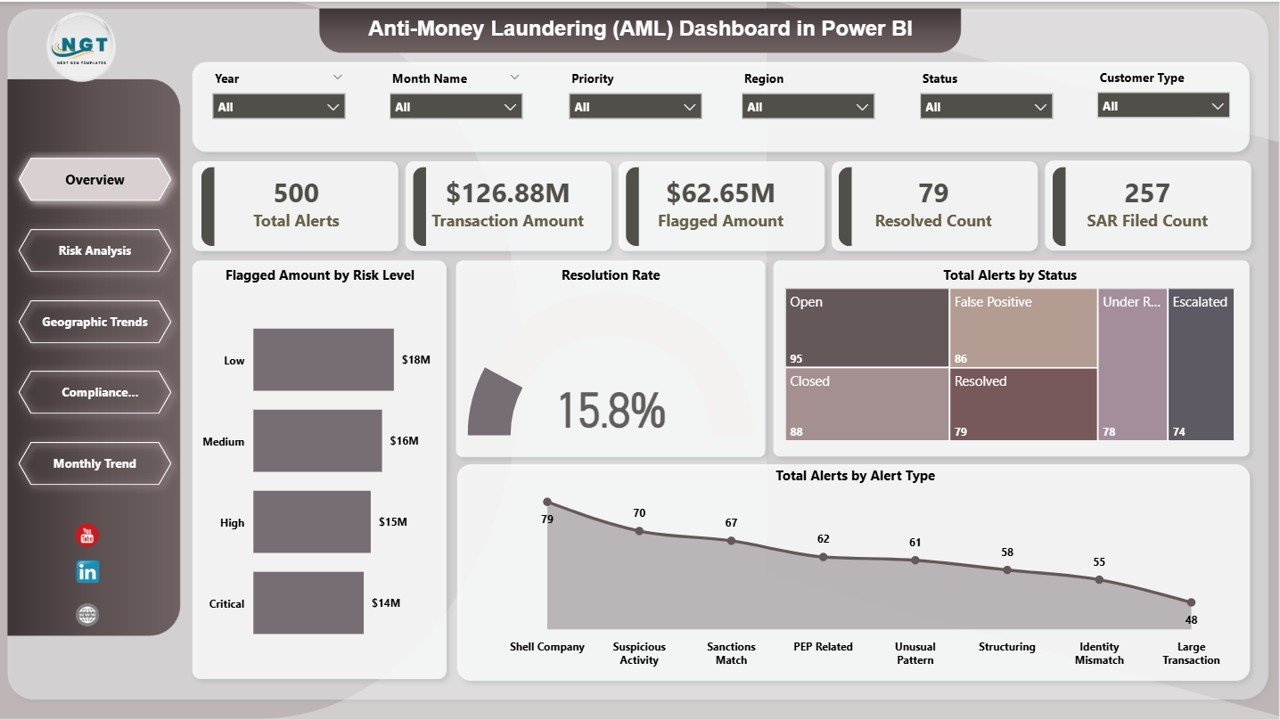
The Overview Page provides a high-level summary of AML performance.
Key KPI Cards:
-
🚨 Total Alerts
-
💰 Transaction Amount
-
⚠️ Flagged Amount
-
✅ Resolved Count
-
📄 SAR Filed Count
Charts Included:
-
📊 Resolution Rate
-
📊 Total Alerts by Alert Type
-
📊 Total Alerts by Status
-
📊 Flagged Amount by Risk Level
Because of this page, users can instantly understand the compliance situation.
2. Risk Analysis – Identify High-Risk Transactions
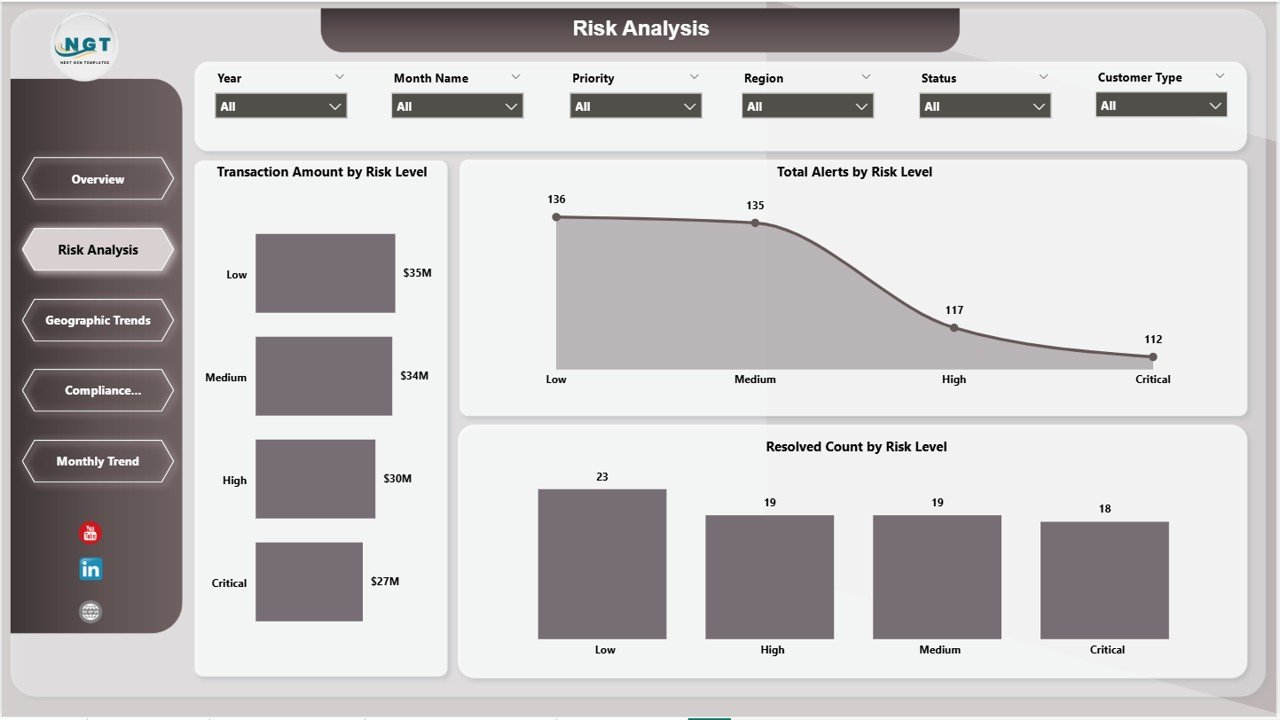
The Risk Analysis Page helps identify risk exposure across transactions.
Charts Included:
-
📊 Transaction Amount by Risk Level
-
📊 Total Alerts by Risk Level
-
📊 Resolved Count by Risk Level
This page allows teams to focus on high-risk activities and prioritize investigations.
3. Geographic Trends Analysis – Regional Risk Insights
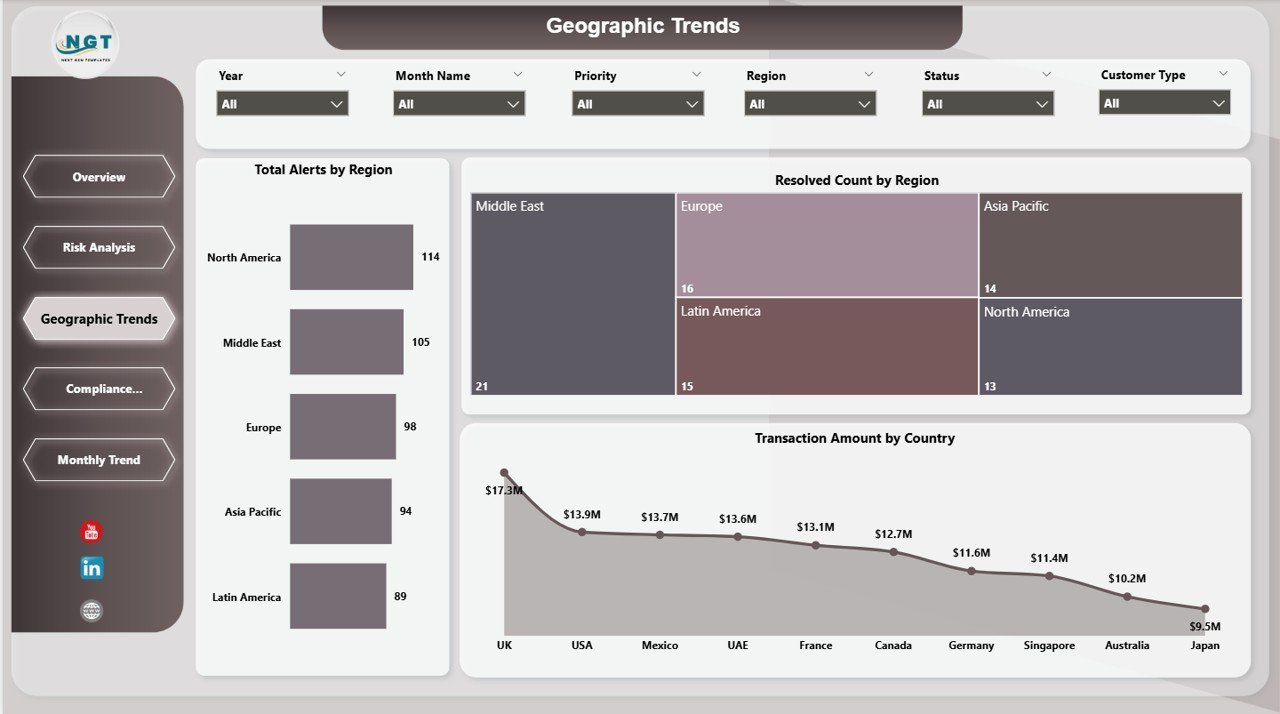
The Geographic Trends Page provides location-based insights.
Charts Included:
-
🌍 Total Alerts by Region
-
🌍 Resolved Count by Region
-
🌍 Transaction Amount by Country
Because financial crimes vary across regions, this page helps identify high-risk locations.
4. Compliance Performance Analysis – Team Efficiency Tracking
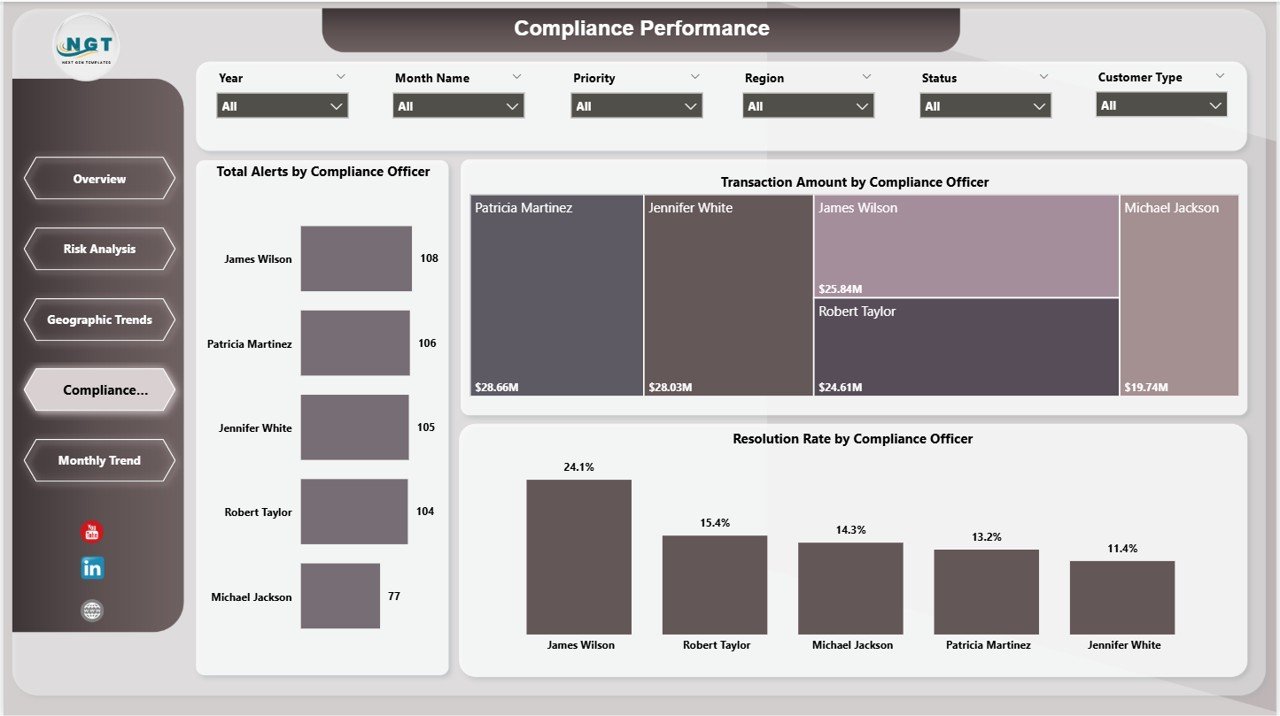
The Compliance Performance Page measures team productivity.
Charts Included:
-
📊 Total Alerts by Compliance Officer
-
📊 Transaction Amount by Compliance Officer
-
📊 Resolution Rate by Compliance Officer
This page helps managers evaluate team performance and improve efficiency.
5. Monthly Trends – Track Performance Over Time
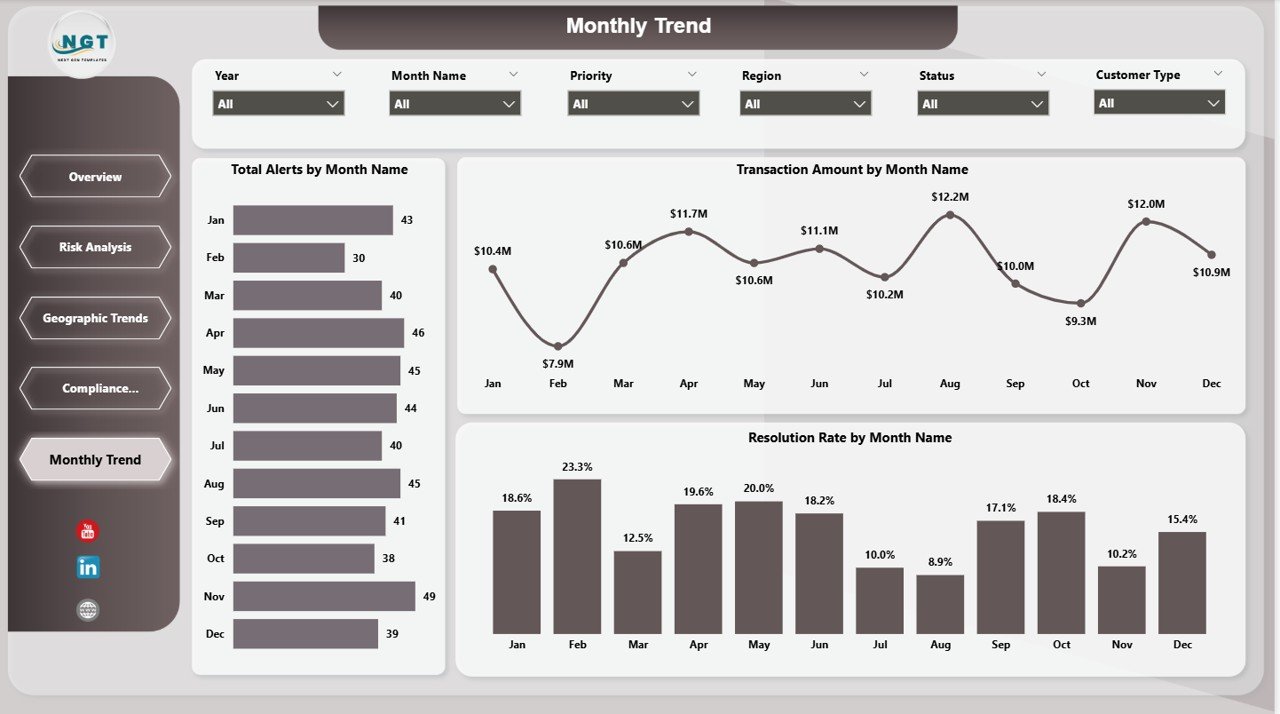
The Monthly Trends Page focuses on time-based analysis.
Charts Included:
-
📅 Total Alerts by Month Name
-
📅 Transaction Amount by Month Name
-
📅 Resolution Rate by Month Name
Because trends matter, this page helps identify seasonal patterns and unusual activity.
How Does the AML Dashboard Improve Compliance?
This dashboard transforms compliance processes.
Key Improvements:
-
Faster detection of suspicious transactions
-
Improved alert management
-
Better risk prioritization
-
Accurate reporting
-
Enhanced regulatory compliance
As a result, organizations reduce risk and improve operational efficiency.
Click to Purchases Anti-Money Laundering (AML) Dashboard in Power BI
Advantages of Anti-Money Laundering (AML) Dashboard in Power BI
Using this dashboard offers several advantages.
🚀 Real-Time Monitoring
-
Track transactions instantly
-
Identify suspicious activity quickly
-
Respond faster to risks
📊 Better Data Visualization
-
Use interactive charts
-
Understand complex data easily
-
Identify patterns quickly
⏱ Increased Efficiency
-
Automate reporting
-
Reduce manual work
-
Save time
🔍 Improved Risk Detection
-
Highlight high-risk transactions
-
Detect unusual patterns
-
Reduce fraud risks
📈 Enhanced Decision Making
-
Use data-driven insights
-
Improve compliance strategies
-
Allocate resources effectively
Best Practices for the Anti-Money Laundering (AML) Dashboard in Power BI
To maximize the benefits, follow these best practices.
✅ Maintain High-Quality Data
-
Use clean and structured data
-
Remove duplicates
-
Validate transaction records
📅 Update Data Regularly
-
Refresh data frequently
-
Ensure real-time monitoring
🎯 Focus on Key KPIs
-
Track relevant AML metrics
-
Avoid unnecessary data
📊 Use Filters and Slicers
-
Analyze specific risk levels
-
Focus on regions or officers
🔄 Monitor Trends Continuously
-
Review monthly performance
-
Identify unusual spikes
🧠 Train Your Team
-
Ensure proper dashboard usage
-
Provide AML training
Common AML KPIs Tracked in Power BI Dashboard
To ensure effective monitoring, organizations track key metrics.
Important KPIs Include:
-
Total Alerts
-
Flagged Transactions
-
Resolution Rate
-
SAR Filed Count
-
Average Investigation Time
-
High-Risk Transaction Count
-
Compliance Efficiency Rate
Because these KPIs provide actionable insights, they help improve compliance performance.
How to Use the AML Dashboard Effectively?
Follow these steps to get the best results.
Step-by-Step Guide:
-
Connect data sources to Power BI
-
Refresh the dashboard regularly
-
Use slicers to filter data
-
Analyze KPI cards
-
Review charts for insights
-
Identify high-risk alerts
-
Take corrective actions
By following these steps, teams can improve compliance efficiency.
Click to Purchases Anti-Money Laundering (AML) Dashboard in Power BI
Challenges Without an AML Dashboard
Without a dashboard, organizations face multiple issues.
Common Problems:
-
Slow detection of suspicious activities
-
Inefficient reporting
-
Poor data visibility
-
Increased compliance risk
Therefore, adopting a dashboard becomes essential.
Future of AML Dashboards in Power BI
Technology continues to evolve rapidly.
Future Trends:
-
AI-based fraud detection
-
Predictive analytics
-
Real-time monitoring systems
-
Cloud-based AML platforms
As a result, AML dashboards will become more intelligent and powerful.
Conclusion
The Anti-Money Laundering (AML) Dashboard in Power BI provides a powerful solution for monitoring financial risks and ensuring compliance.
Because it combines real-time analytics with interactive visuals, it helps organizations detect suspicious activities, improve efficiency, and reduce regulatory risks.
If you want to strengthen your compliance system, this dashboard is a must-have tool.
Frequently Asked Questions (FAQs)
1. What is an AML dashboard?
An AML dashboard is a tool that monitors suspicious transactions, alerts, and compliance performance.
2. Why is Power BI used for AML dashboards?
Power BI offers real-time insights, interactive visuals, and easy data integration.
3. What is SAR in AML?
SAR stands for Suspicious Activity Report. It is filed when suspicious activity is detected.
4. How often should AML dashboards be updated?
You should update them daily or in real time for better monitoring.
5. Can this dashboard be customized?
Yes, you can customize KPIs, charts, and data sources based on your needs.
6. Which industries use AML dashboards?
-
Banking
-
Financial services
-
Fintech
-
Insurance
7. What is a high-risk transaction?
A transaction that shows unusual patterns or suspicious behavior.
8. Is Power BI suitable for compliance reporting?
Yes, Power BI is highly effective for compliance reporting and analytics.
Click to Purchases Anti-Money Laundering (AML) Dashboard in Power BI
Visit our YouTube channel to learn step-by-step video tutorials