Financial crime continues to challenge banks, financial institutions, and regulated organizations worldwide. Because regulations keep becoming stricter, companies must monitor their Anti-Money Laundering (AML) performance with accuracy and speed. However, when teams rely on manual reports, scattered spreadsheets, or static documents, compliance gaps often appear.
That is exactly where an Anti-Money Laundering (AML) KPI Dashboard in Power BI becomes a powerful solution.
This detailed article explains what an AML KPI Dashboard in Power BI is, why organizations need it, how it works, its pages, key features, data structure, advantages, best practices, and frequently asked questions. By the end, you will clearly understand how this dashboard supports effective AML monitoring and smarter compliance decisions.
Click to Purchases Anti-Money Laundering (AML) KPI Dashboard in Power BI
What Is an Anti-Money Laundering (AML) KPI Dashboard in Power BI?
An Anti-Money Laundering (AML) KPI Dashboard in Power BI is an interactive analytics solution designed to track, monitor, and analyze AML-related key performance indicators in real time.
Instead of reviewing multiple Excel files or PDF reports, compliance teams use one centralized Power BI dashboard to:
-
Track AML KPIs across months
-
Compare actual performance with targets
-
Analyze current year vs previous year results
-
Identify compliance gaps early
-
Support audit and regulatory reporting
Because Power BI offers dynamic visuals, slicers, icons, and drill-through features, AML reporting becomes faster, clearer, and more actionable.
Why Do Organizations Need an AML KPI Dashboard in Power BI?
AML compliance requires constant monitoring. However, manual reporting often delays insights and increases risk. Therefore, organizations increasingly adopt Power BI dashboards for AML tracking.
Key Reasons Organizations Use an AML KPI Dashboard
-
AML regulations demand regular performance tracking
-
Compliance teams need real-time visibility
-
Management expects summarized insights
-
Auditors require structured and historical data
-
Risk teams must detect trends early
As a result, organizations move from reactive compliance to proactive AML risk management.
Click to Purchases Anti-Money Laundering (AML) KPI Dashboard in Power BI
How Does an AML KPI Dashboard in Power BI Work?
The AML KPI Dashboard in Power BI works by combining Excel-based data input with Power BI visualization and analytics.
First, users enter data into structured Excel sheets. Then, Power BI connects to this Excel file as a data source. After that, the dashboard automatically updates visuals, KPIs, and trends based on the selected filters.
Consequently, users receive updated insights without manual recalculation.
Click to Purchases Anti-Money Laundering (AML) KPI Dashboard in Power BI
What Are the Key Features of the AML KPI Dashboard in Power BI?
This ready-to-use AML KPI Dashboard includes three professionally designed pages inside the Power BI Desktop file. Each page serves a specific analytical purpose.
Let us explore them one by one.
1. What Is the Summary Page in the AML KPI Dashboard?
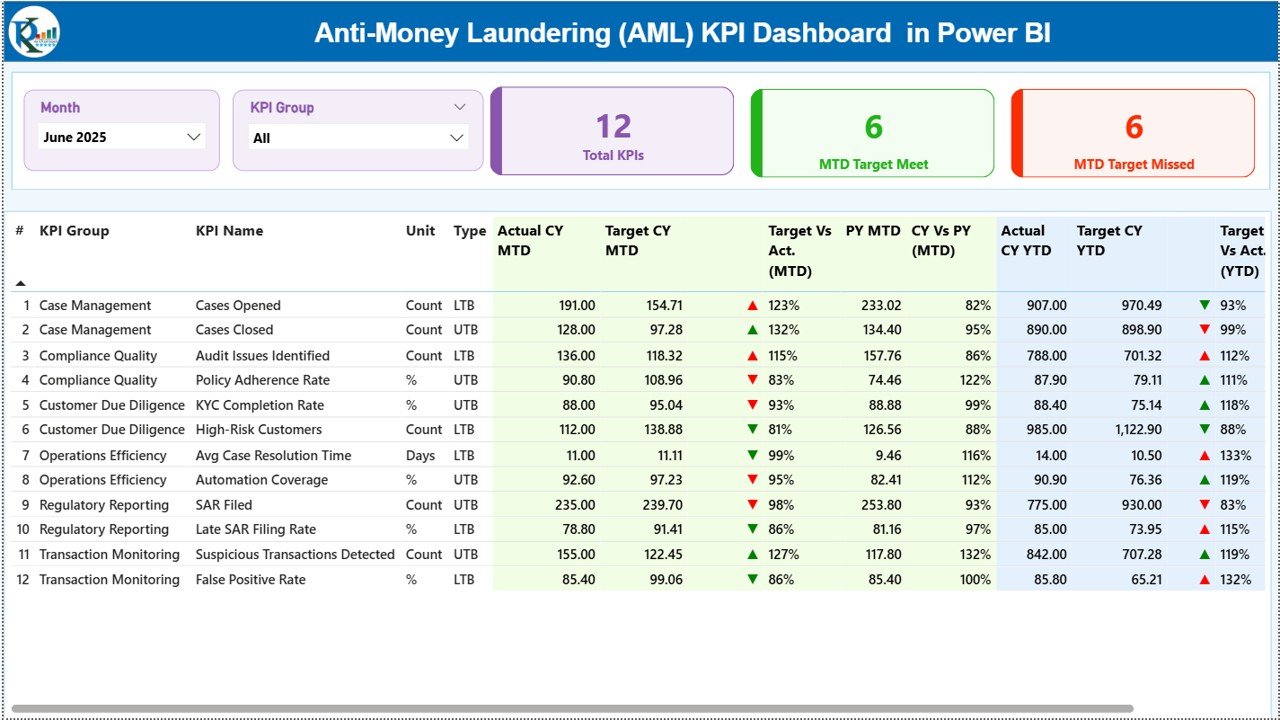
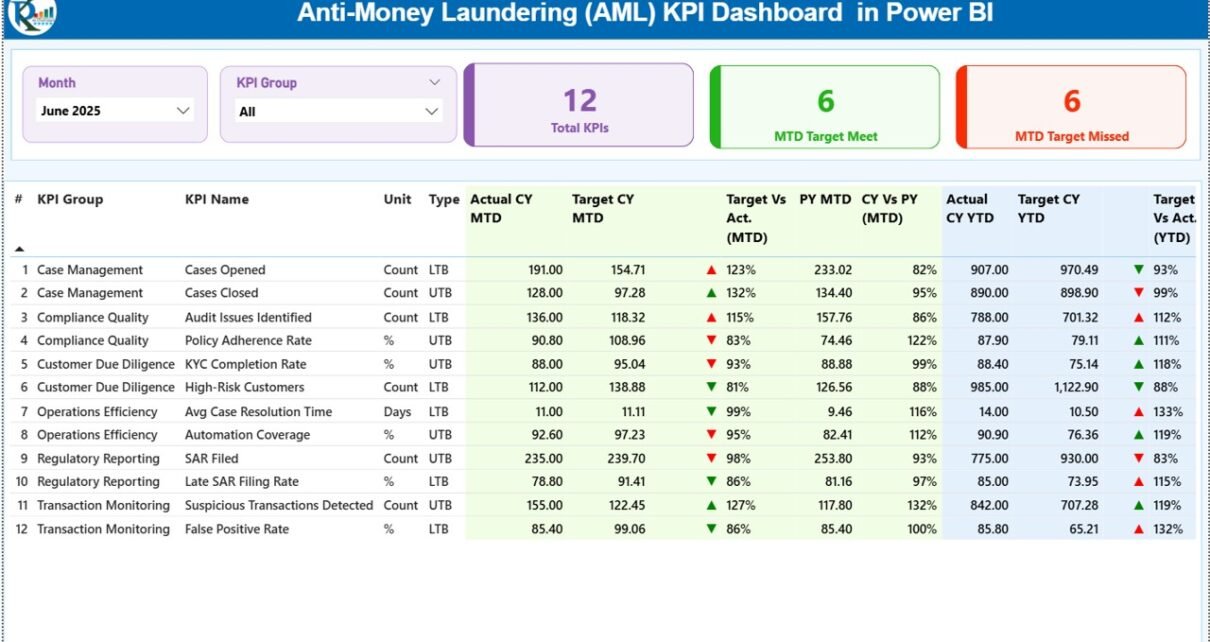
The Summary Page acts as the main landing page of the dashboard.
Key Elements of the Summary Page
At the top of the page, you see two important slicers:
-
Month slicer
-
KPI Group slicer
These slicers allow users to filter the entire dashboard instantly.
KPI Cards on the Summary Page
The dashboard displays three KPI cards for quick insights:
-
Total KPIs Count
-
MTD Target Met Count
-
MTD Target Missed Count
Because these cards update dynamically, management instantly understands the overall AML compliance status.
What Information Does the Detailed KPI Table Show?
Below the cards, the Summary Page displays a detailed KPI table. This table provides a complete AML performance view.
Columns Available in the KPI Table
-
KPI Number – Sequential identifier of the KPI
-
KPI Group – Category or group of the KPI
-
KPI Name – Name of the AML KPI
-
Unit – Unit of measurement
-
Type – KPI type (LTB or UTB)
MTD Performance Columns
-
Actual CY MTD – Current year MTD actual value
-
Target CY MTD – Current year MTD target value
-
MTD Icon – ▲ or ▼ icons with green or red color
-
Target vs Actual (MTD) – Actual ÷ Target percentage
-
PY MTD – Previous year MTD value
-
CY vs PY (MTD) – CY MTD ÷ PY MTD percentage
YTD Performance Columns
-
Actual CY YTD – Current year YTD actual value
-
Target CY YTD – Current year YTD target value
-
YTD Icon – ▲ or ▼ icons for YTD status
-
Target vs Actual (YTD) – Actual ÷ Target percentage
-
PY YTD – Previous year YTD value
-
CY vs PY (YTD) – CY YTD ÷ PY YTD percentage
Because of this structured layout, users analyze both short-term and long-term AML performance in one place.
Click to Purchases Anti-Money Laundering (AML) KPI Dashboard in Power BI
2. How Does the KPI Trend Page Help AML Analysis?
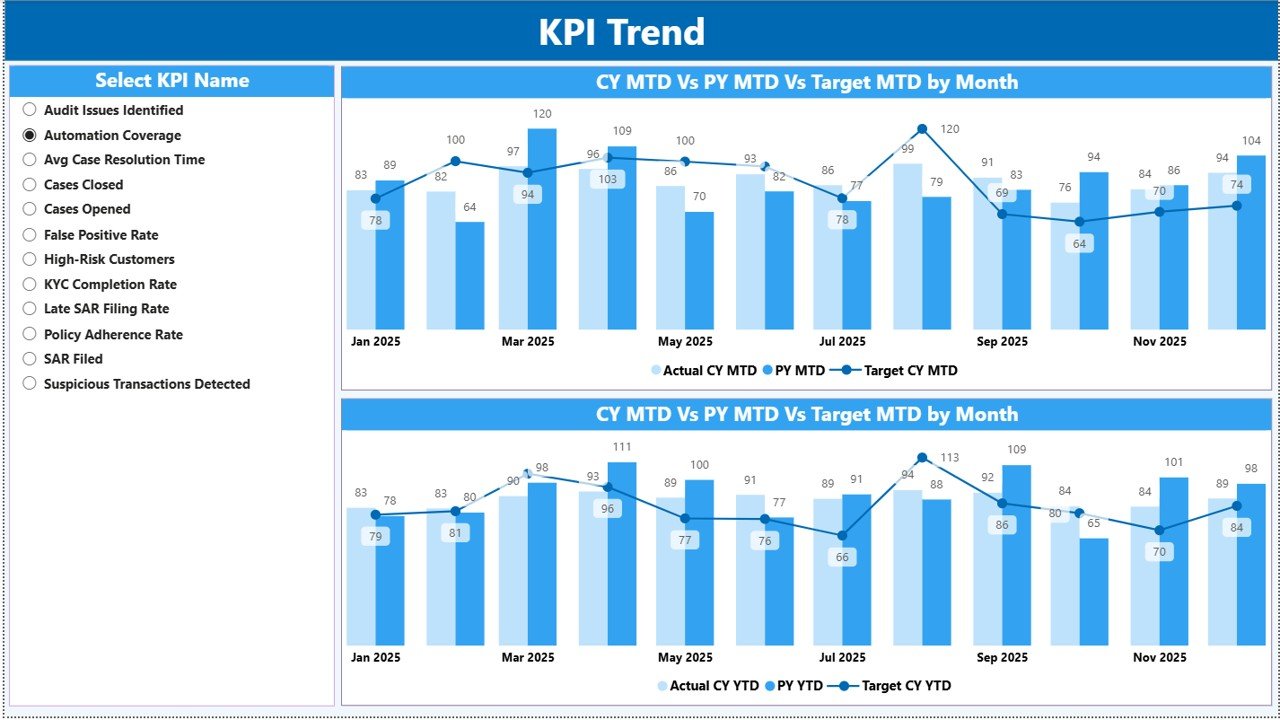
The KPI Trend Page focuses on deep trend analysis.
Features of the KPI Trend Page
-
KPI Name slicer on the left
-
Two combo charts for MTD and YTD
-
Comparison between Actual, Target, and Previous Year
Charts Available on This Page
-
MTD Trend Chart – CY Actual, Target, and PY
-
YTD Trend Chart – CY Actual, Target, and PY
Because these charts show trends visually, compliance teams quickly identify:
-
Improving KPIs
-
Declining performance
-
Seasonal patterns
-
Repeated compliance issues
As a result, teams take corrective action early.
3. What Is the KPI Definition Page in Power BI?
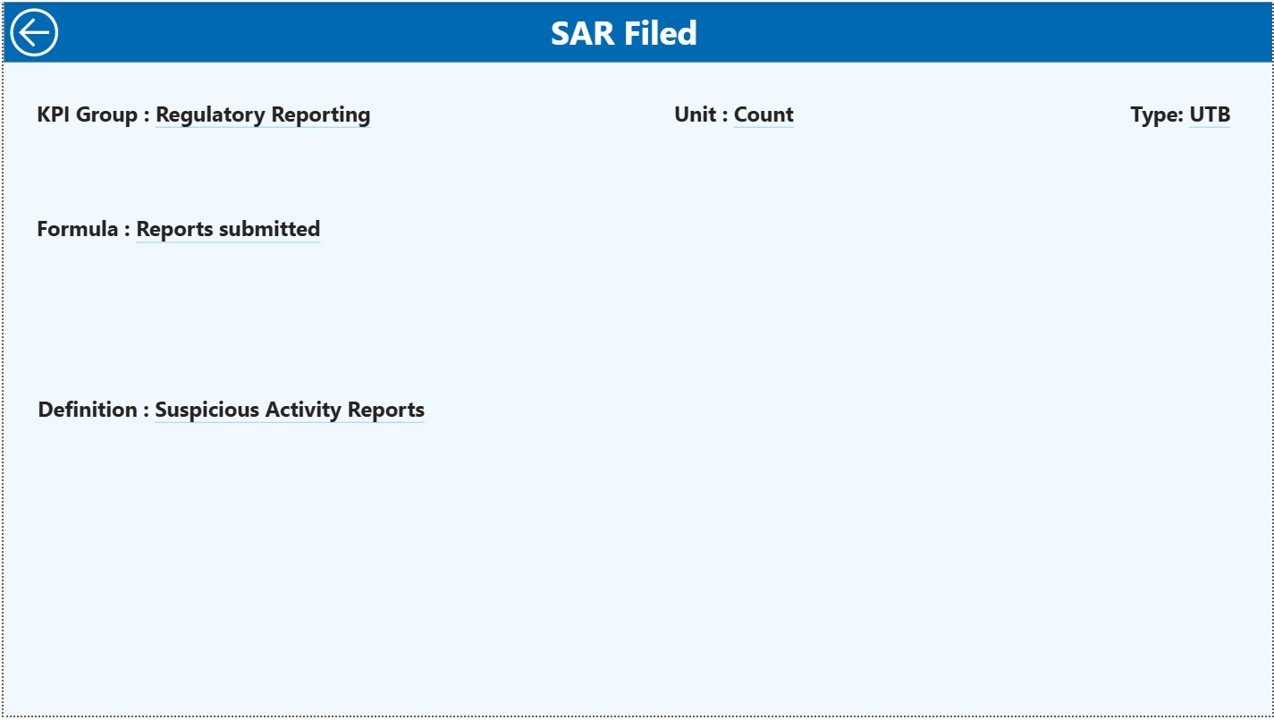
The KPI Definition Page acts as a drill-through page. This page remains hidden by default.
Purpose of the KPI Definition Page
When users right-click a KPI on the Summary Page and drill through, they reach this page.
Here, users see:
-
KPI Formula
-
KPI Definition
-
KPI Type
-
Measurement logic
To return to the main page, users simply click the Back button located in the top-left corner.
Because of this feature, the dashboard stays self-explanatory and audit-ready.
Click to Purchases Anti-Money Laundering (AML) KPI Dashboard in Power BI
What Excel Data Is Used in the AML KPI Dashboard?
This Power BI dashboard uses an Excel file as its data source. The Excel file contains three structured worksheets.
1. What Is the Input_Actual Sheet?
The Input_Actual sheet stores actual AML performance data.
Columns in Input_Actual Sheet
-
KPI Name
-
Month (first date of the month)
-
MTD Actual Number
-
YTD Actual Number
Users update this sheet monthly. After refresh, the dashboard reflects updated actuals automatically.
2. What Is the Input_Target Sheet?
The Input_Target sheet stores target values.
Columns in Input_Target Sheet
-
KPI Name
-
Month (first date of the month)
-
MTD Target Number
-
YTD Target Number
Because targets drive performance comparison, accurate entry remains critical.
3. What Is the KPI Definition Sheet?
The KPI Definition sheet acts as a reference table.
Information Stored in This Sheet
-
KPI Number
-
KPI Group
-
KPI Name
-
Unit
-
Formula
-
Definition
-
Type (LTB or UTB)
Since all KPI logic stays documented, stakeholders trust the dashboard outputs.
Which AML KPIs Can You Track Using This Dashboard?
Organizations can customize KPIs based on regulatory requirements. However, commonly tracked AML KPIs include:
-
AML Alerts Generated
-
Alerts Investigated
-
Alerts Closed
-
Suspicious Transaction Reports (STRs)
-
False Positive Rate
-
Investigation Turnaround Time
-
High-Risk Customers
-
KYC Completion Rate
-
Compliance Breaches
-
Transaction Monitoring Coverage
Because Power BI remains flexible, teams easily extend the KPI list.
Click to Purchases Anti-Money Laundering (AML) KPI Dashboard in Power BI
Advantages of Anti-Money Laundering (AML) KPI Dashboard in Power BI
An AML KPI Dashboard in Power BI delivers strong operational and compliance benefits.
1. Improves AML Visibility
The dashboard presents all KPIs in one interactive view. Therefore, compliance teams gain instant clarity.
2. Enables Faster Decision-Making
Dynamic visuals and KPI cards help management act quickly.
3. Reduces Manual Reporting Effort
Automation eliminates repetitive calculations and formatting work.
4. Supports Regulatory Audits
Clear KPI definitions and historical comparisons improve audit readiness.
5. Enhances Risk Monitoring
Trend analysis highlights early warning signs before issues escalate.
6. Scales with Business Growth
Power BI easily handles growing data volumes and additional KPIs.
How Does This Dashboard Support AML Risk Management?
Effective AML risk management depends on early detection. This dashboard uses icons, percentages, and trends to highlight deviations instantly.
As a result:
-
Teams address risks proactively
-
Management receives timely alerts
-
Compliance culture strengthens
Best Practices for the Anti-Money Laundering (AML) KPI Dashboard in Power BI
Follow these best practices to maximize dashboard value.
1. Define KPIs Clearly
Always maintain accurate KPI definitions in the KPI Definition sheet.
2. Keep Data Updated
Update actuals and targets every month to ensure reliable insights.
3. Use Consistent Units
Standardize units across KPIs to avoid confusion.
4. Review Trends Regularly
Analyze MTD and YTD trends during monthly compliance reviews.
5. Limit Manual Model Changes
Avoid unnecessary changes in Power BI measures to maintain consistency.
6. Secure Sensitive Data
Apply Power BI access controls to protect AML information.
Click to Purchases Anti-Money Laundering (AML) KPI Dashboard in Power BI
Who Should Use an AML KPI Dashboard in Power BI?
This dashboard benefits multiple roles, such as:
-
AML Compliance Officers
-
Risk Managers
-
Internal Auditors
-
Compliance Analysts
-
Senior Management
-
Regulatory Reporting Teams
Because Power BI remains user-friendly, adoption becomes smooth across departments.
Can Small and Mid-Size Organizations Use This Dashboard?
Yes, absolutely.
Small and mid-size organizations often lack expensive AML tools. Therefore, a Power BI-based AML KPI Dashboard offers a cost-effective and scalable solution.
Conclusion
An Anti-Money Laundering (AML) KPI Dashboard in Power BI provides a powerful, structured, and interactive solution for AML performance monitoring. By combining Excel-based data input with Power BI analytics, organizations gain real-time visibility into compliance performance.
With dynamic KPIs, trend analysis, drill-through definitions, and target tracking, this dashboard helps organizations move toward proactive AML compliance and effective risk management.
Frequently Asked Questions (FAQs)
What is an AML KPI Dashboard in Power BI?
It is an interactive dashboard that tracks AML KPIs using Power BI visuals and Excel-based data.
Can I customize KPIs in this dashboard?
Yes, you can easily add or modify KPIs based on regulatory needs.
Does this dashboard support MTD and YTD analysis?
Yes, it supports MTD, YTD, target comparison, and previous year analysis.
Is Excel required for this Power BI dashboard?
Yes, Excel serves as the data input source for actuals, targets, and KPI definitions.
Who should maintain this dashboard?
AML analysts or compliance teams should update data and monitor performance.
Can this dashboard support audits?
Yes, structured data and clear KPI definitions make it audit-friendly.
Click to Purchases Anti-Money Laundering (AML) KPI Dashboard in Power BI
Visit our YouTube channel to learn step-by-step video tutorials