The antique market continues to evolve. Collectors, auction houses, estate buyers, and vintage resellers demand transparency, authenticity, and value. Therefore, antique dealers must track performance carefully.
However, many antique businesses still rely on scattered spreadsheets and manual calculations. As a result, they struggle to monitor monthly sales, inventory turnover, profit margins, auction performance, and customer trends in one place.
So, how can antique dealers manage their business professionally and make data-driven decisions?
The answer is simple.
You need an Antique Dealers KPI Dashboard in Excel.
This ready-to-use Excel dashboard helps antique dealers, vintage store owners, estate sale professionals, and collectible traders monitor key performance indicators (KPIs) in one structured system. Moreover, it provides monthly and yearly comparisons. Consequently, you gain better visibility, improved control, and stronger business planning.
In this detailed guide, you will learn:
-
What an Antique Dealers KPI Dashboard in Excel is
-
Why antique dealers need KPI tracking
-
Detailed explanation of all 7 worksheets
-
Important KPIs for antique businesses
-
Advantages of Antique Dealers KPI Dashboard in Excel
-
Best Practices for implementation
-
Frequently Asked Questions
Let us explore everything step by step.
Click to Purchases Antique Dealers KPI Dashboard in Excel
📊 What Is an Antique Dealers KPI Dashboard in Excel?
An Antique Dealers KPI Dashboard in Excel is a structured performance management tool. It collects, organizes, and analyzes business metrics in one interactive workbook.
Instead of checking multiple reports, you can:
-
Select a specific month
-
Compare actual vs target performance
-
Track year-over-year growth
-
Monitor MTD and YTD results
-
Analyze KPI trends visually
Because the dashboard uses automated formulas and structured sheets, it reduces manual effort and increases clarity.
🏛️ Why Do Antique Dealers Need KPI Tracking?
Antique dealing involves unique challenges:
-
Irregular sales cycles
-
High-value transactions
-
Inventory holding costs
-
Auction commissions
-
Restoration expenses
If you fail to track KPIs properly, you risk cash flow issues and slow inventory turnover. Therefore, structured KPI tracking becomes essential.
KPI tracking helps you:
-
Improve profitability
-
Monitor inventory performance
-
Evaluate auction success rates
-
Track customer repeat purchases
-
Analyze seasonal demand
Moreover, when you review numbers regularly, you identify trends early and adjust strategies quickly.
Click to Purchases Antique Dealers KPI Dashboard in Excel
📁 What Are the 7 Worksheets in the Antique Dealers KPI Dashboard in Excel?
This ready-to-use dashboard includes 7 powerful worksheets, each designed for a specific purpose.
Let us understand each sheet clearly.
1️⃣ Home Sheet – Easy Navigation Hub
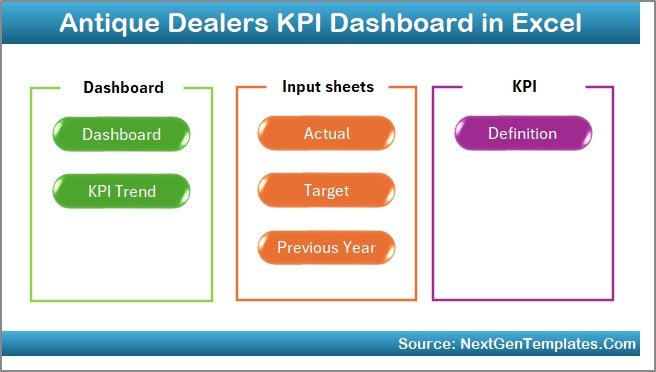
The Home Sheet acts as the index page.
It includes:
-
6 navigation buttons
-
Direct access to all sheets
-
Clean layout for smooth navigation
Therefore, users can switch between sheets quickly without confusion.
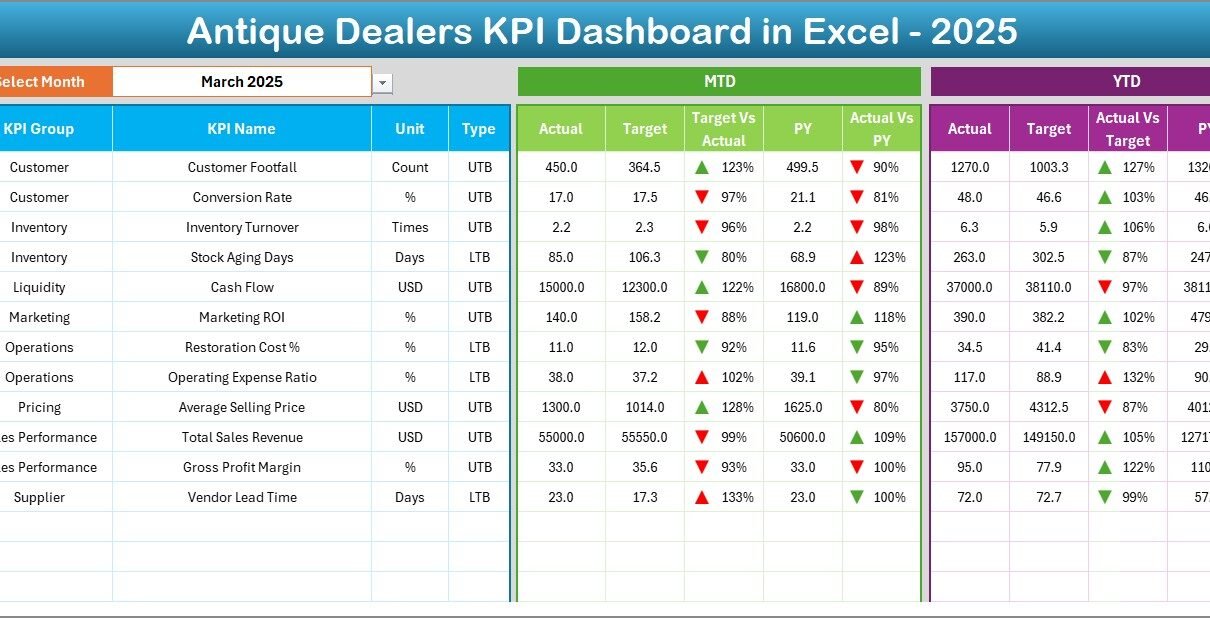
2️⃣ Dashboard Sheet – Central Performance Overview
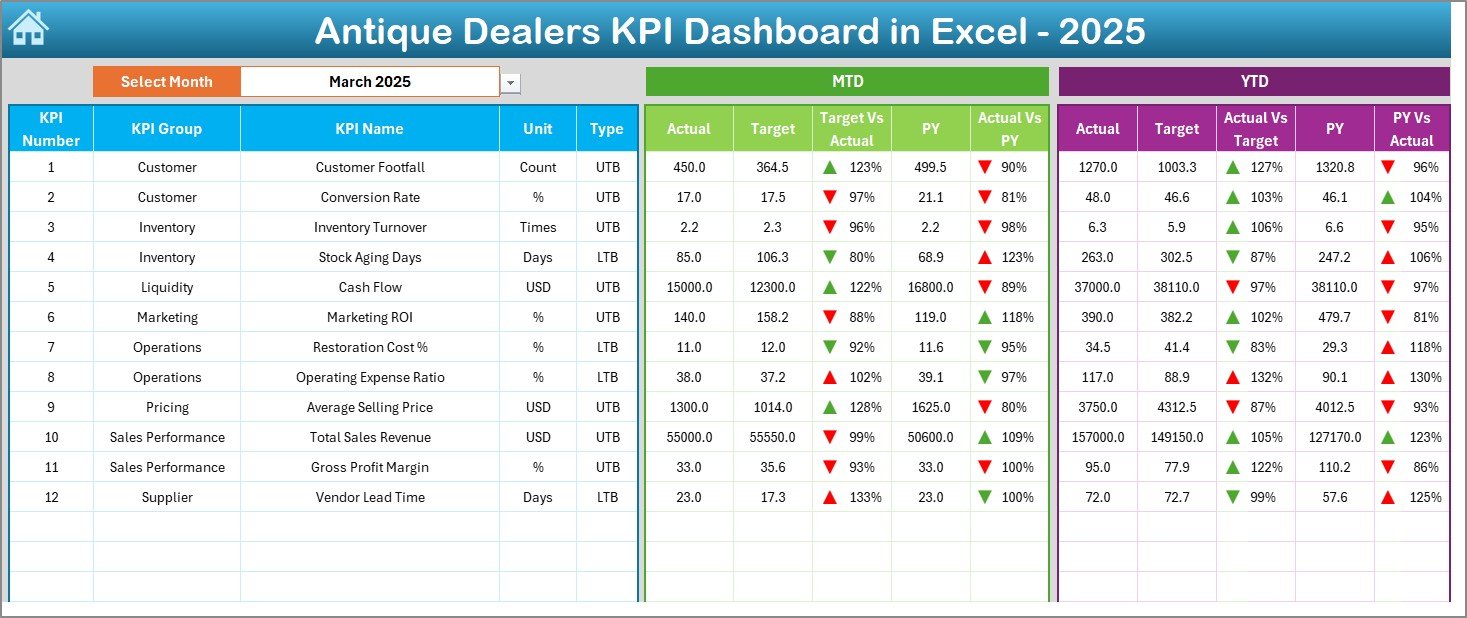
The Dashboard Sheet serves as the main performance screen.
Month Selection Feature
On cell D3, you can select the month from a drop-down list. Once selected, the entire dashboard updates automatically.
What Does It Display?
-
MTD Actual
-
MTD Target
-
MTD Previous Year
-
Target vs Actual (MTD %)
-
Previous Year vs Actual (MTD %)
-
YTD Actual
-
YTD Target
-
YTD Previous Year
-
Target vs Actual (YTD %)
-
Previous Year vs Actual (YTD %)
Additionally, the dashboard uses:
-
Conditional formatting
-
Green ▲ and Red ▼ indicators
Therefore, you instantly know whether performance meets expectations.
Click to Purchases Antique Dealers KPI Dashboard in Excel
3️⃣ KPI Trend Sheet – Detailed Performance Analysis
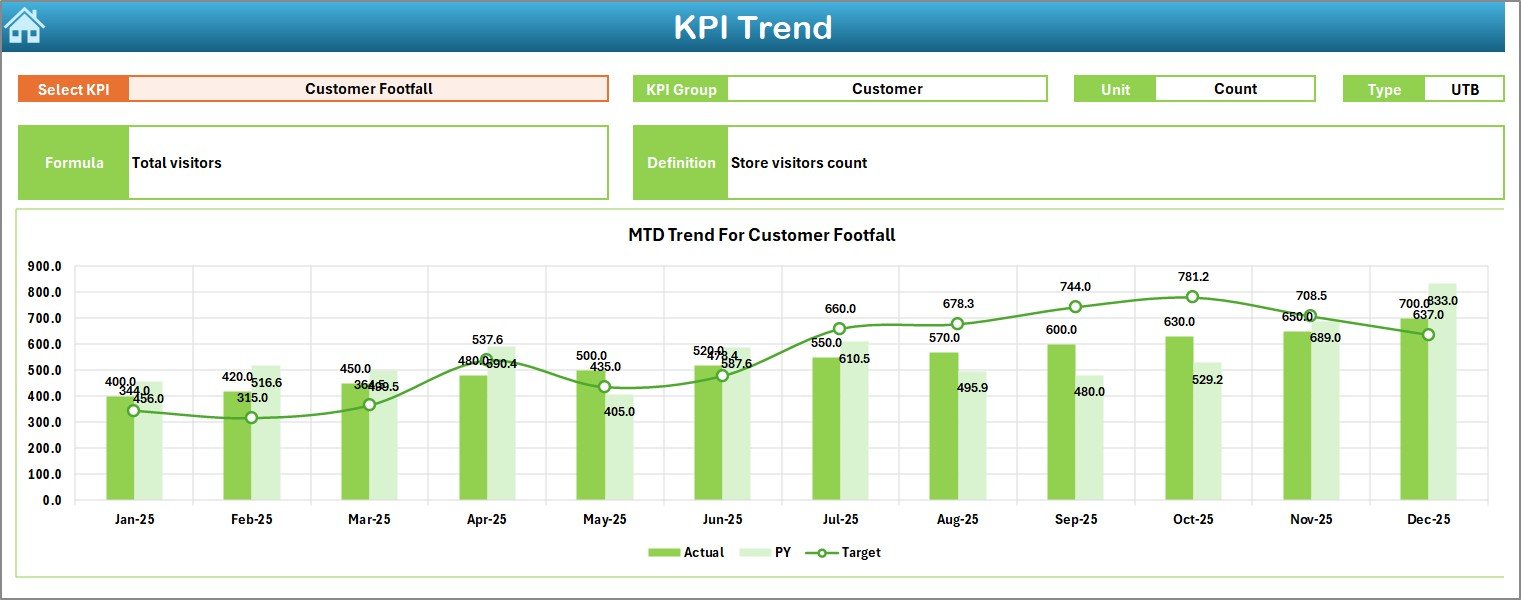
The KPI Trend Sheet provides deeper insights.
On cell C3, you can select a specific KPI.
Once selected, the sheet displays:
-
KPI Group
-
Unit of Measurement
-
KPI Type (Lower the Better or Upper the Better)
-
KPI Formula
-
KPI Definition
It also shows:
-
MTD Trend Chart (Actual vs Target vs PY)
-
YTD Trend Chart (Actual vs Target vs PY)
Because of these trend charts, you can easily analyze seasonal patterns and performance changes.
Click to Purchases Antique Dealers KPI Dashboard in Excel
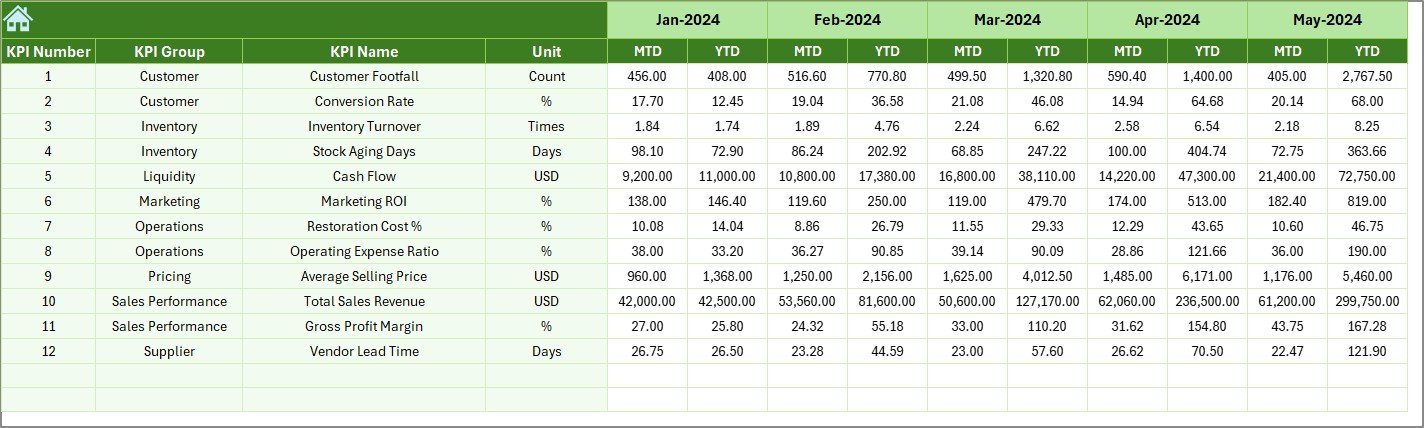
4️⃣ Actual Numbers Input Sheet – Current Year Data Entry
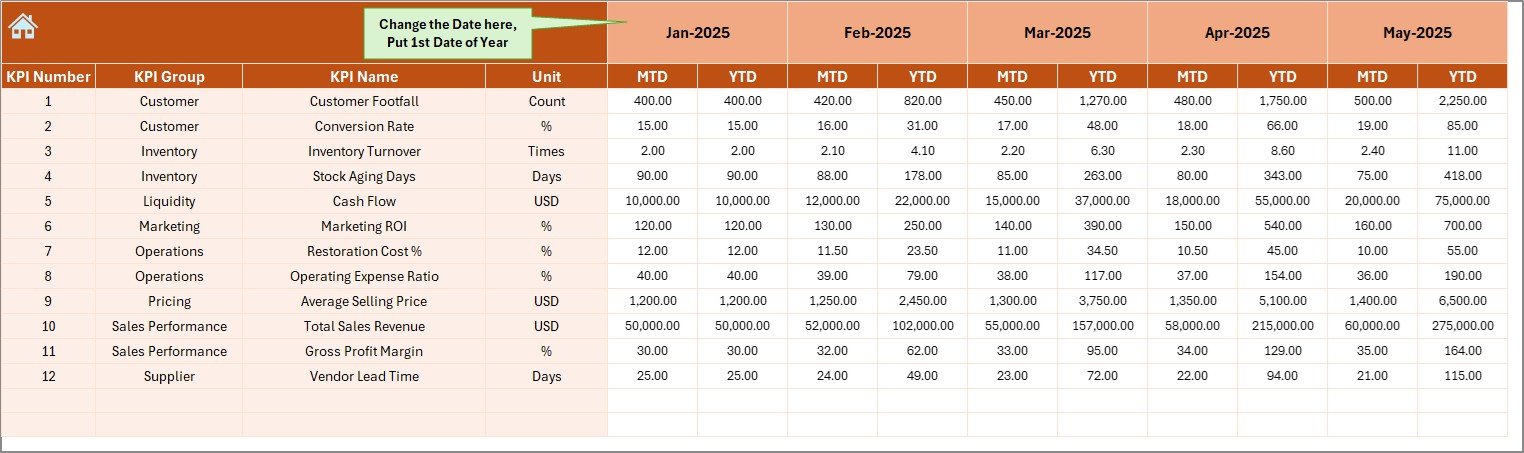
In this sheet, you enter:
-
Monthly MTD actual values
-
YTD actual values
On cell E1, you enter the first month of the year. After that, the dashboard calculates remaining months automatically.
Therefore, data entry remains structured and simple.
5️⃣ Target Sheet – Define Business Goals
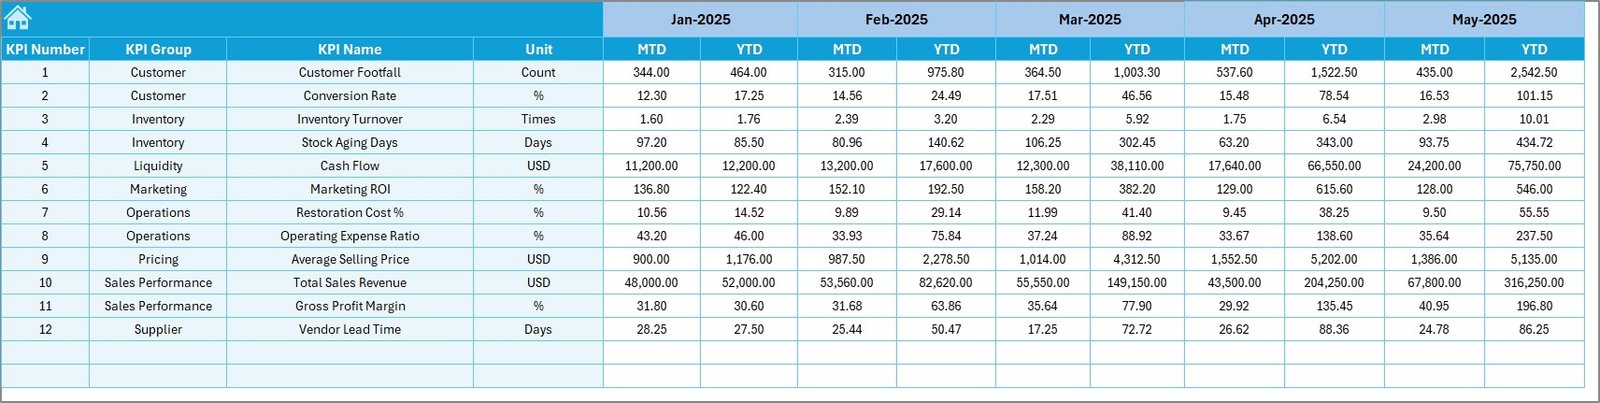
The Target Sheet allows you to enter:
-
Monthly MTD targets
-
YTD targets
When you set clear targets, you create measurable performance goals. Consequently, you improve accountability and planning.
6️⃣ Previous Year Number Sheet – Historical Comparison
This sheet stores previous year data.
Because of this structure, you can compare:
-
Current vs previous year sales
-
Growth trends
-
Seasonal performance
Year-over-year comparison strengthens long-term decision-making.
Click to Purchases Antique Dealers KPI Dashboard in Excel
7️⃣ KPI Definition Sheet – KPI Structure and Clarity
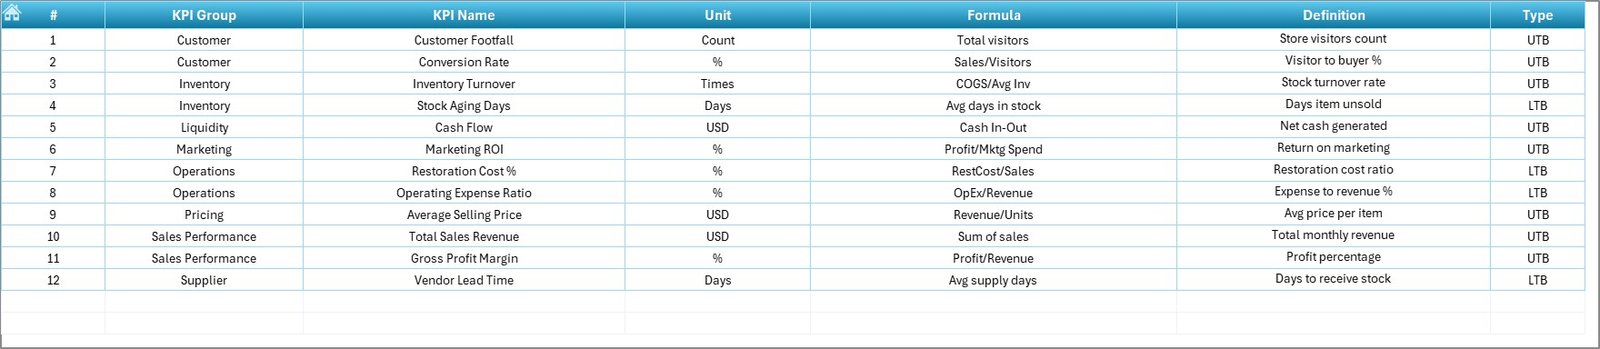
This sheet stores:
-
KPI Name
-
KPI Group
-
Unit
-
Formula
-
KPI Definition
Therefore, your KPI framework remains consistent and organized.
📈 What Are Important KPIs for Antique Dealers?
Antique businesses should track financial, operational, and inventory KPIs.
💰 Financial KPIs
-
Total Sales Revenue
-
Gross Profit Margin
-
Net Profit Margin
-
Average Sale Value
-
Commission Revenue
📦 Inventory KPIs
-
Inventory Turnover Ratio
-
Stock Holding Period
-
High-Value Item Ratio
-
Dead Stock Percentage
🛍️ Sales KPIs
-
Auction Success Rate
-
Private Sale Conversion Rate
-
Repeat Customer Rate
-
Customer Acquisition Cost
📊 Operational KPIs
-
Restoration Cost per Item
-
Appraisal Accuracy Rate
-
Lead Time from Purchase to Sale
When you monitor these KPIs consistently, you create a strong performance framework.
Click to Purchases Antique Dealers KPI Dashboard in Excel
⭐ Advantages of Antique Dealers KPI Dashboard in Excel
The Antique Dealers KPI Dashboard in Excel offers multiple advantages.
✅ 1. Centralized Performance Monitoring
Track all KPIs in one structured file.
✅ 2. Automated MTD & YTD Calculations
Save time with built-in formulas.
✅ 3. Visual Performance Indicators
Quickly identify target achievements using icons.
✅ 4. Year-over-Year Comparison
Evaluate business growth clearly.
✅ 5. Easy Customization
Modify KPIs according to your antique niche.
✅ 6. Professional Reporting Structure
Present performance reports confidently to partners and investors.
Click to Purchases Antique Dealers KPI Dashboard in Excel
🛠️ Best Practices for the Antique Dealers KPI Dashboard in Excel
To maximize dashboard effectiveness, follow these best practices.
✔️ 1. Update Data Monthly
Enter actual numbers at the end of each month.
✔️ 2. Set Realistic Targets
Use historical data to define achievable targets.
✔️ 3. Monitor Slow-Moving Inventory
Focus on KPIs that show low turnover.
✔️ 4. Review Trends Regularly
Analyze MTD and YTD charts consistently.
✔️ 5. Maintain Accurate Records
Ensure data accuracy to avoid misleading insights.
✔️ 6. Train Staff on KPI Definitions
Make sure your team understands KPI meaning and impact.
📊 How Can This Dashboard Help Antique Dealers Grow?
This dashboard supports growth by:
-
Improving inventory control
-
Enhancing pricing strategies
-
Identifying profitable product categories
-
Reducing dead stock
-
Strengthening cash flow planning
Because you rely on real data, you reduce uncertainty and increase profitability.
🏁 Conclusion
The antique business requires strategic planning and financial discipline. Therefore, structured KPI tracking becomes essential.
The Antique Dealers KPI Dashboard in Excel provides:
-
Clear performance visibility
-
Automated MTD and YTD tracking
-
Target vs Actual analysis
-
Year-over-year comparison
-
Trend analysis charts
Moreover, it simplifies reporting and strengthens business decisions.
If you want to manage your antique business professionally and profitably, this dashboard offers the perfect solution.
Start tracking. Start optimizing. Start growing. 🏺📊
Click to Purchases Antique Dealers KPI Dashboard in Excel
❓ Frequently Asked Questions (FAQs)
1. Who can use this dashboard?
Antique dealers, auction houses, estate sale managers, vintage store owners, and collectible traders can use it.
2. Do I need advanced Excel skills?
No. You only need basic Excel knowledge for data entry and month selection.
3. Can I customize KPIs?
Yes. You can modify KPI names, formulas, and groups according to your business model.
4. How often should I update the dashboard?
You should update it monthly for accurate performance tracking.
5. Can I track multiple store locations?
Yes. You can add location-wise KPIs and expand the data structure.
6. Does this dashboard support financial planning?
Yes. It supports revenue analysis, profit tracking, and inventory performance monitoring.
Click to Purchases Antique Dealers KPI Dashboard in Excel
Visit our YouTube channel to learn step-by-step video tutorials