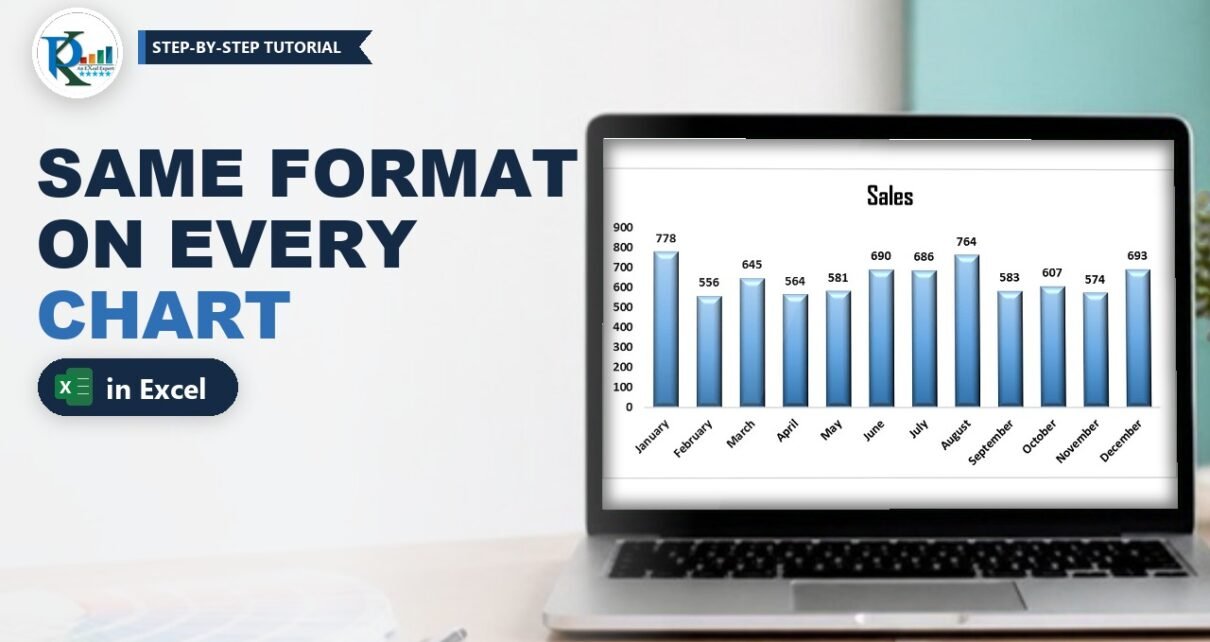
Want to apply the same format to other charts in Excel without redoing every click? When you build a dashboard, you usually style one chart carefully (fonts, data labels, gradient fill, bevel, gap width) and then need the same look on five more. Formatting each one by hand is slow, and the charts never match exactly. In this tutorial you will format a month-wise sales chart once and copy its look to a day-wise sales chart in two ways: by saving it as a chart template, and with Paste Special Formats. You will also see the one side effect of Paste Special that catches people out.
⬇️ Download the Practice File
Month-wise and day-wise sales with a formatted and a plain chart · .xlsx (no macros) · Excel 2013 and later
Watch the Video Tutorial
PK formats a column chart, saves it as a chart template, reuses it on new data, and then copies the same look onto another chart with Paste Special Formats.
What You Will Learn
- How to format a source chart the way PK does in the video.
- Method 1: save the chart as a template and insert new charts from it.
- Method 2: copy the chart and paste only its formats onto an existing chart.
- The chart-type catch: why Paste Special Formats can turn a pie chart into a column chart.
- Which method to pick for one-off fixes and for a whole dashboard.
The Example Data
The practice file has two small tables on Sheet1:
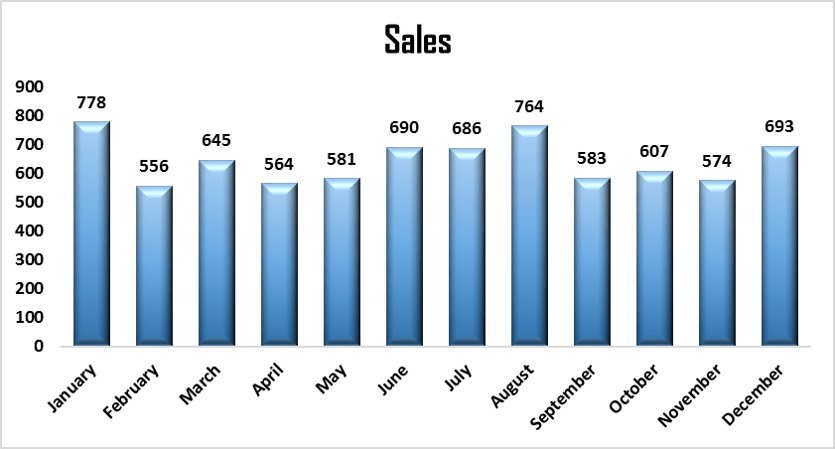
- A1:B13: Month and Sales, January (778) to December (693).
- D1:E8: Day and Sales, Sunday (31) to Saturday (47).
The month-wise chart is already formatted, and the day-wise chart is a plain clustered column chart with Excel’s default look. Your job is to make the second chart look like the first.
Step 1: Format the Source Chart
Select A1:B13 and insert a clustered column chart from Insert → Charts. Then apply your house style. In the video PK uses these settings:
- Chart title: black, bold, larger size, font Agency FB.
- Axis labels: black and bold.
- Gridlines: removed.
- Data labels: added, bold and black.
- Columns: right-click a column, choose Format Data Series → Fill & Line → Gradient fill and pick a blue preset gradient.
- Effects: 3-D Format with a top bevel.
- Series Options: Gap Width about 75% for thicker columns.
This is the look you want on every other column chart in the dashboard. Now there are two ways to copy it.
Method 1: Apply the Same Format with a Chart Template
A chart template is a .crtx file that stores the chart type and all of its formatting. Once saved, it appears next to Excel’s built-in chart types.
Save the chart as a template
- Right-click an empty part of the formatted chart (the chart area).
- Choose Save as Template.
- Give it a clear name, for example column chart template, and click Save. Keep the default folder so Excel can find it.
Insert a new chart from the template
- Select the day-wise data, D1:E8.
- Go to Insert, open the column chart drop-down and click More Column Charts. The Insert Chart window opens on the All Charts tab.
- Click Templates in the left-hand list, select your template and click OK.
The new chart arrives with the same title font, labels, gradient, bevel and gap width, now showing Sunday to Saturday. The template stays available in every workbook on your computer, so this is the method to use when you build many dashboards in the same style.
Addition, not shown in the video: to restyle a chart that already exists, select it and use Chart Design → Change Chart Type → Templates. For a full walkthrough of building, applying and managing templates, read our guide to chart templates in Excel.
Method 2: Paste Special Formats onto Another Chart
This method is quicker when both charts are already in the same workbook.
Step 1: Copy the formatted chart
Click the formatted month-wise chart once so the whole chart is selected, and press Ctrl+C.
Step 2: Select the target chart
Click the plain day-wise chart to select it.
Step 3: Paste Special, Formats
Go to Home → Paste → Paste Special, or press the legacy shortcut Alt, E, S one key after another. For a chart the Paste Special window has only three options: All, Formats and Formulas. Choose Formats and click OK.
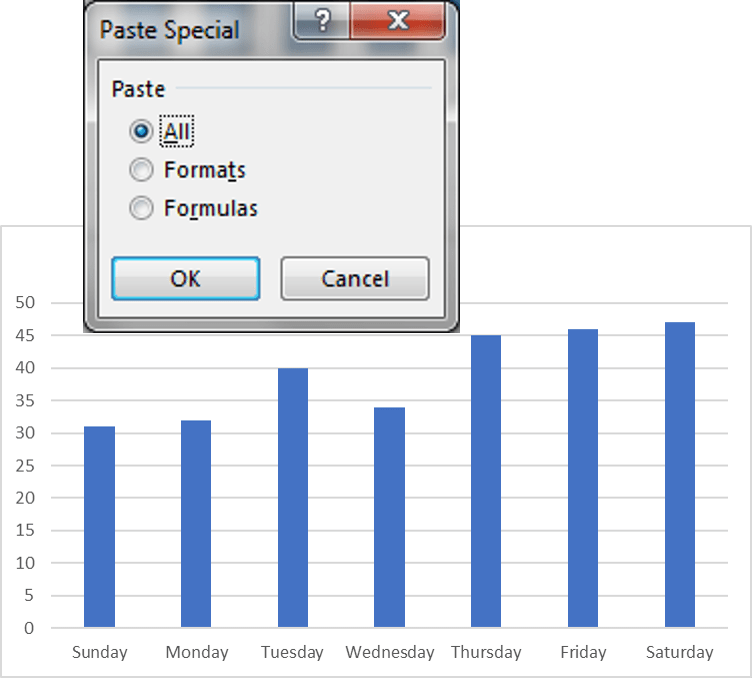
The day-wise chart takes on the full formatting of the month chart, while it still plots D2:E8.
Why this works
A copied chart carries two things: its data references (the series formulas) and its formatting. All would paste both, and Formulas would paste only the data references. Formats pastes only the styling and leaves the target chart’s own data in place.
Watch Out: Paste Special Formats Also Changes the Chart Type
The chart type is part of a chart’s format. In the video PK creates a pie chart of the day-wise data, copies the column chart and pastes Formats onto the pie. The pie becomes a column chart. The data link is untouched, so it still shows Sunday to Saturday, but the type and styling now match the source.
So use Paste Special Formats between charts of the same type, or when you are happy for the target to switch type. To keep a different chart type, format it separately or save a template for that type as well.
Chart Template or Paste Special: Which to Use?
- Paste Special Formats: best for a quick fix inside one workbook. No files to manage, and it works on charts that already exist.
- Chart template: best for a style you reuse across workbooks and dashboards. It is always one click away in the Templates folder.
- Format Painter (an extra tip): it works on single chart elements, such as one series or one label. To copy a whole chart’s style at once, the two methods above are faster.
Common Errors and Fixes
The new chart shows the old data
You pasted with All instead of Formats, or pasted a copy of the chart instead of pasting onto the selected target chart. Undo, select the target chart and choose Formats.
My template is not in the Templates list
It was saved outside the default chart templates folder. Save it again from the chart with Save as Template and keep the folder Excel suggests.
Tips
- Build one master chart per chart type (column, line, doughnut) and save each as a template.
- Name templates by purpose, for example Dashboard column – blue, so your team picks the right one.
- Share the
.crtxfiles with colleagues so every report uses the same style. - Microsoft’s article on how to save a custom chart as a template covers the template steps for each Excel version.
Want It Ready-Made?
If you want styled charts without building them yourself, the Chart Templates in Excel pack on NextGenTemplates.com gives you ready-made templates to apply in a click, and you can browse more Excel templates there. To learn charts, infographics and complete dashboards step by step, see the course Excel Pivot Tables and Dashboards.
Related Tutorials
- Chart Templates in Excel: Save and Reuse Your Favorite Charts
- Show Hidden and Collapsed Data on an Excel Chart
- 10 Pro Tips for Excel Charts
- Infographics with a Column Chart (Part 1)
- Resize and Relocate a Chart Using an Excel Range
Frequently Asked Questions
How do I copy a chart format to another chart in Excel?
Select the formatted chart and press Ctrl+C, select the other chart, then use Home, Paste, Paste Special and choose Formats. The second chart takes the look of the first and keeps its own data.
Can I use Format Painter on a whole chart?
Format Painter copies formatting between individual chart elements, such as one series or one title. To copy the style of an entire chart, Paste Special Formats or a chart template is quicker.
Why did my pie chart turn into a column chart?
The chart type is part of the format, so Paste Special Formats also copies it. Paste between charts of the same type, or use a separate template for each chart type.
Where are Excel chart templates saved?
Save as Template stores the crtx file in your chart templates folder, and Excel lists it under Insert Chart, All Charts, Templates in every workbook on that computer.
Can I apply a template to a chart that already exists?
Yes. Select the chart, choose Change Chart Type on the Chart Design tab, open Templates and pick your saved template.
About the Author
PK is a Microsoft Excel expert and trainer and the founder of PK: An Excel Expert and NextGenTemplates.com. He has been teaching Excel, Power Query and Power BI since 2016 on his YouTube channel.
Conclusion
You only need to format a chart once. To apply the same format to other charts, save the styled chart as a template for reuse across workbooks, or copy it and use Paste Special Formats for a quick match inside the same file, remembering that Formats also copies the chart type. Download the practice file, try both methods on the day-wise chart, and your next dashboard will look consistent in a fraction of the time.