The aquaculture industry is one of the fastest-growing food production sectors in the world. With increasing demand for seafood and sustainable farming practices, aquaculture businesses face constant pressure to monitor efficiency, maintain compliance, and achieve production targets. Managing all these aspects manually can be overwhelming.
This is where Aquaculture KPI Dashboards in Power BI come into play. By consolidating key performance indicators (KPIs) into an interactive, data-driven dashboard, aquaculture companies can gain real-time visibility into their operations, track progress, and make informed decisions.
In this article, we will explore the concept of an Aquaculture KPI Dashboard in Power BI, its structure, features, advantages, and best practices. We will also answer common questions about how it works and why it is crucial for modern aquaculture businesses.
Click to Purchases Aquaculture KPI Dashboard in Power BI
What is an Aquaculture KPI Dashboard?
An Aquaculture KPI Dashboard is a centralized tool built in Microsoft Power BI that allows aquaculture businesses to monitor and evaluate performance across different areas like production, quality, sustainability, and profitability.
It pulls raw data from an Excel file or other sources and converts it into interactive charts, tables, and cards that highlight current performance against targets. This helps managers and stakeholders quickly identify where the business is excelling and where improvements are needed.
Why Use Power BI for Aquaculture KPI Tracking?
Power BI is one of the most powerful business intelligence tools available. For aquaculture companies, it offers:
-
Data Integration: Connects seamlessly with Excel and other databases.
-
Real-Time Analysis: Provides instant insights into production and financial metrics.
-
User-Friendly Interface: Allows non-technical users to navigate easily.
-
Interactive Dashboards: Enables drill-through, slicers, and trend analysis.
-
Scalability: Works for both small fish farms and large aquaculture enterprises.
By using Power BI, aquaculture companies can turn raw data into actionable intelligence, enabling them to improve efficiency and remain competitive.
Key Features of the Aquaculture KPI Dashboard in Power BI
The Aquaculture KPI Dashboard designed in Power BI consists of three main pages that provide different levels of insights.
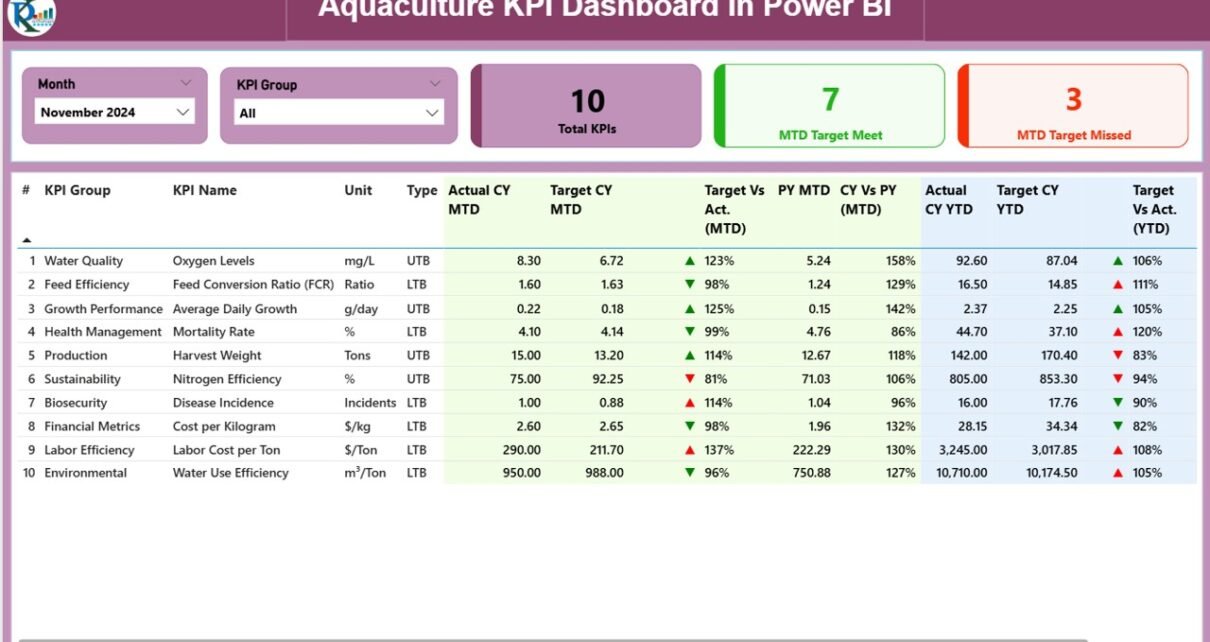
Summary Page
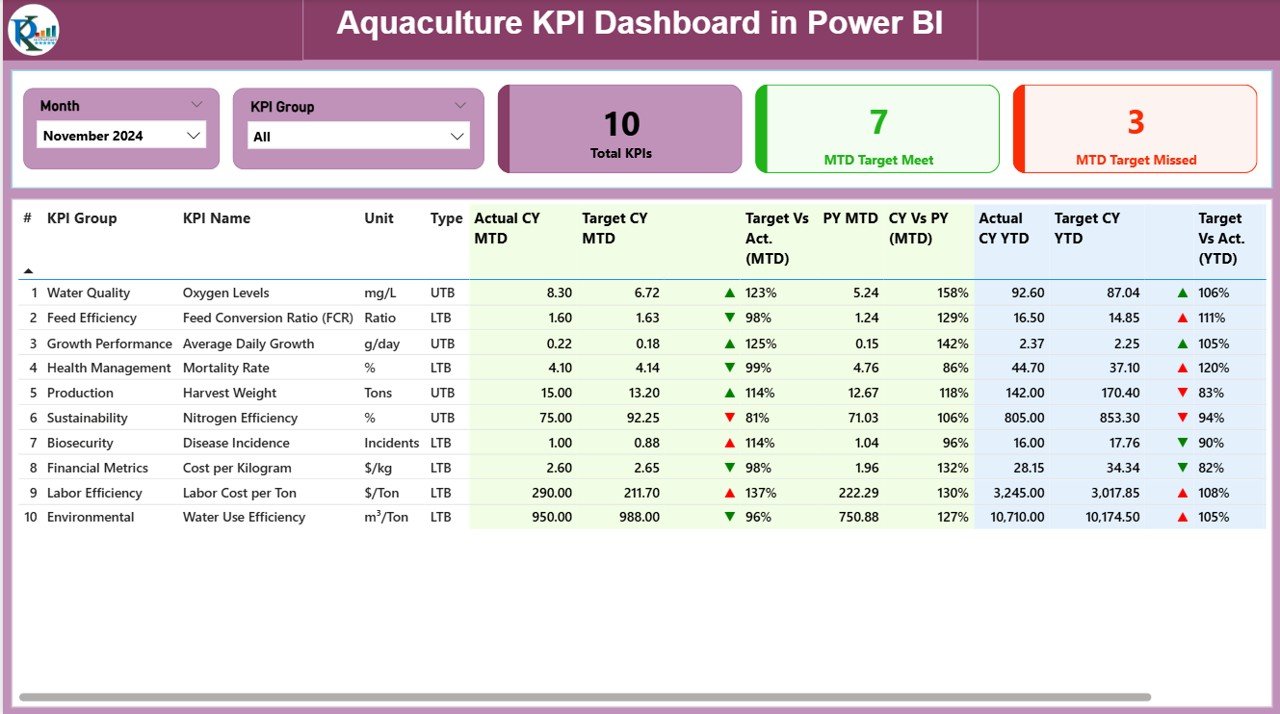
The Summary Page acts as the main landing page of the dashboard.
Here’s what it includes:
-
Slicers: Month and KPI Group selection filters to customize the view.
KPI Cards: Three cards displaying:
- Total KPIs Count
- MTD (Month-to-Date) Target Met Count
- MTD Target Missed Count
Detailed KPI Table: Displays comprehensive information for each KPI, including:
- KPI Number
- KPI Group
- KPI Name
- Unit of Measurement
- KPI Type (LTB – Lower the Better, UTB – Upper the Better)
- Actual CY MTD and YTD values
- Target CY MTD and YTD values
- Icons (Green ▲ for achieved, Red ▼ for missed)
- Target vs Actual (MTD and YTD %)
- Previous Year comparison (PY MTD and PY YTD %)
This page provides a snapshot of overall aquaculture performance, making it easy to spot strengths and weaknesses.
KPI Trend Page
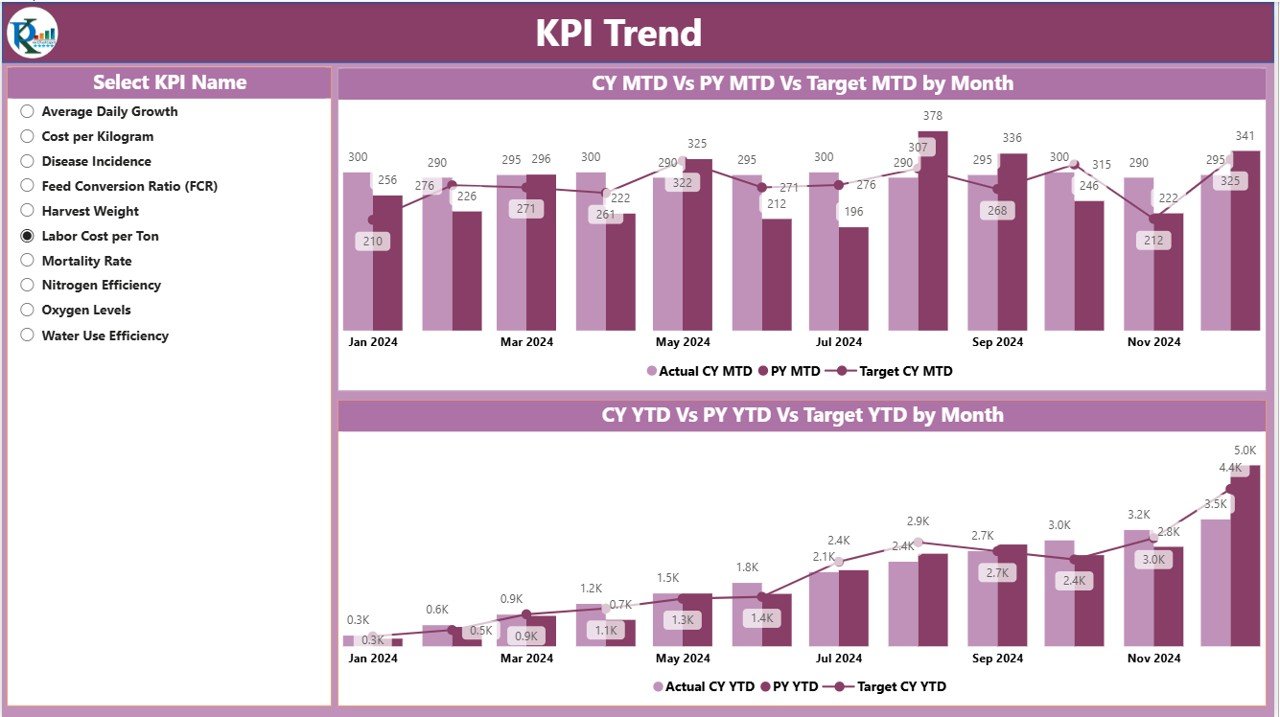
The KPI Trend page focuses on performance over time.
Charts:
- Two combo charts to compare Actuals, Targets, and Previous Year values.
- One chart for MTD and another for YTD.
-
Slicer: Filter by KPI name to drill into a specific indicator.
This page helps managers identify seasonal patterns, growth trends, and anomalies in aquaculture production or sustainability.
KPI Definition Page
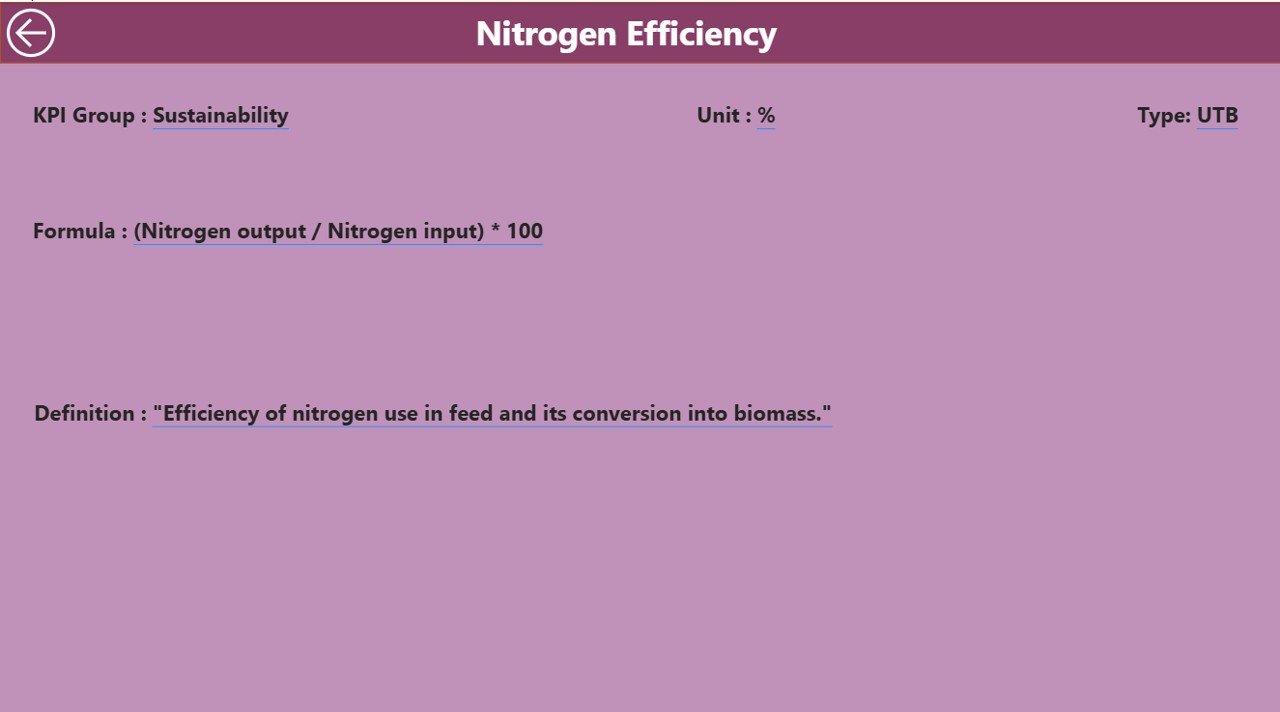
This is a drill-through page, usually hidden from the main view.
Displays detailed KPI definitions including:
- Formula used
- Description of KPI
- KPI Type (UTB or LTB)
From the summary page, users can drill through into this section to understand the logic behind each metric.
The page also includes a back button to navigate easily to the main dashboard.
Data Source: Excel Integration
The backbone of the Aquaculture KPI Dashboard is an Excel file with three critical sheets:
Input_Actual:
- Fields: KPI Name, Month (first date of month), MTD numbers, YTD numbers.
- Used to capture actual performance data.
Input_Target:
- Fields: KPI Name, Month, MTD target, YTD target.
- Used to set performance benchmarks.
KPI Definition:
- Fields: KPI Number, KPI Group, KPI Name, Unit, Formula, Definition, KPI Type.
- Provides context and ensures consistent measurement.
This structure ensures data accuracy and supports smooth integration into Power BI.
Click to Purchases Aquaculture KPI Dashboard in Power BI
Examples of Aquaculture KPIs
Some commonly used KPIs in aquaculture include:
-
Production KPIs
-
Feed Conversion Ratio (FCR)
-
Survival Rate (%)
-
Harvest Weight (kg/fish)
-
Growth Rate (g/day)
-
-
Financial KPIs
-
Revenue per Ton of Fish
-
Operating Cost per kg of Fish
-
Profit Margin (%)
-
-
Sustainability KPIs
-
Water Usage Efficiency
-
Energy Consumption per Ton of Production
-
CO2 Emissions Reduction
-
-
Quality KPIs
-
% of Fish Meeting Quality Standards
-
Incidents of Disease Outbreaks
-
Customer Complaints Rate
-
These KPIs can be tracked monthly (MTD) or annually (YTD) for better decision-making.
Advantages of an Aquaculture KPI Dashboard in Power BI
Using this dashboard brings several benefits:
✅ Centralized Insights: All KPIs are visible in one place.
✅ Data-Driven Decisions: Managers rely on facts, not assumptions.
✅ Real-Time Monitoring: Quickly identify issues and respond faster.
✅ Historical Comparison: Compare current performance with previous years.
✅ Improved Productivity: Focus on KPIs that directly affect growth.
✅ Customizable Views: Filter by KPI Group, Month, or individual indicators.
✅ Better Accountability: Each department can see its contribution to overall results.
Opportunities for Improvement
Even with a powerful dashboard, aquaculture businesses may face challenges. Opportunities for improvement include:
🔹 Expanding data sources beyond Excel (SQL, IoT sensors, ERP systems).
🔹 Automating data refresh to reduce manual updates.
🔹 Adding predictive analytics for forecasting growth and risks.
🔹 Integrating environmental data for better sustainability insights.
🔹 Training staff to use dashboard insights effectively.
Best Practices for Using Aquaculture KPI Dashboards
To get the most out of your dashboard:
-
Define Clear KPIs: Ensure each KPI has a purpose and aligns with business goals.
-
Keep Data Clean: Validate Excel inputs to avoid errors.
-
Use Visual Indicators: Arrows, icons, and colors make trends easy to understand.
-
Automate Where Possible: Schedule data refreshes for up-to-date insights.
-
Encourage Adoption: Train teams and explain how the dashboard supports decision-making.
-
Review Regularly: Update KPI definitions and targets based on industry trends.
How Does the Dashboard Support Sustainable Aquaculture?
Sustainability is a growing concern in aquaculture. By tracking KPIs like feed efficiency, water use, and CO2 emissions, businesses can:
-
Reduce waste
-
Minimize environmental impact
-
Improve regulatory compliance
-
Build a reputation for responsible farming
This makes the dashboard not only a performance tool but also a sustainability tracker.
Conclusion
The Aquaculture KPI Dashboard in Power BI is a game-changer for the aquaculture industry. It transforms raw data into meaningful insights, helping businesses monitor production, financials, quality, and sustainability in real time.
By using this dashboard, aquaculture managers can set realistic targets, track performance, and respond quickly to challenges. Combined with best practices and continuous improvement, the dashboard becomes a vital tool for building a profitable and sustainable aquaculture business.
Frequently Asked Questions (FAQs)
1. What is an Aquaculture KPI Dashboard?
It is a Power BI-based tool that tracks and visualizes performance metrics for aquaculture operations like production, finance, and sustainability.
2. Why is Power BI suitable for aquaculture KPI tracking?
Power BI integrates with Excel, provides interactive visuals, and supports real-time analysis, making it ideal for monitoring aquaculture data.
3. What are the key pages of the Aquaculture KPI Dashboard?
-
Summary Page
-
KPI Trend Page
-
KPI Definition Page
4. What kind of data is needed for the dashboard?
You need actual performance data, target data, and KPI definitions, usually maintained in Excel sheets.
5. Can this dashboard help in sustainability tracking?
Yes. By monitoring water usage, feed efficiency, and emissions, it supports eco-friendly practices.
6. How often should I update the dashboard data?
Monthly updates are common, but automated daily or weekly updates can provide real-time accuracy.
7. Can small fish farms use this dashboard?
Absolutely. The dashboard is scalable and works for both small and large aquaculture businesses.
8. Is training required to use this dashboard?
Yes, basic Power BI training ensures managers and staff can interpret the data effectively.
Visit our YouTube channel to learn step-by-step video tutorials