Introduction
The Art Gallery KPI Scorecard is a powerful and ready-to-use template designed to help art galleries track and analyze their key performance indicators (KPIs) efficiently. This scorecard offers a comprehensive, visual, and user-friendly way to monitor the health of your gallery’s operations and performance over time. Whether you want to measure visitor engagement, sales growth, or operational efficiency, this KPI scorecard simplifies your monitoring process and drives informed decision-making.
Key Features of Art Gallery KPI Scorecard
- Multiple Worksheets: The template includes four distinct worksheets to manage data input, KPI definitions, scorecard visualization, and trend analysis.
- Dynamic Dropdown Menus: Easily switch between different periods (Month, MTD, YTD) and KPIs for customized performance views.
- Actual vs Target Comparison: Quickly assess how your gallery is performing against set goals.
- Visual Indicators: Utilizes color-coded formatting and charts to highlight performance status at a glance.
- Trend Analysis: MTD and YTD trend charts help identify progress and patterns over time.
- Comprehensive KPI Details: Clearly define each KPI’s name, unit, formula, and purpose for enhanced clarity.
- Ease of Data Entry: The Input Data sheet simplifies updates, ensuring your data remains current and accurate.
Dashboard Pages Explanation
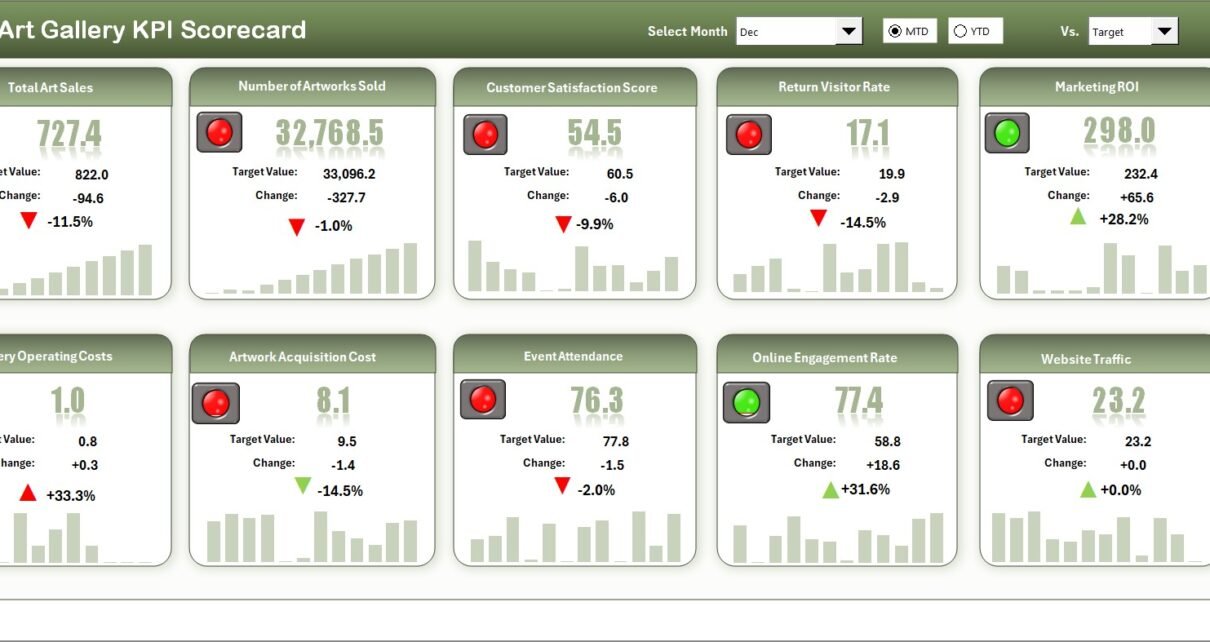
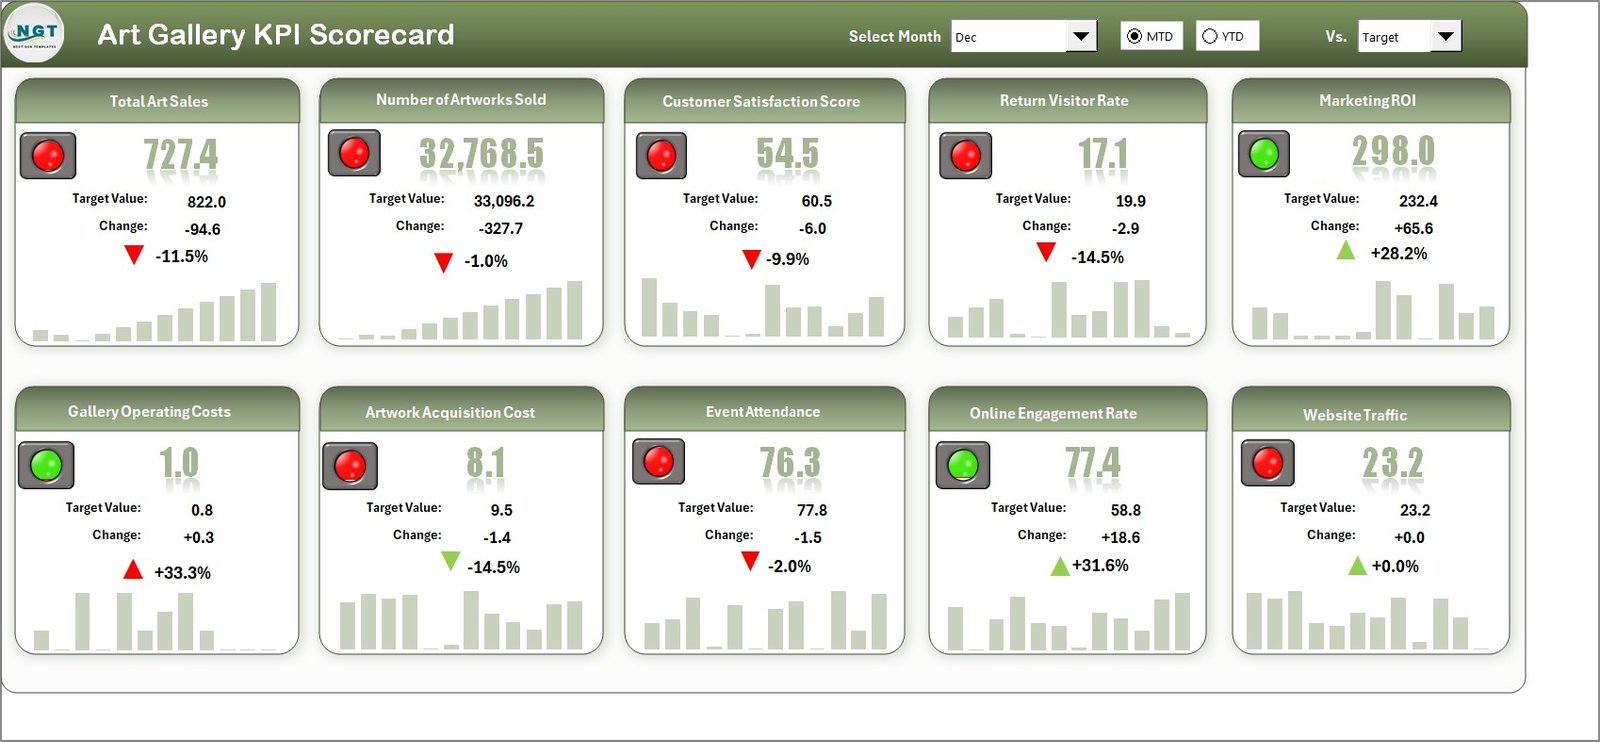
1. Scorecard Sheet
The Scorecard sheet is your main interface for performance visualization.
Click to Buy Art Gallery KPI Scorecard in Excel
- Dropdown Menus: Select the relevant month and view performance as Month-to-Date (MTD) or Year-to-Date (YTD).
- Actual vs Target Values: Immediately see how actual results stack up against goals for transparency.
- Visual Indicators: Color-coded cells or icons highlight performance status for quick interpretation.
- Comprehensive KPI Overview: Information includes both MTD and YTD numbers for a well-rounded picture.
2. KPI Trend Sheet
This sheet allows in-depth trend analysis for specific KPIs.
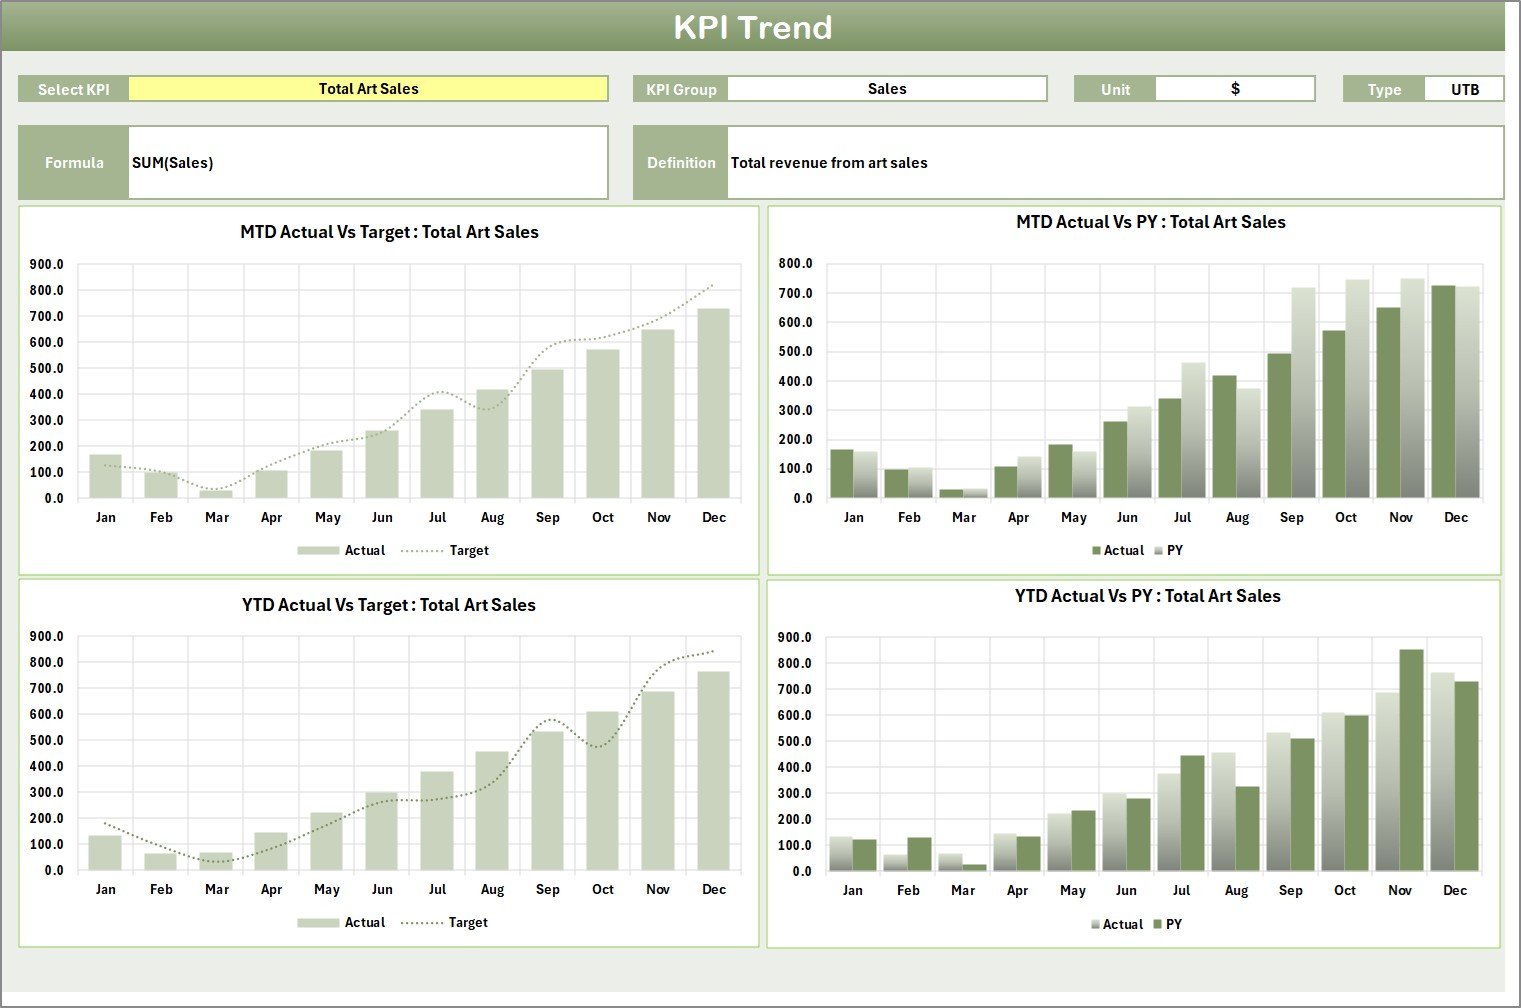 KPI Trend Sheet
- KPI Selection: Use the dropdown in cell C3 to pick a KPI for analysis.
- KPI Details Displayed: View KPI Group, Unit, Type (Lower is Better or Upper is Better), Formula, and Definition for clarity.
- MTD & YTD Trends: Graphs show actual, target, and previous year (PY) values over time to help spot trends and opportunities.
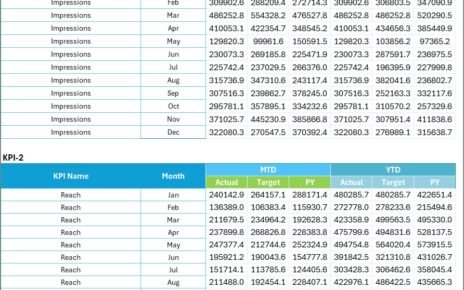
3. Input Data Sheet
This worksheet is the data entry hub for all KPIs.
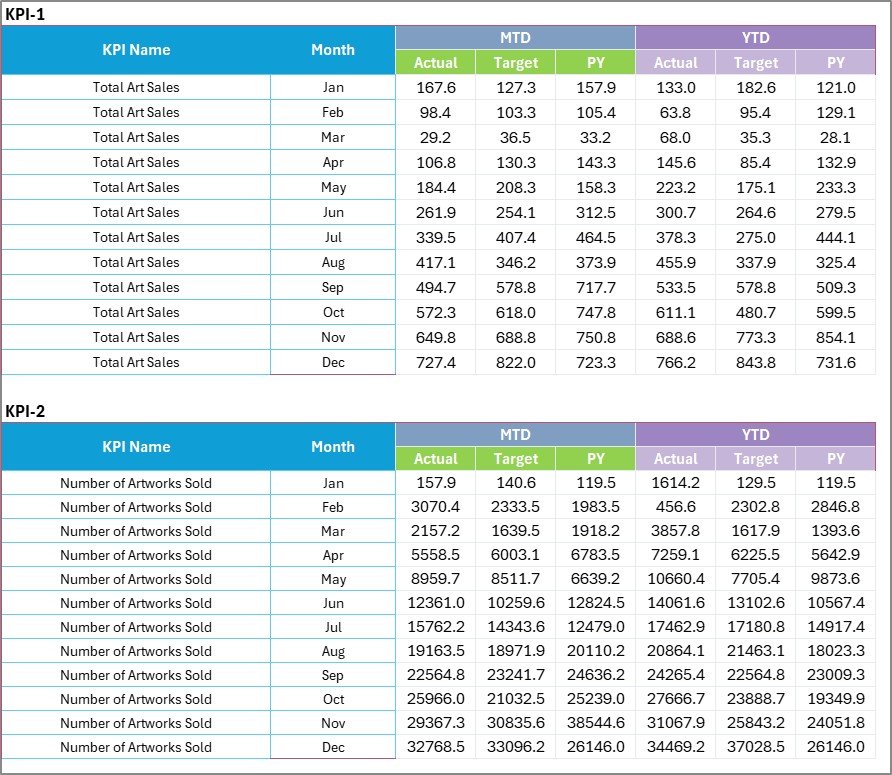 Input Data Sheet
- Data Entry: Enter actual performance figures, target goals, and relevant metrics here.
- Up-to-Date Records: Easily update when new data becomes available to keep your dashboard accurate.
4. KPI Definition Sheet
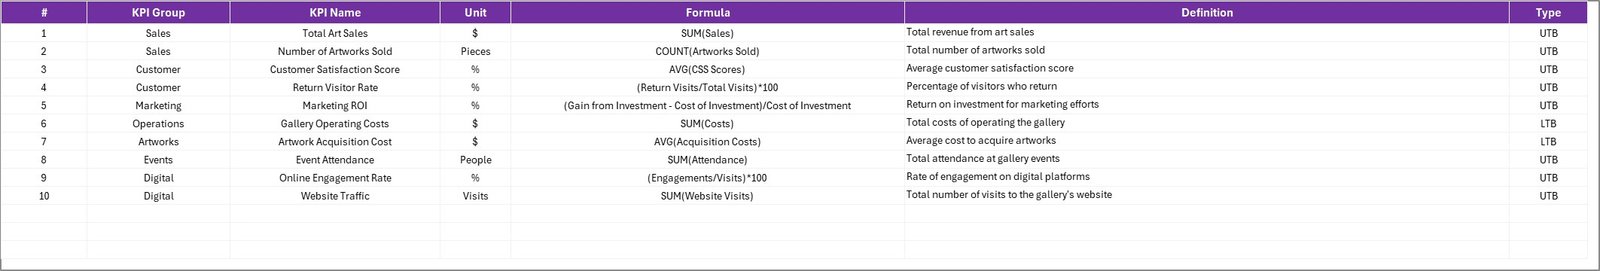
Configure and understand your KPIs with this detailed reference sheet.
- Define KPIs: Input KPI Name, Group, Unit of measure, Formula, and detailed Definition.
- Clarity and Consistency: Ensure KPIs are clearly understood throughout your organization.
Advantages of Art Gallery KPI Scorecard
- Streamlines Performance Tracking: Centralizes key metrics for quick, efficient evaluation.
- Facilitates Informed Decisions: Visual and numerical data help managers respond promptly to performance changes.
- User-Friendly Interface: Designed for ease of use, requiring minimal training.
- Customizable and Scalable: Easily accommodates additional KPIs or periods as your gallery grows.
- Improves Accountability: Transparent visuals hold teams accountable for targets.
Opportunities for Improvement
Click to Buy Art Gallery KPI Scorecard in Excel
- Integration with Real-Time Systems: Linking to live data sources can enhance accuracy and reduce manual input.
- Mobile Compatibility: A mobile-friendly version may increase accessibility for on-the-go managers.
- Advanced Analytics: Incorporating predictive analytics could provide deeper insights into future performance trends.
- Enhanced Visual Customization: Allowing users to customize visuals or KPIs displayed for tailored reporting.
Best Practices
- Regularly Update Data: Maintain data accuracy by updating the Input Data sheet promptly.
- Set Realistic Targets: Ensure KPI targets are challenging yet achievable to motivate improvement.
- Review KPIs Periodically: Evaluate and adjust KPIs to stay aligned with strategic gallery goals.
- Train Staff: Educate your team on how to interpret the scorecard results effectively.
- Use Visuals for Communication: Leverage color-coded visuals to communicate performance in meetings and reports clearly.
FAQs
Click to Buy Art Gallery KPI Scorecard in Excel
What is the primary purpose of the Art Gallery KPI Scorecard?
Its main goal is to track and analyze vital performance indicators to improve decision-making and operational success in an art gallery.
Can the KPI Scorecard be customized?
Yes, you can modify KPI groups, add new KPIs, and adjust targets to fit your gallery’s unique needs.
Is technical expertise required to use the template?
The scorecard is user-friendly and does not require advanced technical skills, making it accessible to most users.
How often should I update the data?
Ideally, update the input data as frequently as new KPIs are available, whether monthly or quarterly, to maintain relevance.
Conclusion
The Art Gallery KPI Scorecard is an essential tool for galleries aiming to monitor and enhance their operational and financial performance effectively. Its intuitive layout, comprehensive KPI tracking, and visual insights empower managers to drive growth and success. Leveraging this template will enable you to focus on what truly matters – nurturing art and delivering excellent visitor experiences.
To learn more about how to maximize this template, visit Microsoft’s Excel support page for advanced dashboard techniques and tips.
Visit our YouTube channel to watch the demo.
Click to Buy Art Gallery KPI Scorecard in Excel