In today’s rapidly growing spiritual and wellness industry, astrology businesses generate a huge amount of data every single day. They manage bookings, session fees, package values, client satisfaction scores, and service performance. However, when this data stays scattered across spreadsheets and tools, it becomes difficult to understand what is really happening in the business.
As a result, many astrologers and spiritual service providers struggle to make informed decisions.
So, how can you transform your raw data into meaningful insights and grow your business faster?
The answer is the Astrology and Spiritual Services Dashboard in Power BI.
This powerful and interactive dashboard helps you track, analyze, and optimize your astrology or spiritual services business in one place. Moreover, it converts complex data into easy-to-understand visuals, KPIs, and trends. Therefore, you can quickly identify what is working and what needs improvement.
In this complete guide, you will learn everything about this dashboard, including its features, benefits, usage, best practices, and FAQs.
Click to Purchases Astrology and Spiritual Services Dashboard in Power BI
What Is an Astrology and Spiritual Services Dashboard in Power BI?
An Astrology and Spiritual Services Dashboard in Power BI is a business intelligence tool that helps you monitor key performance indicators (KPIs) for your astrology or spiritual services business.
Instead of relying on multiple reports, you can centralize all your data into one interactive dashboard. As a result, you can:
-
Track total bookings and session fees
-
Monitor package value and satisfaction scores
-
Analyze client demographics and zodiac trends
-
Evaluate practitioner performance
-
Identify growth opportunities quickly
Moreover, Power BI provides real-time data visualization, which makes your analysis faster and more accurate.
Why Do You Need a Power BI Dashboard for Astrology Services?
Today, astrology businesses operate both online and offline. Therefore, managing multiple data sources becomes challenging.
Without a dashboard:
-
You cannot easily track performance
-
You miss important trends
-
You spend too much time on manual reporting
-
You struggle to improve customer satisfaction
However, with this Power BI dashboard, you gain complete control over your data. Consequently, you can make smarter decisions and grow your business efficiently.
Key Features of Astrology and Spiritual Services Dashboard
This dashboard includes advanced features that make it highly effective and easy to use.
📌 Interactive Slicers
Each page includes interactive slicers, which allow you to filter data instantly. Therefore, you can analyze specific segments such as service type, booking source, or time period.
📊 Multi-Page Analytical Dashboard
This Power BI dashboard includes 5 powerful pages, each designed for a specific type of analysis.
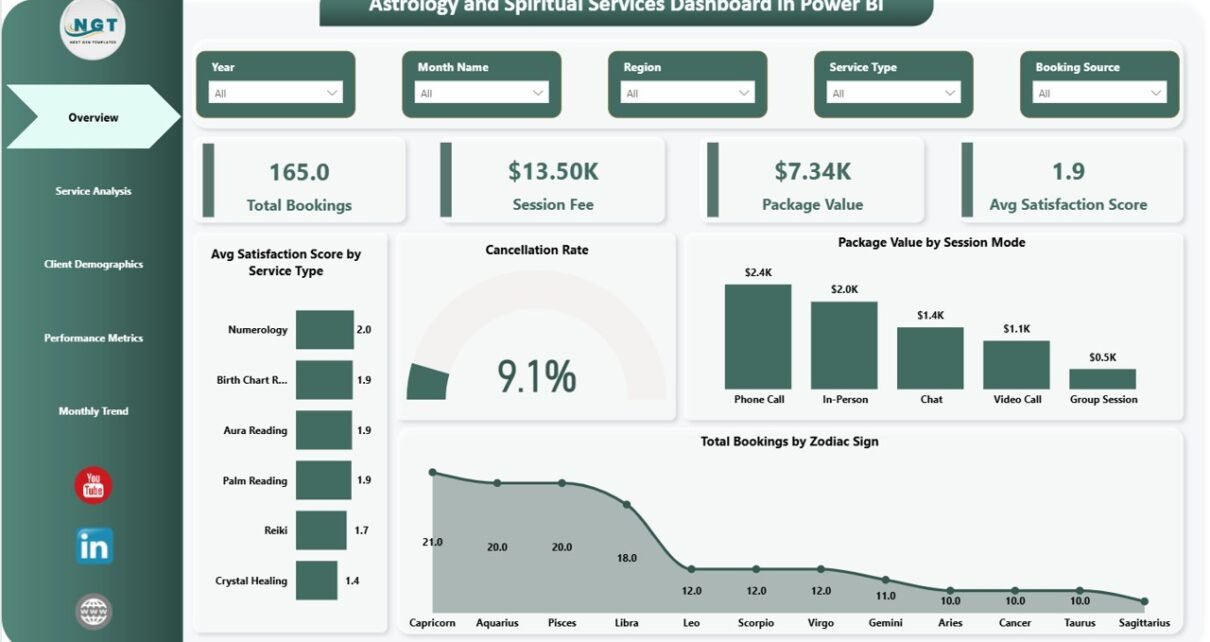
📊 1. Overview Page – Quick Business Insights

The Overview Page provides a snapshot of your entire business performance.
KPI Cards Included:
-
Total Bookings
-
Session Fee
-
Package Value
-
Average Satisfaction Score
Charts Available:
-
Avg Satisfaction Score by Service Type
-
Cancellation Rate
-
Package Value by Session Mode
-
Total Bookings by Zodiac Sign
👉 Therefore, you can quickly understand overall performance and identify key trends.
📊 2. Service Analysis – Which Services Drive Revenue?
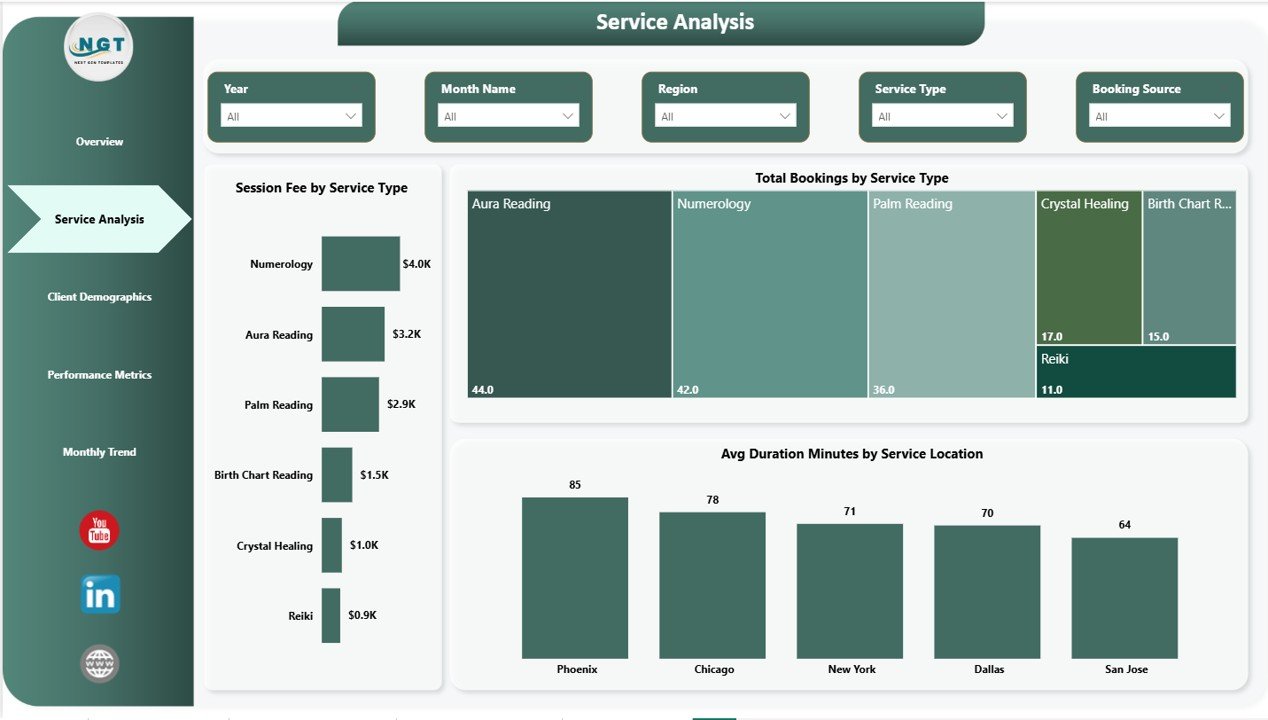
The Service Analysis Page helps you evaluate the performance of different services.
Charts Included:
-
Session Fee by Service Type
-
Total Bookings by Service Type
-
Avg Duration (Minutes) by Service Location
👉 As a result, you can identify high-demand services and optimize pricing strategies.
📊 3. Client Demographics – Understand Your Audience
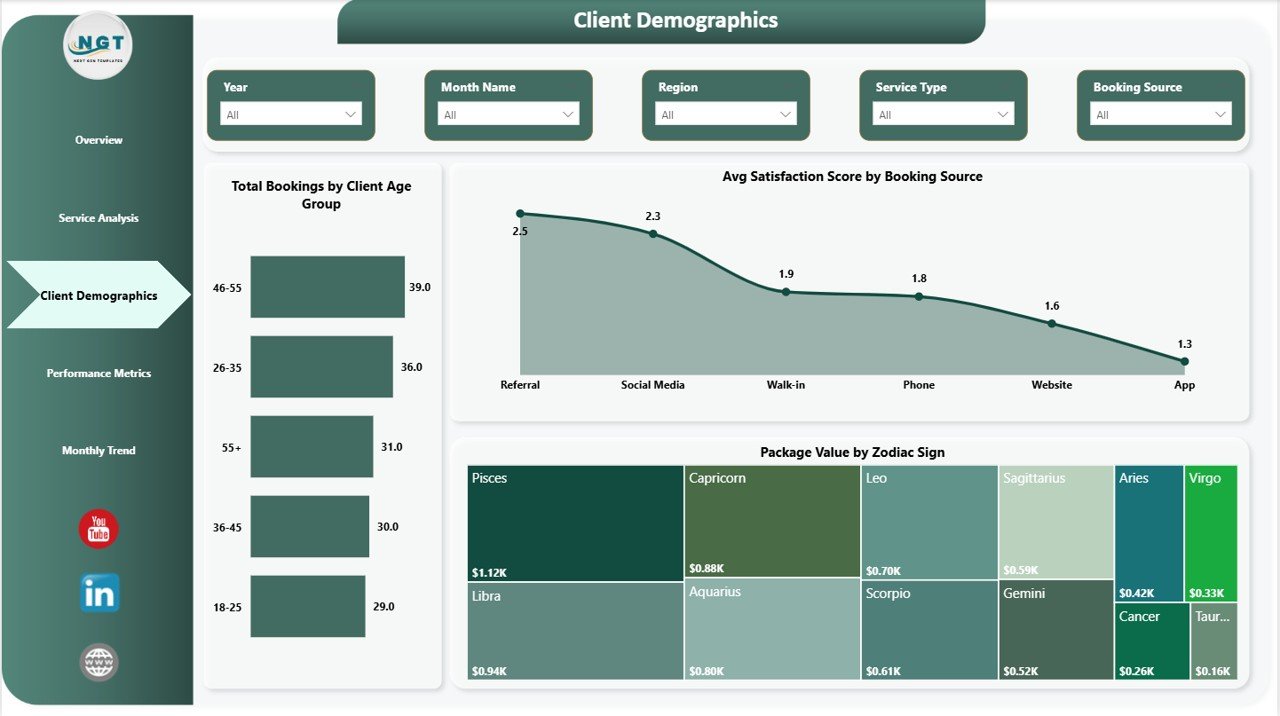
Understanding your clients plays a key role in business success. Therefore, this page focuses on client behavior.
Charts Included:
-
Total Bookings by Client Age Group
-
Avg Satisfaction Score by Booking Source
-
Package Value by Zodiac Sign
👉 Consequently, you can tailor your services to meet client expectations.
📊 4. Performance Metrics – Evaluate Practitioner Efficiency
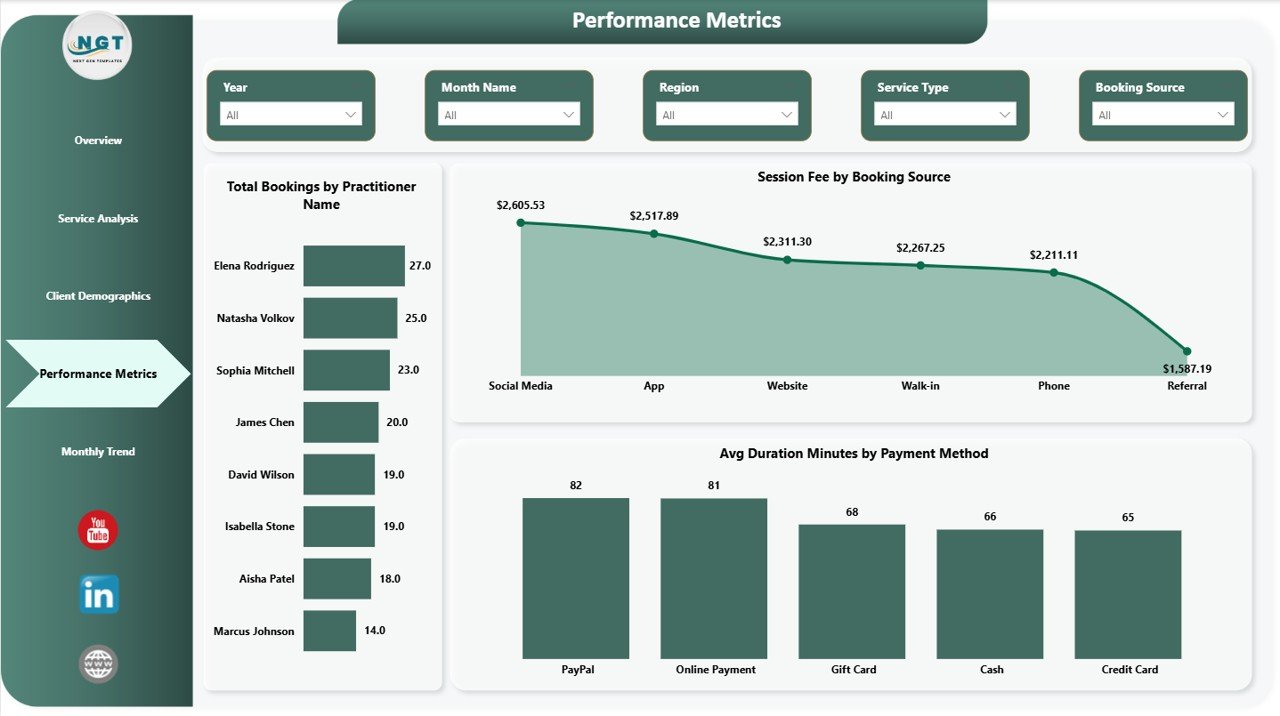
This page helps you measure the performance of practitioners and business operations.
Charts Included:
-
Total Bookings by Practitioner Name
-
Session Fee by Booking Source
-
Avg Duration (Minutes) by Payment Method
👉 Therefore, you can identify top performers and improve efficiency.
📊 5. Monthly Trends – Track Business Growth

The Monthly Trends Page helps you analyze performance over time.
Charts Included:
-
Total Bookings by Month Name
-
Session Fee by Month Name
-
Avg Duration (Minutes) by Month Name
👉 As a result, you can identify seasonal trends and plan your business strategies accordingly.
Advantages of Astrology and Spiritual Services Dashboard in Power BI
Using this dashboard provides multiple benefits.
✅ Real-Time Insights
Power BI updates data in real time. Therefore, you always have the latest insights.
✅ Better Decision-Making
You can analyze KPIs quickly. As a result, you can make informed decisions faster.
✅ Improved Customer Experience
You can track satisfaction scores. Consequently, you can improve service quality.
✅ Enhanced Revenue Tracking
You can monitor session fees and package values. Therefore, you can focus on profitable services.
✅ Data-Driven Growth
You can identify trends and opportunities. As a result, your business grows faster.
Click to Purchases Astrology and Spiritual Services Dashboard in Power BI
How to Use the Astrology Dashboard in Power BI?
Using this dashboard is simple and effective.
Step 1: Import Data
Load your data into Power BI from Excel or other sources.
Step 2: Connect Data Model
Ensure all tables are properly connected.
Step 3: Use Slicers
Apply filters to analyze specific data segments.
Step 4: Analyze Visuals
Review charts and KPIs to understand trends.
Step 5: Take Action
Use insights to improve services and increase revenue.
Best Practices for the Astrology Dashboard in Power BI
To maximize the benefits of this dashboard, follow these best practices:
🔹 Keep Data Clean
Always maintain accurate and structured data.
🔹 Update Data Regularly
Frequent updates ensure better insights.
🔹 Use Filters Wisely
Focus on specific segments to get deeper insights.
🔹 Monitor KPIs Continuously
Track key metrics regularly to identify issues early.
🔹 Customize Dashboard
Modify visuals and metrics according to your business needs.
Who Can Benefit from This Dashboard?
This dashboard is ideal for:
-
Astrology consultants
-
Tarot readers
-
Spiritual healers
-
Wellness coaches
-
Online astrology platforms
-
Meditation centers
👉 In short, anyone offering spiritual or astrology services can benefit from this dashboard.
How Does This Dashboard Help in Business Growth?
This dashboard plays a crucial role in business growth.
-
It highlights top-performing services
-
It identifies underperforming areas
-
It improves client satisfaction
-
It increases revenue opportunities
Therefore, it becomes a powerful tool for scaling your business.
Common Challenges Without a Dashboard
Without a dashboard, businesses face several challenges:
-
Lack of data visibility
-
Poor decision-making
-
Time-consuming reporting
-
Difficulty in tracking performance
However, this Power BI dashboard solves all these issues effectively.
Conclusion
The Astrology and Spiritual Services Dashboard in Power BI is a powerful tool that helps you manage, analyze, and grow your business efficiently. It transforms raw data into actionable insights, which allows you to make smarter decisions.
Moreover, it saves time, improves performance, and boosts revenue. Therefore, if you want to take your astrology business to the next level, this dashboard is the perfect solution.
Frequently Asked Questions (FAQs)
❓ What is an Astrology Dashboard in Power BI?
It is a data visualization tool that helps track bookings, revenue, and client insights using interactive charts.
❓ Is this dashboard suitable for beginners?
Yes, it is user-friendly and easy to use with basic Power BI knowledge.
❓ Can I customize this dashboard?
Yes, you can modify visuals and KPIs based on your business needs.
❓ Does it support real-time data?
Yes, Power BI supports real-time data updates.
❓ Can I track online and offline bookings?
Yes, you can track both types of bookings easily.
❓ How often should I update the data?
You should update data regularly for accurate insights.
Click to Purchases Astrology and Spiritual Services Dashboard in Power BI
Visit our YouTube channel to learn step-by-step video tutorials