In today’s fast-paced auction industry, data plays a crucial role in driving profitable decisions. Auction houses deal with multiple auctions, bidders, categories, and price fluctuations. However, when this data remains scattered across spreadsheets, it becomes difficult to track performance and identify trends.
So, how can auction houses manage bids, analyze buyer behavior, and improve auction outcomes—all in one place?
Click to buy Auction Houses Dashboard in Power BI
The answer is the Auction Houses Dashboard in Power BI.
This powerful and interactive dashboard transforms complex auction data into clear, visual insights. As a result, auctioneers, analysts, and business owners can make faster and smarter decisions.
In this comprehensive guide, you will learn everything about this dashboard, including its features, structure, advantages, best practices, and FAQs.
What is an Auction Houses Dashboard in Power BI?
An Auction Houses Dashboard in Power BI is a dynamic data visualization tool designed to track and analyze auction-related metrics in real time.
Instead of relying on multiple reports, this dashboard allows you to:
- Monitor auction estimates and winning bids
- Track starting bids and final payments
- Analyze bidder participation and behavior
- Evaluate category-wise auction performance
- Identify monthly trends and patterns
Therefore, auction houses can streamline operations and improve profitability with ease.
Why Do Auction Houses Need a Dashboard?
Managing auction data manually creates confusion and delays decision-making. Moreover, it increases the risk of errors.
However, with a Power BI dashboard:
- You get real-time insights
- You improve transparency
- You enhance bid strategy
- You identify high-performing categories
As a result, auction houses gain a competitive advantage in the market.
Key Features of Auction Houses Dashboard in Power BI
This dashboard comes with 5 fully interactive pages, each designed to deliver specific insights.
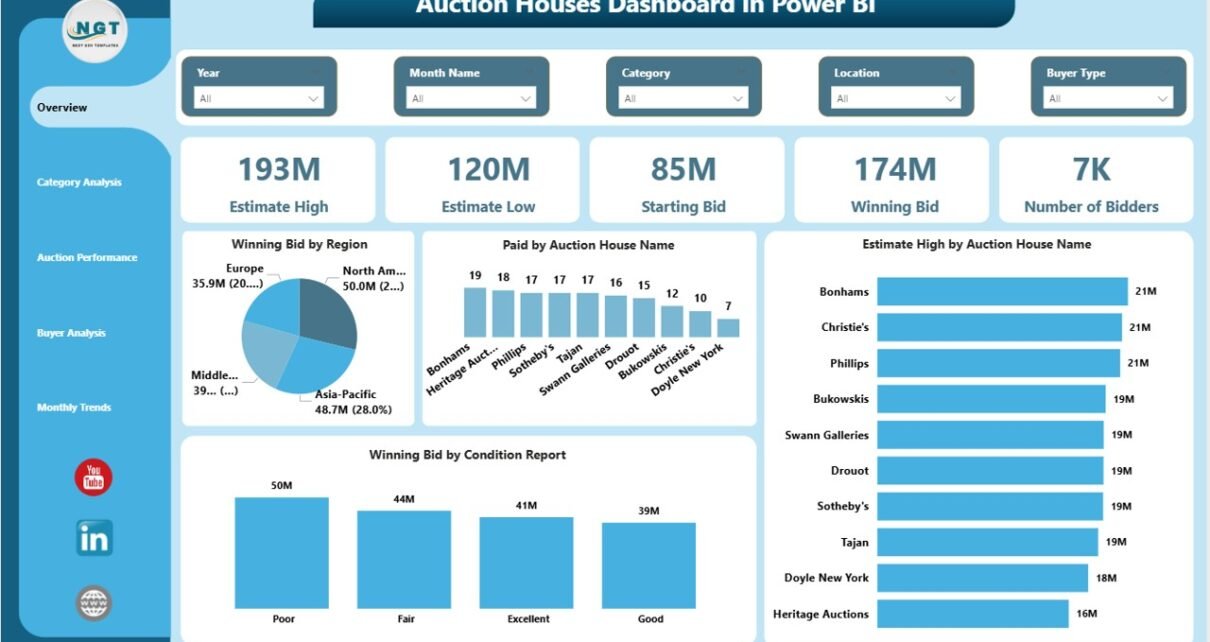
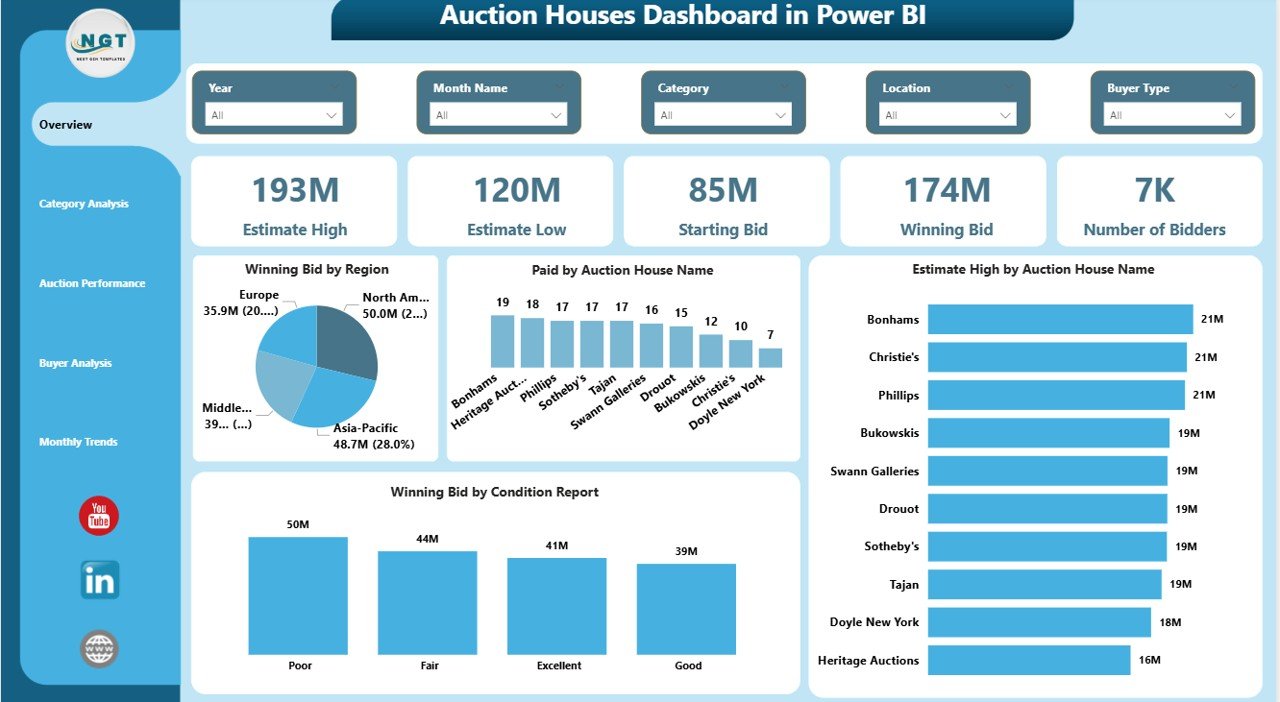
Overview Page – Get a Complete Auction Snapshot
The Overview Page acts as the main dashboard where you can quickly understand overall auction performance.
KPI Cards:
- Estimate High
- Estimate Low
- Starting Bid
- Winning Bid
- Number of Bidders
Charts Included:
- Winning Bid by Region
- Paid Amount by Auction House Name
- Estimate High by Auction Name
- Winning Bid by Condition Report
Therefore, this page gives you a quick summary of auction success and bidding activity.
Click to buy Auction Houses Dashboard in Power BI
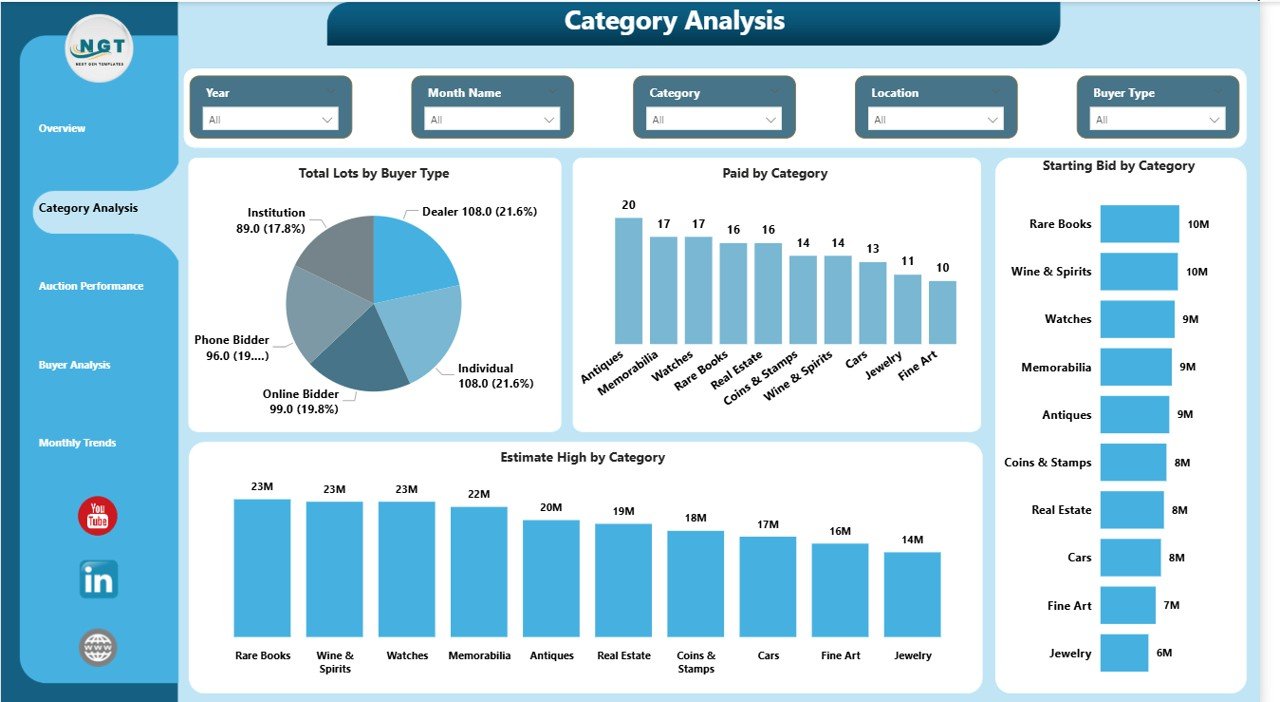
Category Analysis – Which Categories Perform Best?
The Category Analysis Page helps you evaluate performance across different auction categories.
Charts Included:
- Total Lots by Buyer Type
- Paid Amount by Category
- Starting Bid by Category
- Estimate High by Category
As a result, you can easily identify high-performing categories and optimize inventory.
Click to buy Auction Houses Dashboard in Power BI
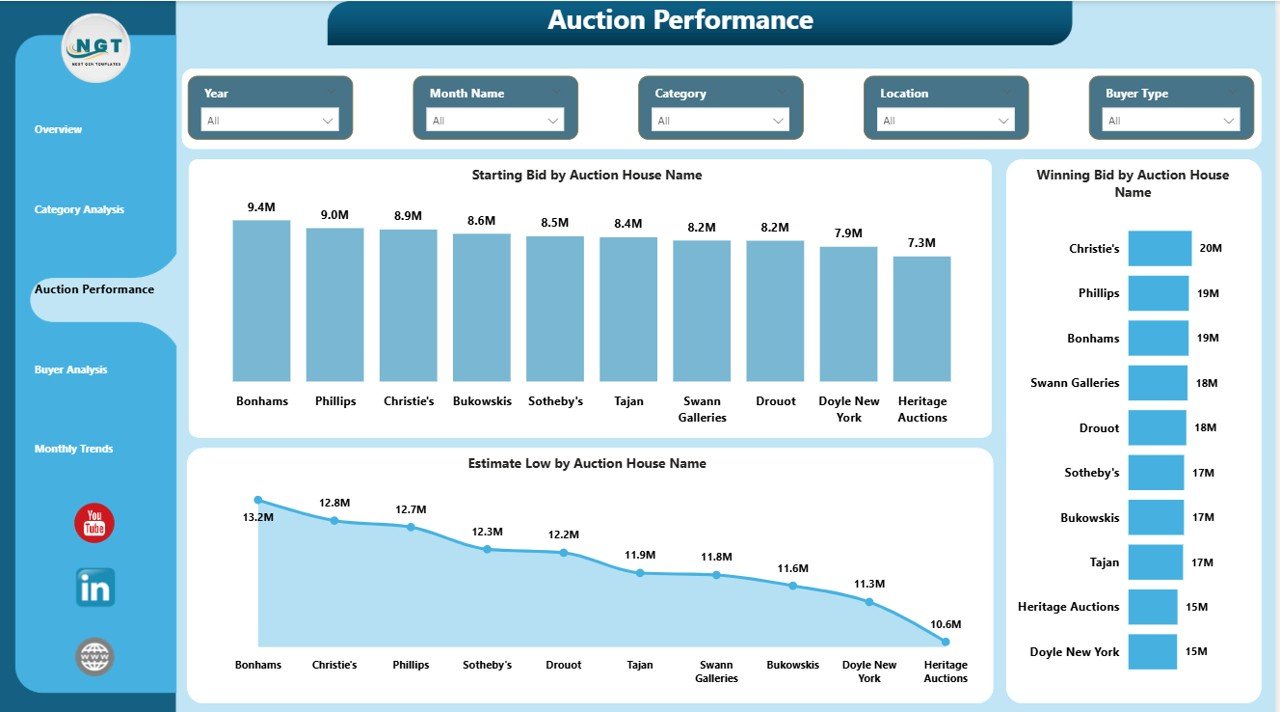
Auction Performance – How Are Auctions Performing?
The Auction Performance Page focuses on auction-specific metrics.
Charts Included:
- Starting Bid by Auction House Name
- Winning Bid by Auction Name
- Estimated Low by Auction Name
Therefore, this page helps you compare auction houses and identify top-performing auctions.
Click to buy Auction Houses Dashboard in Power BI
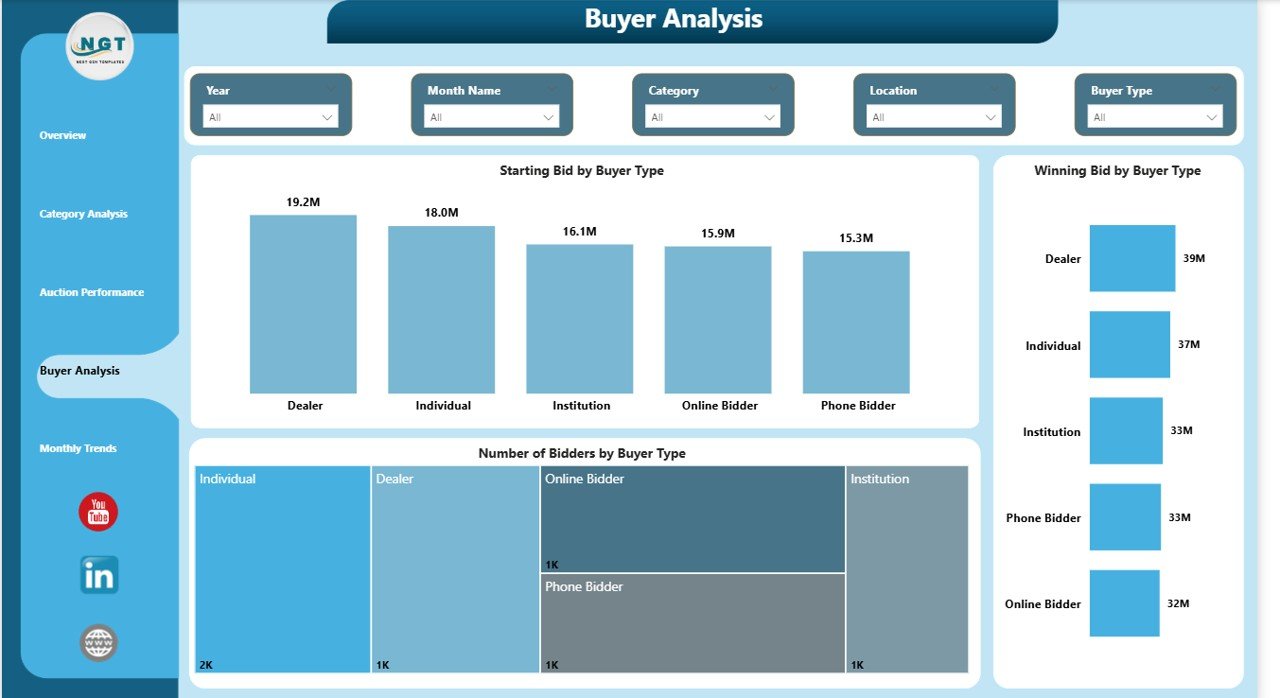
Buyer Analysis – Understand Your Bidders
The Buyer Analysis Page gives insights into bidder behavior.
Charts Included:
- Starting Bid by Buyer Type
- Winning Bid by Buyer Type
- Number of Bidders by Buyer Type
As a result, you can understand buyer preferences and improve targeting strategies.
Click to buy Auction Houses Dashboard in Power BI
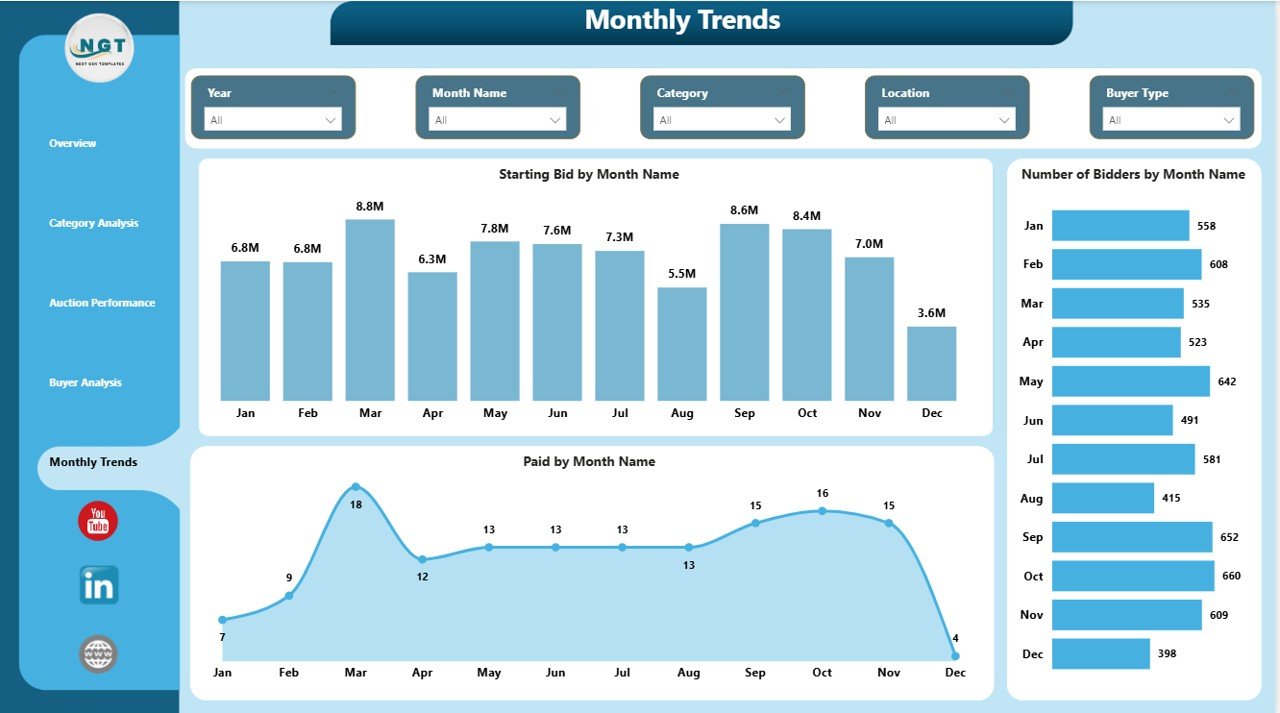
Monthly Trend – Track Auction Trends Over Time
The Monthly Trend Page helps you analyze performance trends across months.
Charts Included:
- Starting Bid by Month
- Number of Bidders by Month
- Paid Amount by Month
Therefore, you can identify seasonal patterns and plan auctions accordingly.
Click to buy Auction Houses Dashboard in Power BI
Advantages of Auction Houses Dashboard in Power BI
Using this dashboard provides several powerful benefits:
Real-Time Data Insights
- Instantly track auction performance
- Make quick and informed decisions
Improved Bid Strategy
- Analyze winning bid patterns
- Optimize starting bids for better outcomes
Better Buyer Understanding
- Identify high-value bidders
- Track participation trends
Enhanced Category Performance
- Focus on profitable categories
- Reduce low-performing inventory
Time-Saving Automation
- Eliminate manual reporting
- Reduce errors and duplication
How Does the Auction Houses Dashboard Work?
The dashboard works using structured data and Power BI visualization tools.
Step-by-Step Process:
- Data Collection
- Gather auction data such as bids, buyers, categories, and payments
- Data Input
- Enter data into structured tables
- Data Processing
- Power BI processes and models the data
- Visualization
- Interactive charts and KPIs display insights
- Analysis & Decision-Making
- Users analyze data and take action
As a result, businesses move from raw data to actionable insights quickly.
Who Can Benefit from This Dashboard?
This dashboard serves multiple professionals:
- Auction Houses & Auctioneers
- Business Analysts
- Auction Managers
- Data Analysts
- Art & Antique Dealers
Therefore, anyone involved in auctions can use this tool effectively.
Key Metrics Tracked in the Dashboard
The dashboard tracks essential auction KPIs:
- Winning Bid Value
- Starting Bid Amount
- Estimate High & Low
- Number of Bidders
- Paid Amount
- Category Performance
- Buyer Participation
These metrics help you measure success and improve strategies.
How to Use the Auction Houses Dashboard Effectively?
Follow these simple steps to maximize its value:
Step 1: Update Data Regularly
Keep data accurate and up to date
Step 2: Use Filters (Slicers)
Filter by auction name, category, or buyer type
Step 3: Analyze Trends
Look at monthly and category trends
Step 4: Compare Performance
Compare auctions and regions
Step 5: Take Action
Use insights to improve bidding strategies
Best Practices for the Auction Houses Dashboard
To get the best results, follow these proven practices:
Maintain Data Accuracy
- Always validate your data
- Avoid missing or incorrect values
Use Consistent Data Format
- Standardize currency, dates, and categories
Focus on Key KPIs
- Do not overload the dashboard
- Highlight important metrics
Leverage Filters and Drill-Down
- Use slicers to explore deeper insights
Review Performance Regularly
- Analyze trends weekly or monthly
As a result, you ensure better insights and decision-making.
Common Challenges and How to Overcome Them
Data Inconsistency
Solution: Use standardized formats
Too Much Data
Solution: Focus on relevant KPIs
Lack of Insights
👉 Solution: Use visual charts and comparisons
Poor Data Updates
Solution: Automate data refresh
Future Scope of Auction Analytics
The auction industry continues to evolve. Therefore, dashboards will become even more advanced.
Future Trends:
- AI-based price prediction
- Real-time bidding analytics
- Predictive buyer behavior
- Automated reporting systems
As a result, auction houses will gain deeper insights and better control.
Conclusion
The Auction Houses Dashboard in Power BI is a powerful tool that simplifies auction data analysis and enhances decision-making. It provides a complete view of bids, buyers, categories, and trends in one place.
Moreover, it helps auction houses improve strategies, increase profitability, and save time. Therefore, adopting this dashboard can transform the way auctions are managed.
If you want to stay competitive in the auction industry, this dashboard is a must-have solution.
Frequently Asked Questions (FAQs)
- What is the main purpose of this dashboard?
It helps track and analyze auction data such as bids, buyers, and performance metrics.
- Can beginners use this dashboard?
Yes, it is user-friendly and easy to navigate.
- Does it support real-time data?
Yes, Power BI allows real-time or scheduled data updates.
- Can I customize the dashboard?
Yes, you can modify KPIs, charts, and filters.
- What tools are required to use it?
You need Microsoft Power BI Desktop or Power BI Service.
- Is this dashboard suitable for all auction types?
Yes, it works for art, antiques, online auctions, and more.
- How often should I update the data?
You should update it daily or weekly for accurate insights.
Visit our YouTube channel to learn step-by-step video tutorials
Click to buy Auction Houses Dashboard in Power BI