In today’s fast-paced financial world, managing tax filings has become more complex than ever. Businesses, accountants, and tax professionals handle large volumes of data, including income details, deductions, tax liabilities, refunds, and compliance requirements. Automated Tax Filing Dashboard in Excel However, when this data remains scattered across multiple spreadsheets, errors increase and efficiency decreases.
So, how can you simplify tax filing, reduce errors, and improve compliance—all in one place?
👉 The answer is the Automated Tax Filing Dashboard in Excel.
This powerful, ready-to-use Excel dashboard helps you track, analyze, and manage tax data efficiently. Moreover, it transforms raw data into clear and interactive insights. Therefore, you can make faster and more accurate decisions.
In this detailed guide, you will learn everything about this dashboard, including features, advantages, best practices, and FAQs.
Click to Purchases Automated Tax Filing Dashboard in Excel
📌 What is an Automated Tax Filing Dashboard in Excel?
An Automated Tax Filing Dashboard in Excel is an advanced data management and visualization tool designed to track and analyze tax-related information in a structured and automated way.
Instead of manually reviewing tax reports, you can:
- 📈 Track total filings and tax liabilities
- 💰 Monitor refunds and penalties
- ⚖️ Analyze compliance and audit risks
- ⏱️ Evaluate processing efficiency
As a result, you can streamline tax operations and improve accuracy.
❓ Why Do You Need an Automated Tax Filing Dashboard?
Managing taxes manually creates several challenges. Therefore, automation becomes essential.
Without a Dashboard:
- Errors increase in calculations
- Data becomes difficult to manage
- Compliance risks grow
With a Dashboard:
- You gain real-time insights
- You reduce manual work significantly
- You improve accuracy and compliance
👉 In short, it helps you manage taxes smarter and faster.
🧩 Key Features of Automated Tax Filing Dashboard in Excel
This dashboard includes 5 interactive analytical pages, designed for complete tax management.
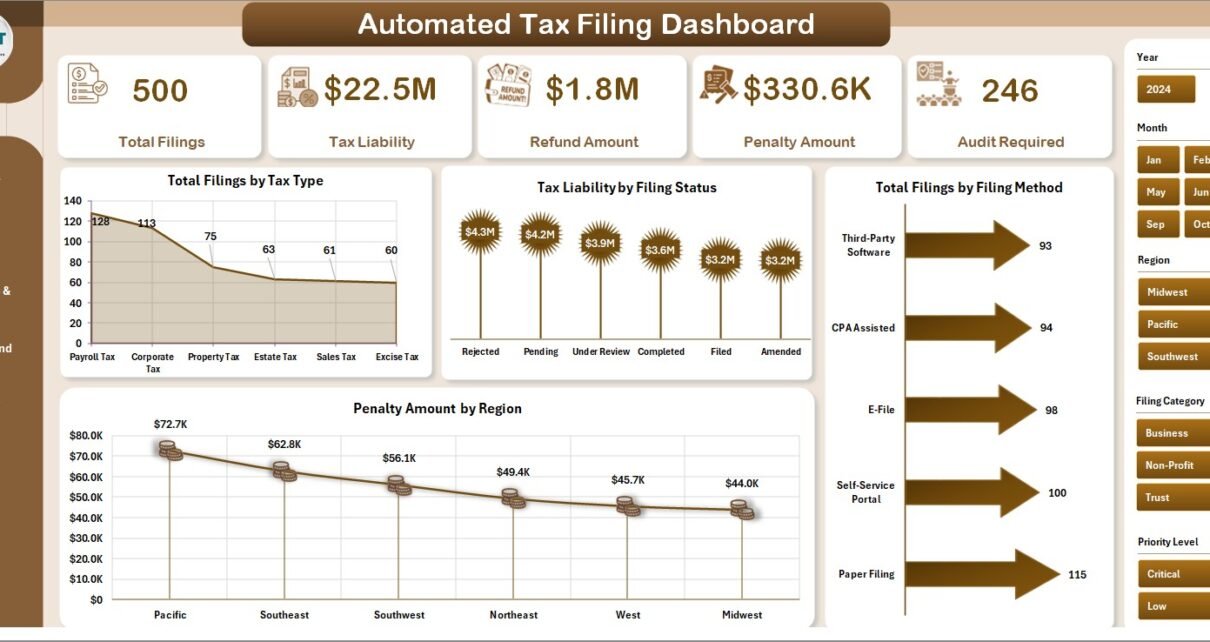
🏠 1. Overview Page – Get a Complete Tax Summary
The Overview Page provides a quick snapshot of all tax activities.
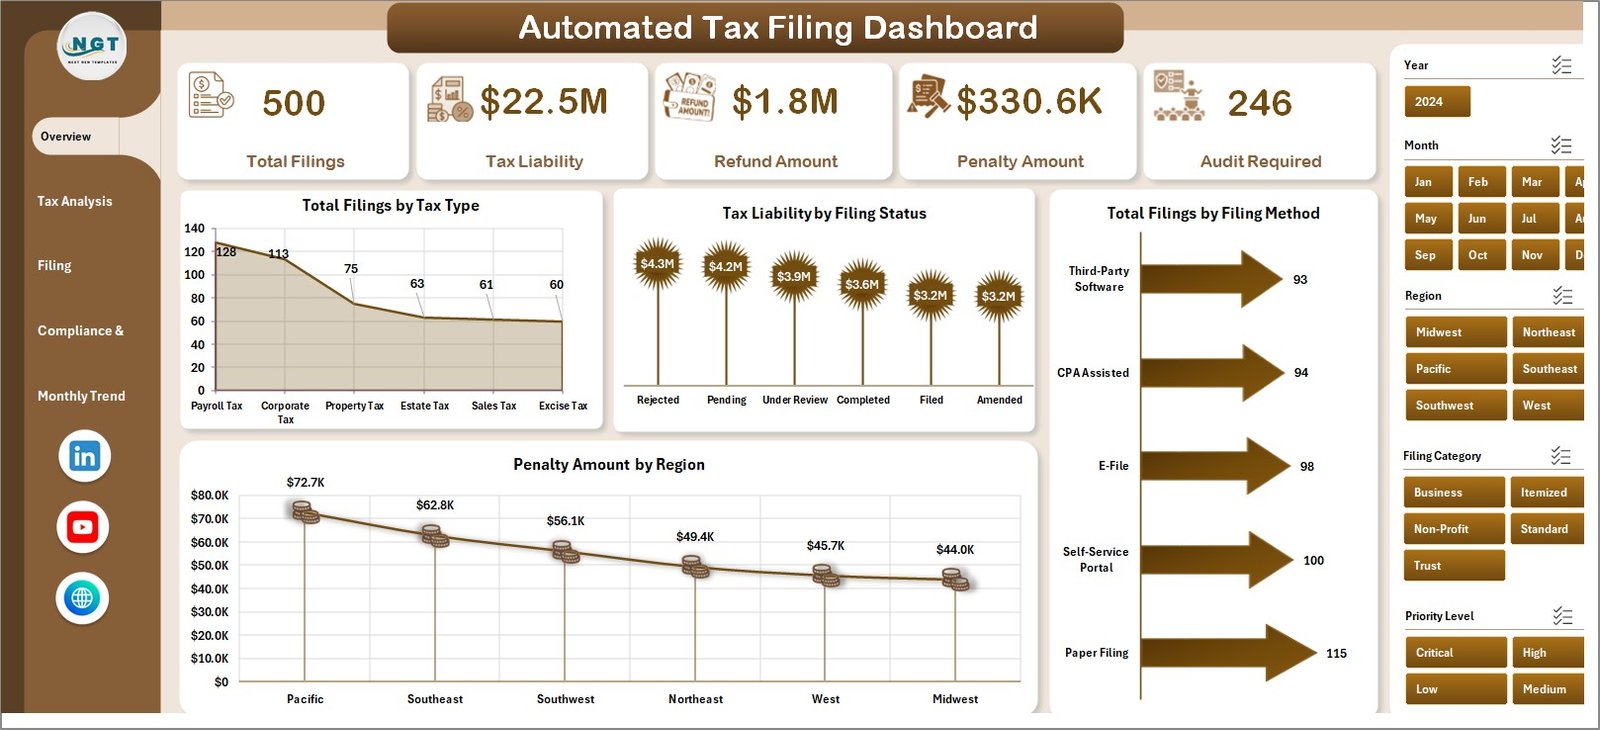
🔑 KPI Cards:
- Total Filings
- Tax Liability
- Refund Amount
- Penalty Amount
- Audit Required
📊 Charts Included:
- Total Filings by Tax Type
- Tax Liability by Filing Status
- Total Filings by Filing Method
- Penalty Amount by Region
👉 Therefore, you can quickly understand overall tax performance.
📊 2. Tax Analysis – Deep Dive into Tax Data
This page helps you analyze tax components in detail.
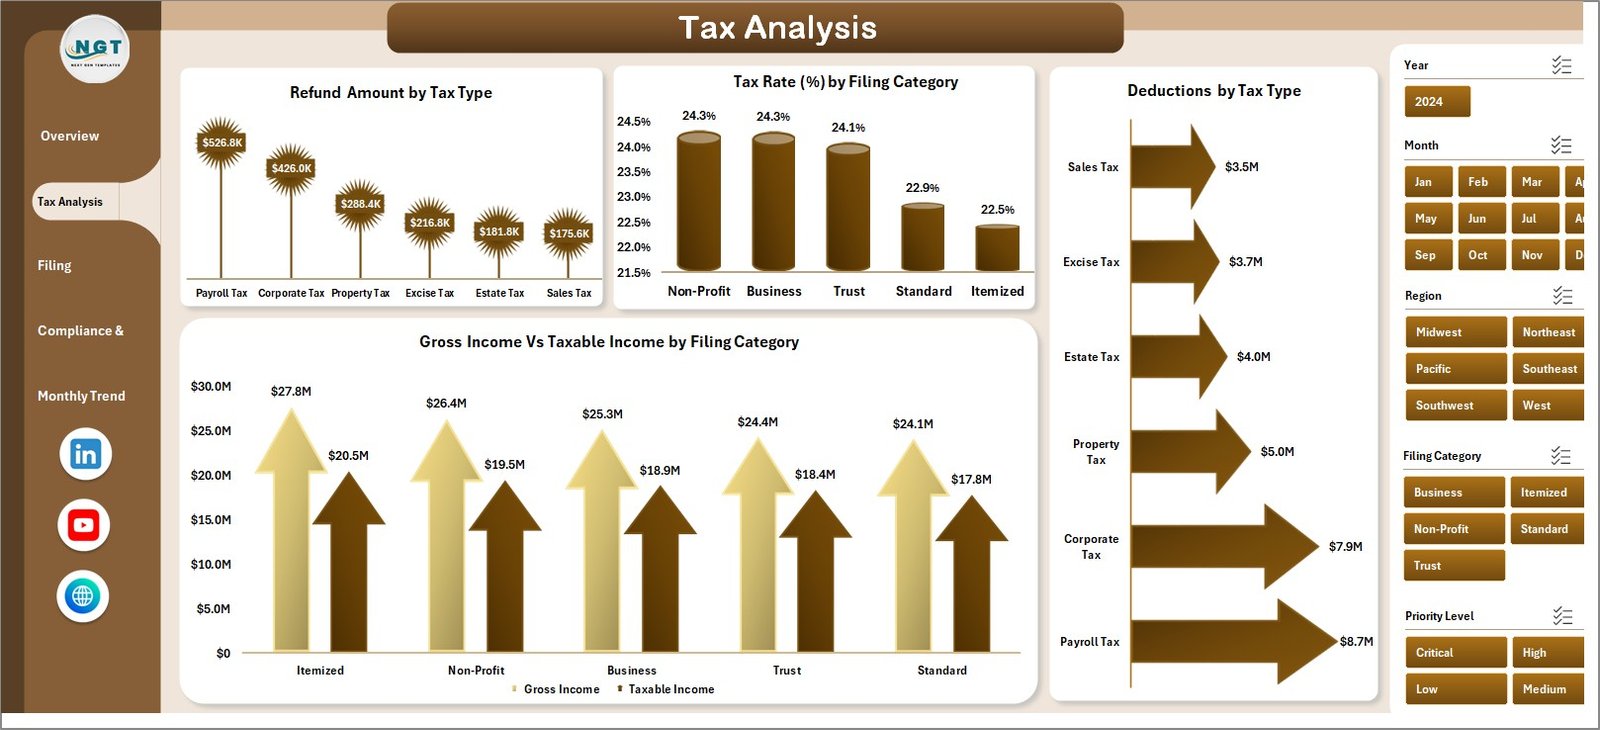
📈 Charts Included:
- Refund Amount by Tax Type
- Tax Rate (%) by Filing Category
- Deductions by Tax Type
- Gross Income vs Taxable Income by Filing Category
👉 As a result, you can optimize tax strategies effectively.
⚙️ 3. Filing Performance – Track Efficiency
This page focuses on filing efficiency and performance.
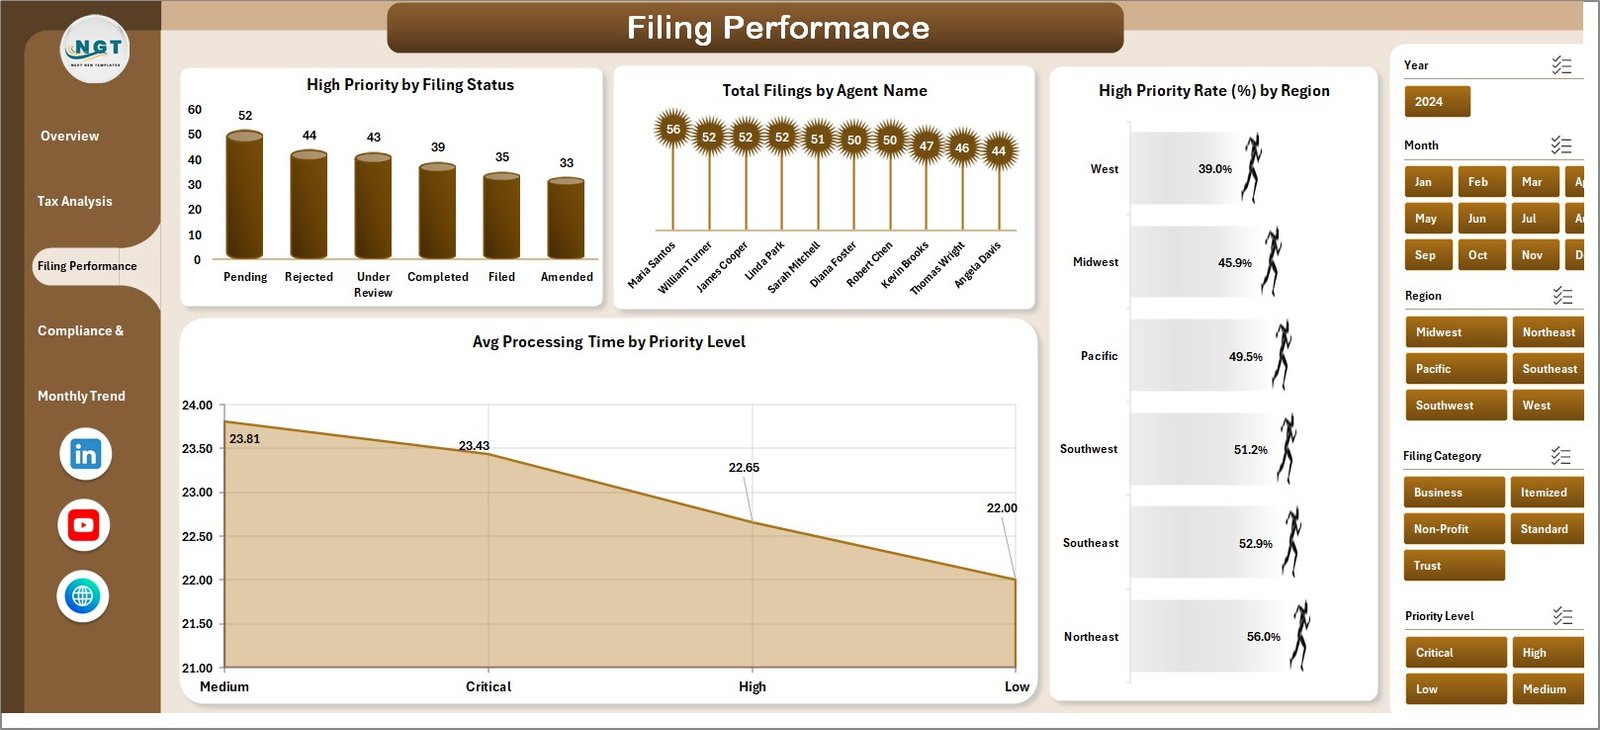
📊 Charts Included:
- High Priority by Filing Status
- Total Filings by Agent Name
- High Priority Rate (%) by Region
- Average Processing Time by Priority Level
👉 Therefore, you can improve operational efficiency.
🔍 4. Compliance & Audit – Manage Risk Effectively
This page ensures compliance and audit tracking.
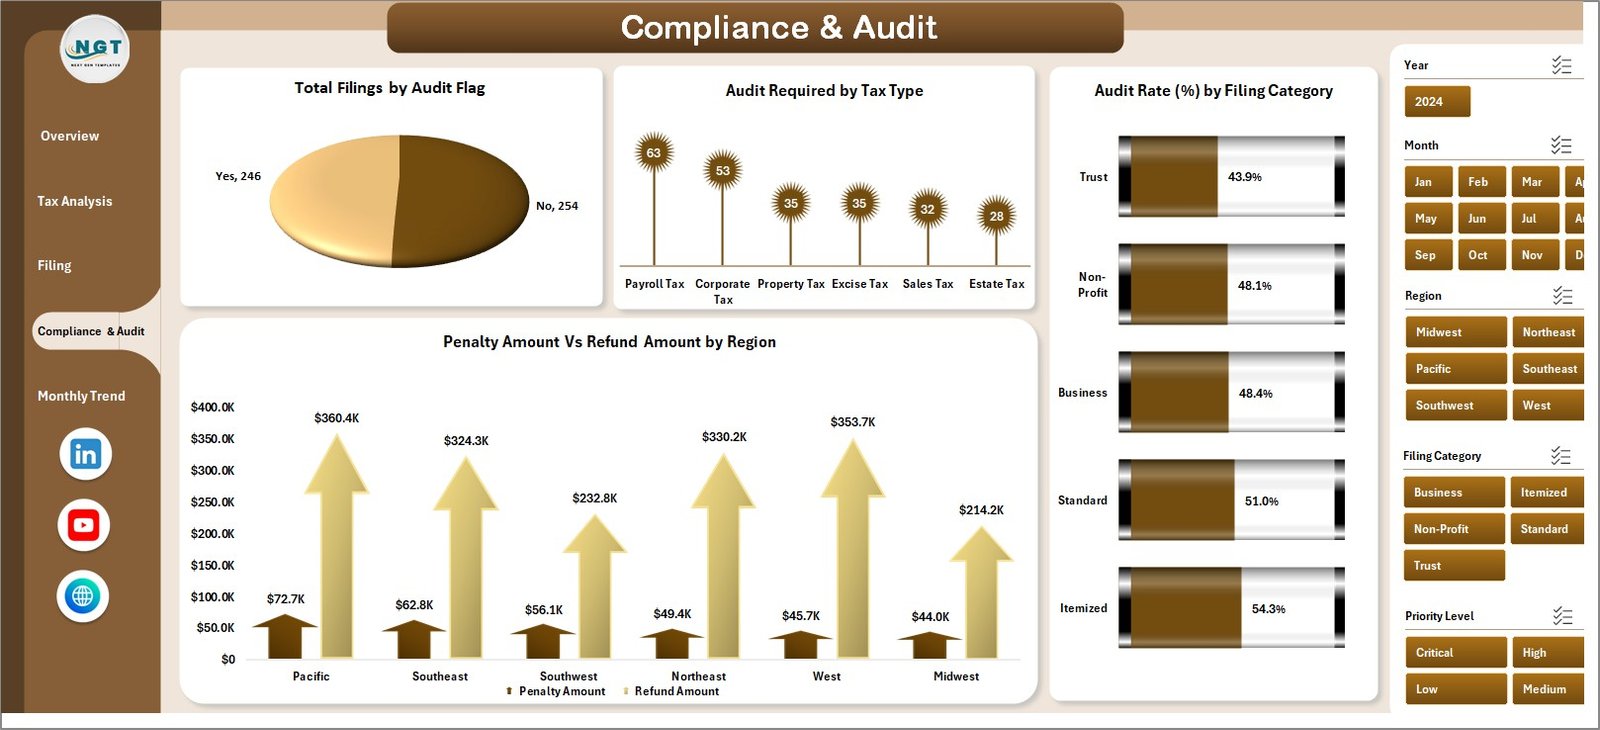
📊 Charts Included:
- Total Filings by Audit Flag
- Audit Required by Tax Type
- Audit Rate (%) by Filing Category
- Penalty Amount vs Refund Amount by Region
👉 Consequently, you can reduce audit risks and penalties.
📅 5. Monthly Trends – Analyze Time-Based Performance
This page helps you track trends over time.
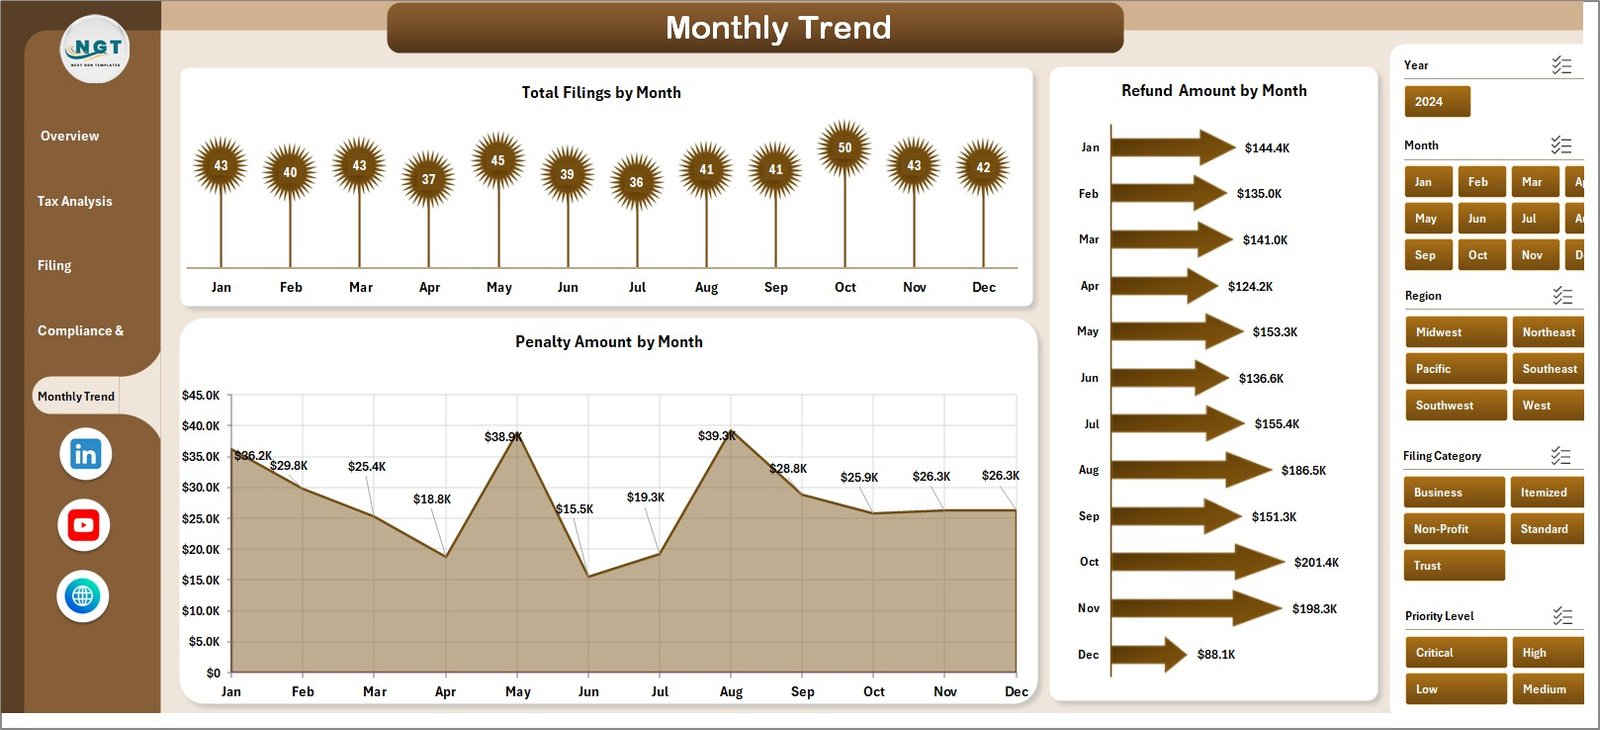
📈 Charts Included:
- Total Filings by Month
- Penalty Amount by Month
- Refund Amount by Month
👉 Therefore, you can identify patterns and improve planning.
🌟 Advantages of Automated Tax Filing Dashboard in Excel
Using this dashboard offers several powerful benefits.
✅ 1. Improved Accuracy
Automation reduces manual errors significantly.
✅ 2. Time-Saving Solution
You can process tax data faster and more efficiently.
✅ 3. Better Compliance Tracking
You can monitor audit requirements and penalties easily.
✅ 4. Real-Time Insights
You can analyze tax performance instantly.
✅ 5. Centralized Data Management
All tax information stays in one place.
✅ 6. Enhanced Decision-Making
Visual insights help you make informed financial decisions.
Click to Purchases Automated Tax Filing Dashboard in Excel
🚀 How to Use the Automated Tax Filing Dashboard?
Using this dashboard is simple and effective.
Step 1: Enter Data
Input tax data into the designated data sheet.
Step 2: Update Data Regularly
Ensure all values are current and accurate.
Step 3: Use Filters (Slicers)
Select tax type, region, or category.
Step 4: Review KPI Cards
Analyze key metrics like tax liability and refunds.
Step 5: Explore Detailed Pages
Dive deeper into tax analysis and compliance.
Step 6: Monitor Trends
Use monthly insights to improve future planning.
👉 As a result, you can manage tax operations efficiently.
📈 Best Practices for the Automated Tax Filing Dashboard
To maximize benefits, follow these best practices:
🔹 Keep Data Clean and Organized
Structured data improves accuracy.
🔹 Update Data Regularly
Frequent updates ensure real-time insights.
🔹 Focus on Key Metrics
Track important KPIs like liability and refunds.
🔹 Use Filters Effectively
Customize views for better analysis.
🔹 Monitor Compliance Closely
Always track audit flags and penalties.
🔹 Train Your Team
Ensure proper usage of the dashboard.
⚠️ Common Challenges and Solutions
🚫 Data Errors
👉 Solution: Validate data before input
🚫 Overloaded Dashboard
👉 Solution: Focus on essential metrics
🚫 Slow Performance
👉 Solution: Optimize formulas and reduce heavy calculations
🚫 Lack of Understanding
👉 Solution: Provide proper training
💡 How This Dashboard Improves Tax Efficiency
💰 Reduce Penalties
You can track penalty trends and avoid mistakes.
📊 Optimize Tax Planning
You can analyze deductions and taxable income.
⏱️ Improve Processing Time
You can monitor efficiency and reduce delays.
🔍 Enhance Audit Readiness
You can identify high-risk filings early.
👉 Therefore, you can improve overall tax performance.
🔮 Future of Tax Automation in Excel
Tax management continues to evolve with technology.
In the future:
- Automation will reduce manual work further
- AI will predict tax risks
- Real-time dashboards will become standard
👉 Therefore, adopting dashboards today ensures long-term success.
🏁 Conclusion
The Automated Tax Filing Dashboard in Excel is a powerful solution for managing tax data efficiently. It helps you track filings, monitor compliance, and improve decision-making.
Moreover, it simplifies complex tax data into easy visuals. Therefore, you can save time, reduce errors, and enhance accuracy.
👉 If you want to streamline tax processes and stay compliant, this dashboard is the perfect solution.
❓ Frequently Asked Questions (FAQs)
1. What is a tax filing dashboard?
It is a tool that helps track and analyze tax data in one place.
2. Can I customize this dashboard?
Yes, you can modify charts, KPIs, and filters.
3. Is Excel enough for tax automation?
Yes, Excel provides powerful features for automation and analysis.
4. How often should I update data?
You should update it regularly for accurate insights.
5. Can this dashboard reduce errors?
Yes, automation significantly reduces manual errors.
6. Who can use this dashboard?
Accountants, businesses, and tax professionals.
7. Does it help with audits?
Yes, it tracks audit flags and compliance metrics.
8. Is it beginner-friendly?
Yes, it is easy to use and understand.
Click to Purchases Automated Tax Filing Dashboard in Excel
Visit our YouTube channel to learn step-by-step video tutorials