In today’s data-driven financial environment, managing tax filings has become more complex and time-sensitive. Businesses, accountants, and tax professionals deal with large volumes of data, including tax liabilities, refunds, deductions, compliance tracking, and audit requirements. Automated Tax Filing Dashboard in Power BI However, when this data is scattered across multiple systems, it leads to errors, delays, and missed opportunities.
So, how can you manage tax filings efficiently, ensure compliance, and gain real-time insights?
👉 The answer is the Automated Tax Filing Dashboard in Power BI.
This powerful and interactive dashboard enables you to track tax data, monitor performance, and analyze compliance in one centralized platform. Moreover, it transforms raw tax data into meaningful insights through dynamic visuals. Therefore, you can make faster, smarter, and more accurate decisions.
In this complete guide, you will learn everything about this dashboard, including its features, advantages, best practices, and frequently asked questions.
Click to Purchases Automated Tax Filing Dashboard in Power BI
📌 What is an Automated Tax Filing Dashboard in Power BI?
An Automated Tax Filing Dashboard in Power BI is a business intelligence tool designed to monitor, analyze, and visualize tax-related data in real time.
Instead of manually reviewing spreadsheets, you can:
- 📈 Track total tax filings and liabilities
- 💰 Monitor refunds and penalty amounts
- ⚖️ Analyze compliance and audit risks
- ⏱️ Measure processing efficiency
As a result, you can streamline tax operations and improve accuracy.
❓ Why Do You Need a Tax Filing Dashboard in Power BI?
Tax management involves multiple variables and strict compliance requirements. Therefore, relying on manual processes creates challenges.
Without a Dashboard:
- Errors increase in tax calculations
- Compliance risks become higher
- Data analysis becomes slow
With Power BI Dashboard:
- You gain real-time insights
- You improve accuracy and efficiency
- You ensure better compliance tracking
👉 In short, it helps you manage taxes with confidence and precision.
🧩 Key Features of Automated Tax Filing Dashboard in Power BI
This dashboard includes 5 powerful pages, each designed to provide deep insights into tax operations.
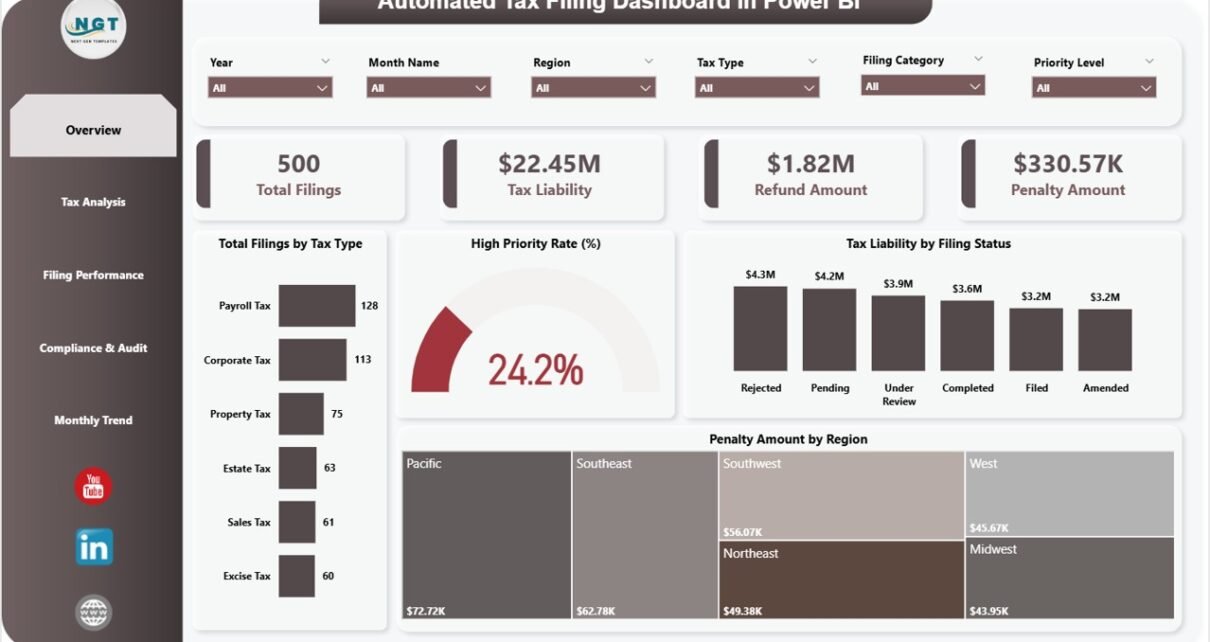
🏠 1. Overview Page – Get a Quick Tax Summary
The Overview Page gives a complete snapshot of tax performance.
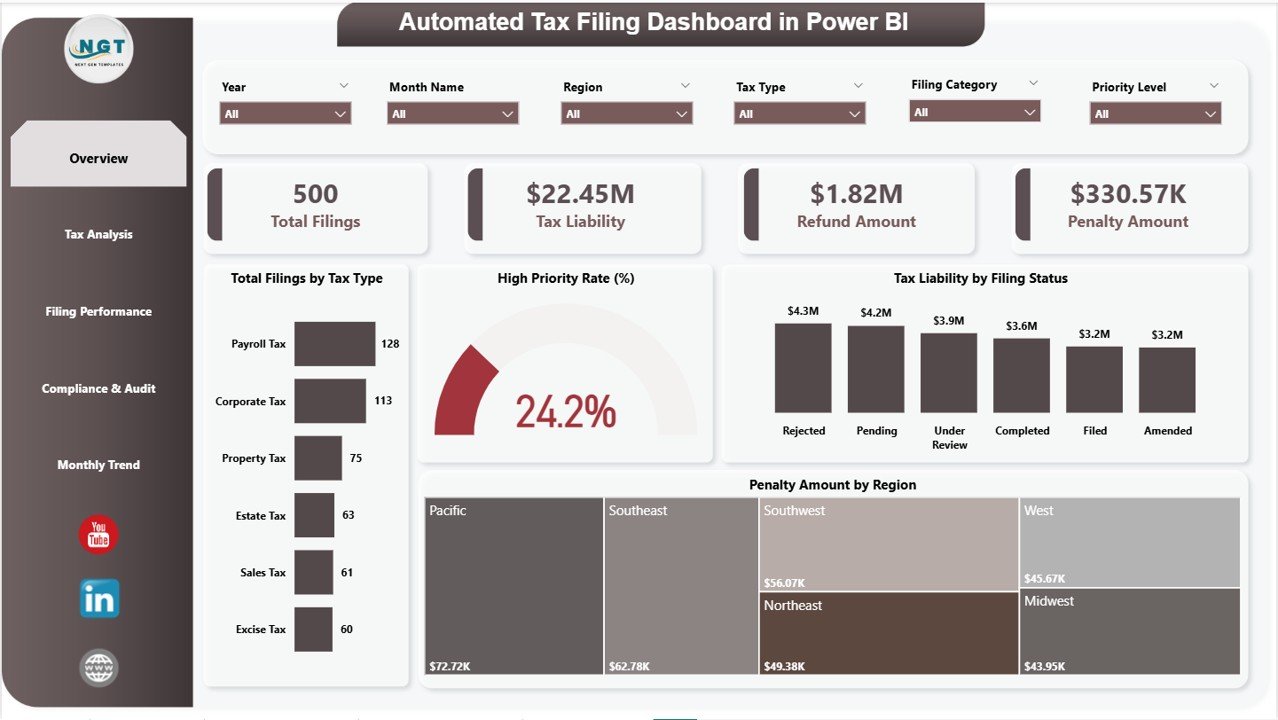
🔑 KPI Cards:
- Total Filings
- Tax Liability
- Refund Amount
- Penalty Amount
📊 Charts Included:
- Total Filings by Tax Type
- High Priority Rate (%)
- Tax Liability by Filing Status
- Penalty Amount by Region
👉 Therefore, you can quickly understand overall tax health.
📊 2. Tax Analysis – Deep Dive into Tax Components
This page helps you analyze tax data in detail.
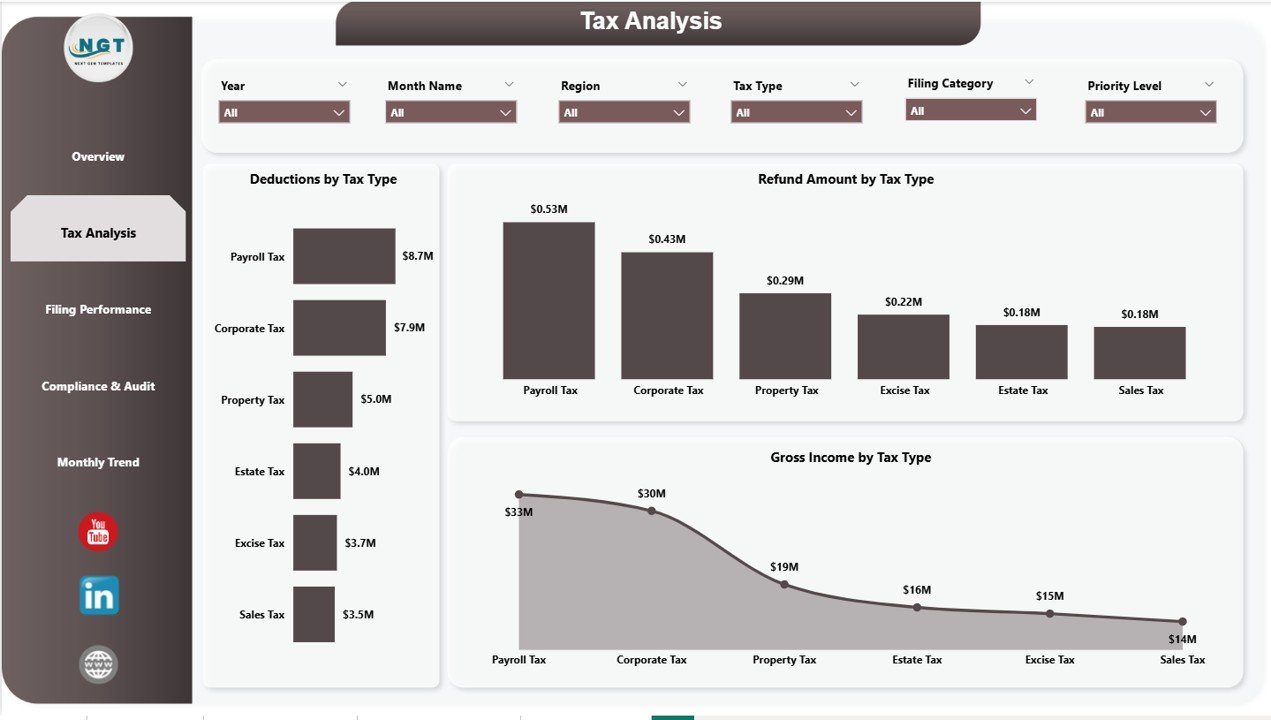
📈 Charts Included:
- Deductions by Tax Type
- Refund Amount by Tax Type
- Gross Income by Tax Type
👉 As a result, you can optimize tax planning and reduce liabilities.
⚙️ 3. Filing Performance – Track Efficiency & Productivity
This page focuses on operational performance.
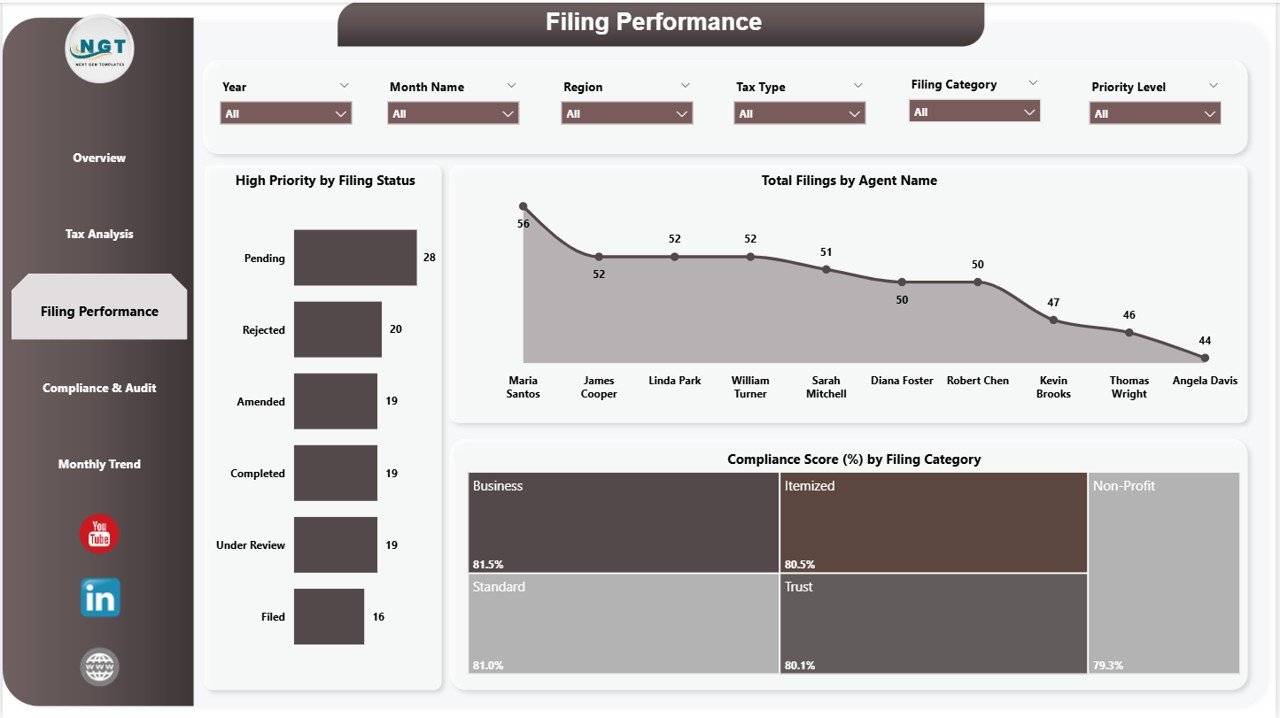
📊 Charts Included:
- High Priority by Filing Status
- Total Filings by Agent Name
- Compliance Score (%) by Filing Category
👉 Therefore, you can improve team productivity and filing efficiency.
🔍 4. Compliance & Audit – Manage Risk Effectively
This page ensures you stay compliant with regulations.
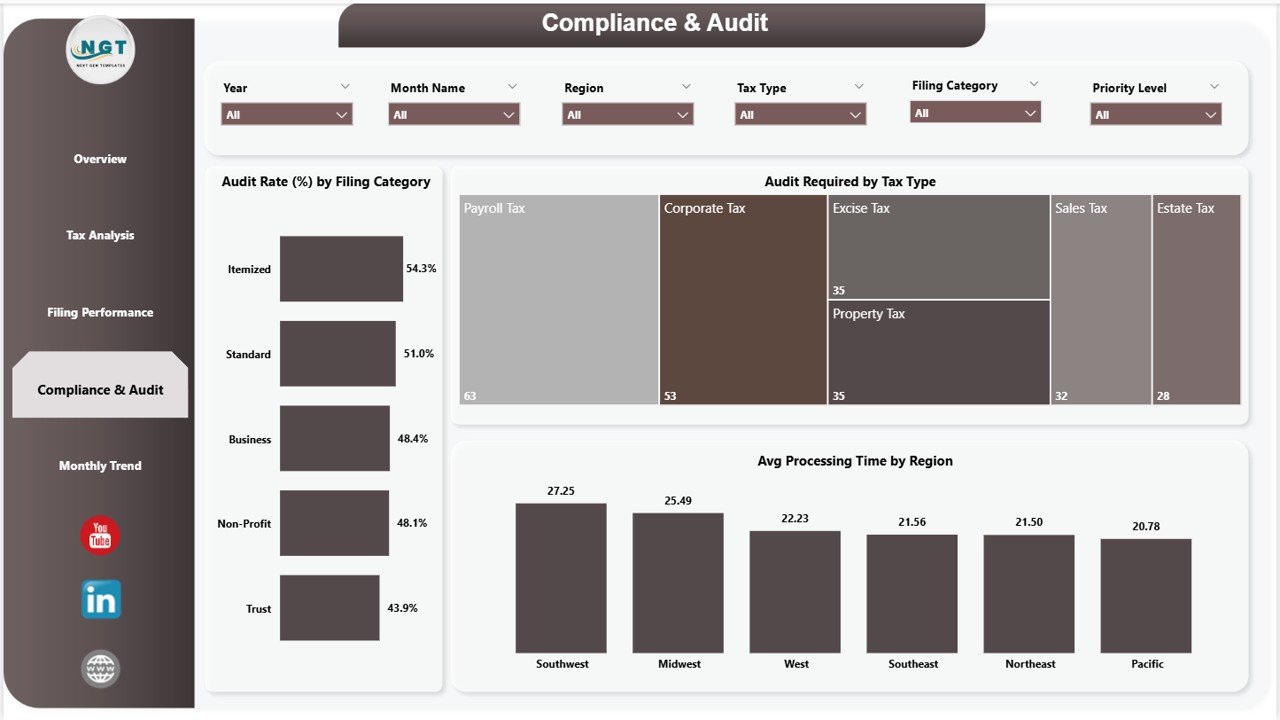
📊 Charts Included:
- Audit Rate (%) by Filing Category
- Audit Required by Tax Type
- Average Processing Time by Region
👉 Consequently, you can reduce audit risks and improve compliance.
📅 5. Monthly Trends – Analyze Time-Based Insights
This page helps you track trends over time.
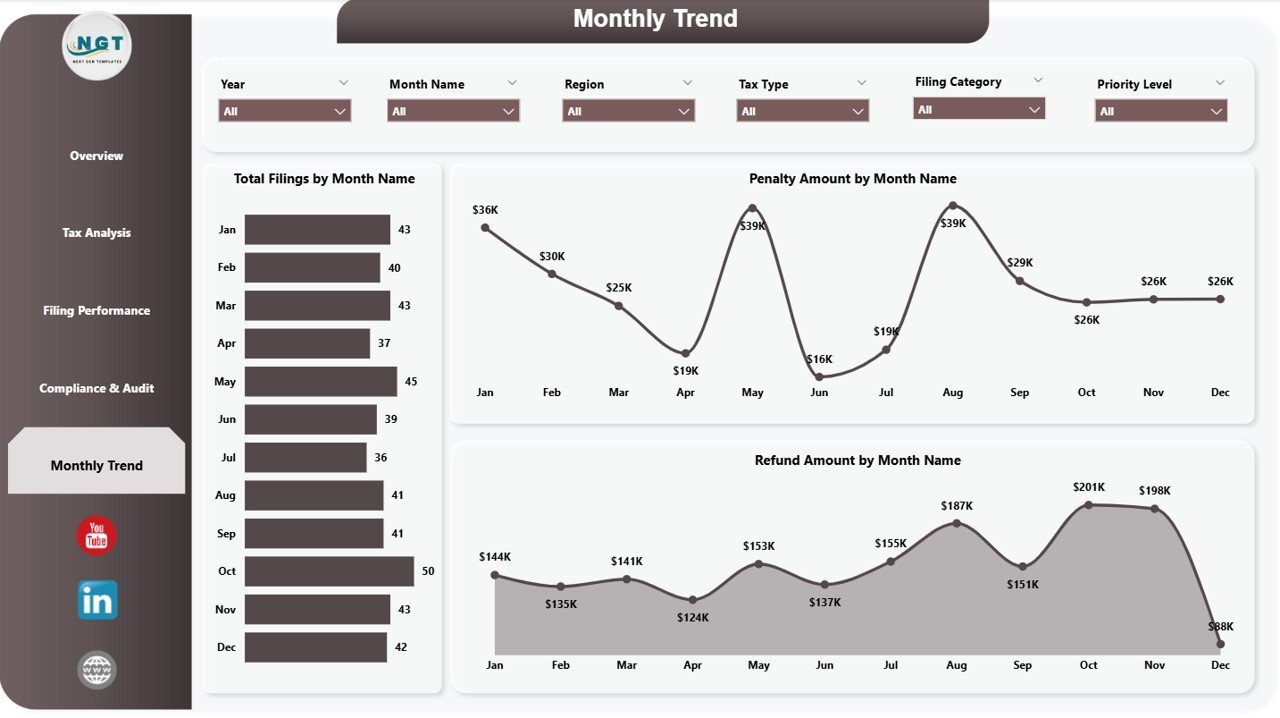
📈 Charts Included:
- Total Filings by Month Name
- Penalty Amount by Month Name
- Refund Amount by Month Name
👉 Therefore, you can identify patterns and improve future planning.
🌟 Advantages of Automated Tax Filing Dashboard in Power BI
✅ 1. Real-Time Data Insights
You can monitor tax data instantly and take quick actions.
✅ 2. Improved Accuracy
Automation reduces manual errors significantly.
✅ 3. Better Compliance Tracking
You can track audits, penalties, and compliance metrics easily.
✅ 4. Enhanced Decision-Making
Visual insights help you make informed financial decisions.
✅ 5. Centralized Data Management
All tax-related data stays organized in one place.
✅ 6. Increased Efficiency
You can reduce processing time and improve productivity.
🚀 How to Use the Automated Tax Filing Dashboard in Power BI
Step 1: Import Data
Upload tax data from Excel, databases, or other sources.
Step 2: Connect Data Sources
Ensure all datasets are linked correctly.
Step 3: Use Filters (Slicers)
Select tax type, region, or filing category.
Step 4: Analyze KPI Cards
Review key metrics like liability and penalties.
Step 5: Explore Dashboard Pages
Dive deeper into tax analysis and compliance.
Step 6: Monitor Trends
Use monthly insights for better planning.
👉 As a result, you can manage tax processes efficiently.
Click to Purchases Automated Tax Filing Dashboard in Power BI
📈 Best Practices for the Automated Tax Filing Dashboard
🔹 Keep Data Updated Regularly
Always refresh data for accurate insights.
🔹 Maintain Clean Data Structure
Structured data improves dashboard performance.
🔹 Focus on Key Metrics
Track essential KPIs like liability, refunds, and audits.
🔹 Use Visual Filters Effectively
Customize analysis based on requirements.
🔹 Monitor Compliance Closely
Regularly review audit-related metrics.
🔹 Train Your Team
Ensure proper understanding of dashboard usage.
⚠️ Common Challenges and Solutions
🚫 Data Errors
👉 Solution: Validate and clean data before importing
🚫 Overloaded Dashboard
👉 Solution: Focus on essential KPIs only
🚫 Slow Performance
👉 Solution: Optimize Power BI data models
🚫 Lack of Insights
👉 Solution: Use meaningful KPIs and visuals
💡 How This Dashboard Improves Tax Efficiency
💰 Reduce Penalties
You can identify issues early and avoid penalties.
📊 Optimize Tax Planning
You can analyze deductions and taxable income.
⏱️ Improve Processing Time
You can monitor efficiency and reduce delays.
🔍 Enhance Audit Readiness
You can track audit flags and compliance metrics.
👉 Therefore, you can improve overall tax performance.
🔮 Future of Tax Analytics with Power BI
Tax management is evolving rapidly with technology.
In the future:
- AI will predict tax risks
- Automation will reduce manual work
- Real-time dashboards will become standard
👉 Therefore, adopting Power BI dashboards today gives you a competitive advantage.
🏁 Conclusion
The Automated Tax Filing Dashboard in Power BI is a powerful solution for managing tax data efficiently. It helps you track filings, monitor compliance, and improve decision-making.
Moreover, it simplifies complex data into clear visuals. Therefore, you can save time, reduce errors, and enhance accuracy.
👉 If you want to streamline tax processes and stay compliant, this dashboard is your ideal solution.
❓ Frequently Asked Questions (FAQs)
1. What is a tax filing dashboard?
It is a tool that helps track and analyze tax data in one place.
2. Can I customize this dashboard?
Yes, you can modify visuals, KPIs, and filters.
3. Is Power BI required to use this dashboard?
Yes, you need Power BI Desktop or Service.
4. How often should I update data?
You should update data regularly for accurate insights.
5. Can this dashboard reduce errors?
Yes, automation significantly reduces manual errors.
6. Who can use this dashboard?
Accountants, businesses, and tax professionals.
7. Does it help with audits?
Yes, it tracks audit metrics and compliance data.
8. Is it beginner-friendly?
Yes, it is easy to use and understand.
Click to Purchases Automated Tax Filing Dashboard in Power BI
Visit our YouTube channel to learn step-by-step video tutorials