In today’s fast-paced automotive industry, efficient data management and real-time performance tracking are essential for success. Managing fleets, monitoring maintenance costs, optimizing fuel consumption, and ensuring smooth departmental operations all depend on timely insights. However, manual tracking often leads to inefficiencies, delays, and poor decision-making.
That’s where the Automotive Dashboard in Power BI becomes a game-changer.
This ready-to-use solution allows organizations to visualize and analyze vehicle data in real time. It combines automation, analytics, and interactive visuals to deliver a comprehensive overview of key performance metrics—helping fleet managers, transportation teams, and executives make faster and smarter decisions.
Click to Purchases Automotive Dashboard in Power BI
What Is an Automotive Dashboard in Power BI?
An Automotive Dashboard in Power BI is an interactive, data-driven tool that provides a 360-degree view of vehicle performance and operations. It centralizes all important information such as active vehicles, mileage, maintenance costs, and fuel efficiency into one dynamic platform.
Instead of working with multiple Excel files or manual reports, this Power BI dashboard enables you to:
-
Monitor vehicle usage and efficiency in real time
-
Track departmental and regional performance
-
Identify trends, bottlenecks, and opportunities for improvement
-
Compare actual vs. expected performance using visual charts and KPIs
This makes it ideal for automotive companies, fleet management firms, logistics departments, and transportation services looking to enhance operational transparency and cost efficiency.
Key Features of the Automotive Dashboard in Power BI
The Automotive Dashboard in Power BI includes five analytical pages, each focusing on a unique aspect of vehicle and operational analysis. Every page integrates cards, slicers, and charts to make navigation and insights effortless.
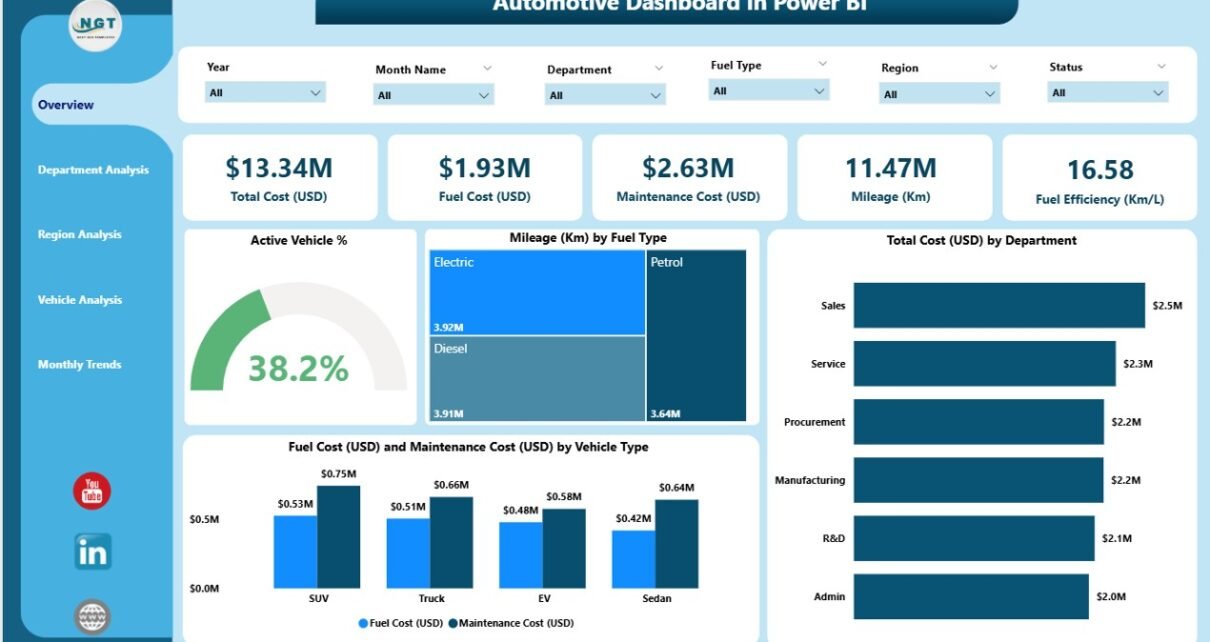
Overview Page
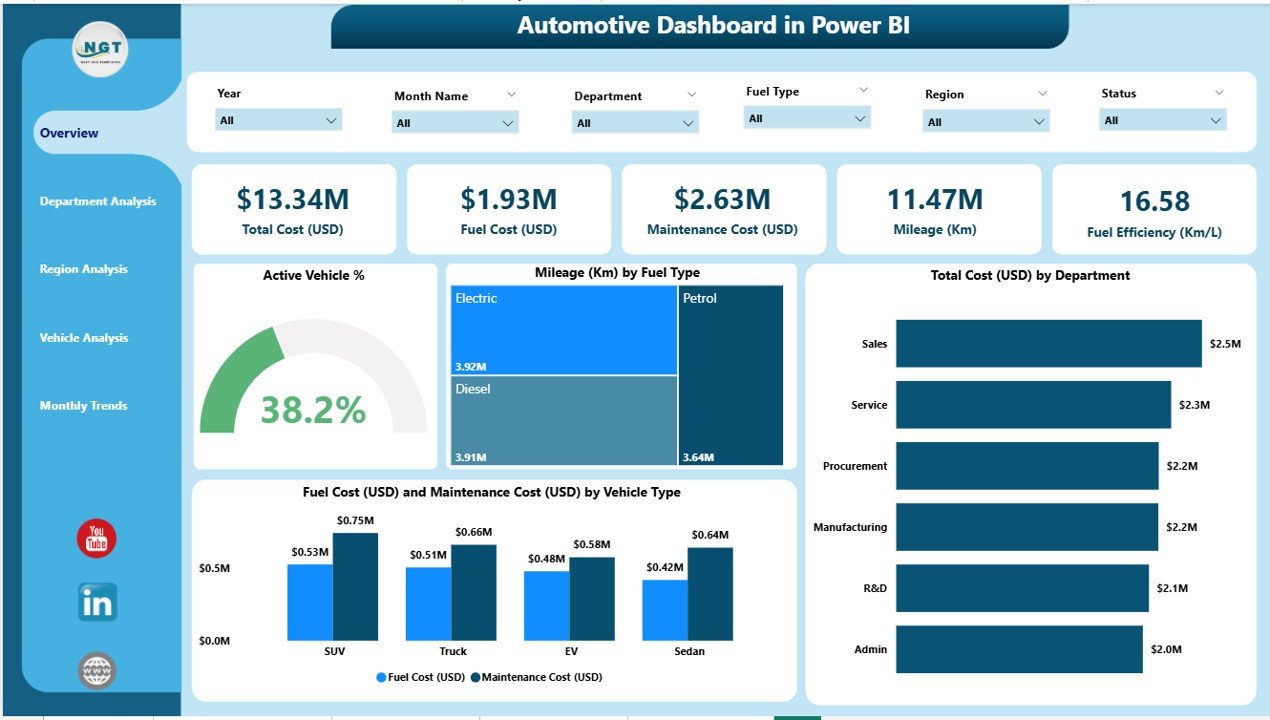
The Overview Page acts as the command center of the dashboard.
It presents summary KPIs and high-level insights that provide a snapshot of performance across the entire automotive operation.
Main components include:
-
5 KPI Cards — displaying metrics such as total active vehicles, total mileage, fuel cost, maintenance cost, and total operational cost.
Charts:
- Active Vehicle %
- Mileage (Km) by Fuel Type
- Total Cost (USD) by Department
- Fuel Cost (USD) and Maintenance Cost (USD) by Vehicle Type
Users can apply interactive slicers to filter data by time period, department, vehicle type, or region—allowing customized analysis at any level.
Department Analysis Page
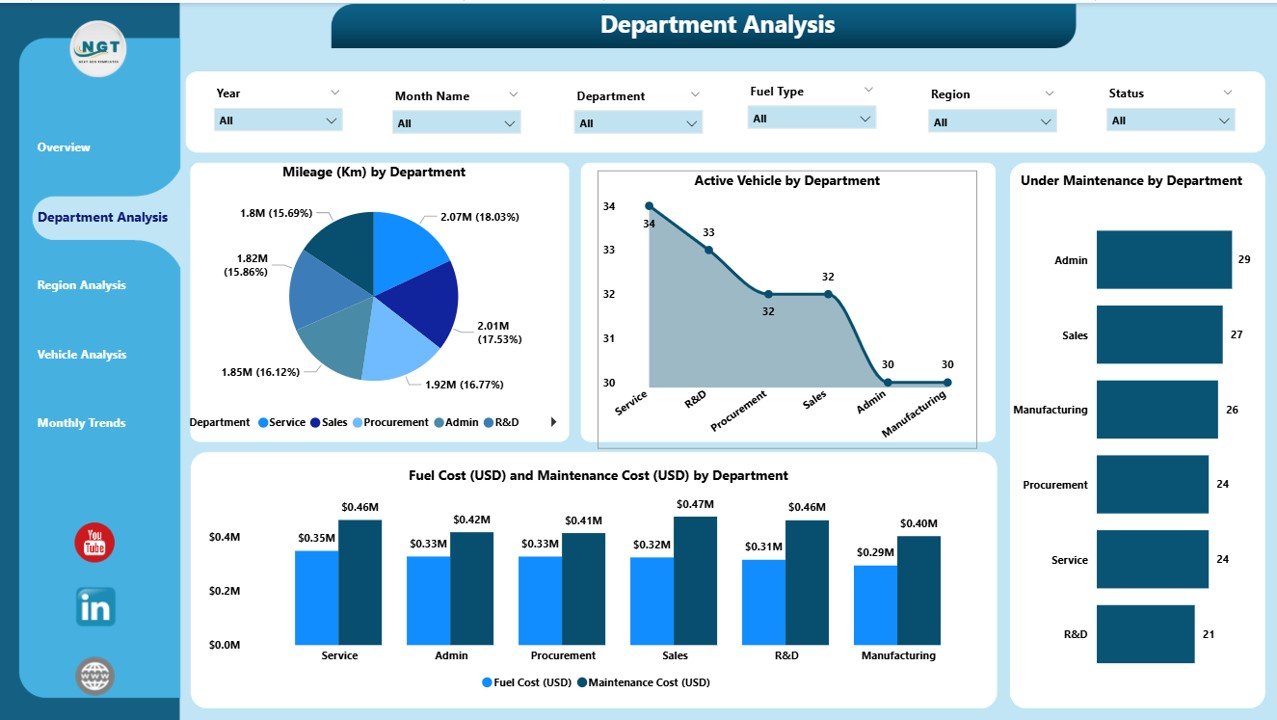
The Department Analysis Page focuses on how different departments contribute to vehicle performance and cost.
Key highlights:
-
Mileage (Km) by Department
-
Active Vehicles by Department
-
Under Maintenance by Department
-
Fuel Cost (USD) and Maintenance Cost (USD) by Department
This page enables fleet managers to pinpoint departments that are underperforming or over-budgeting on fuel and maintenance.
By comparing metrics across teams, decision-makers can easily identify where to reduce costs and improve efficiency.
Region Analysis Page
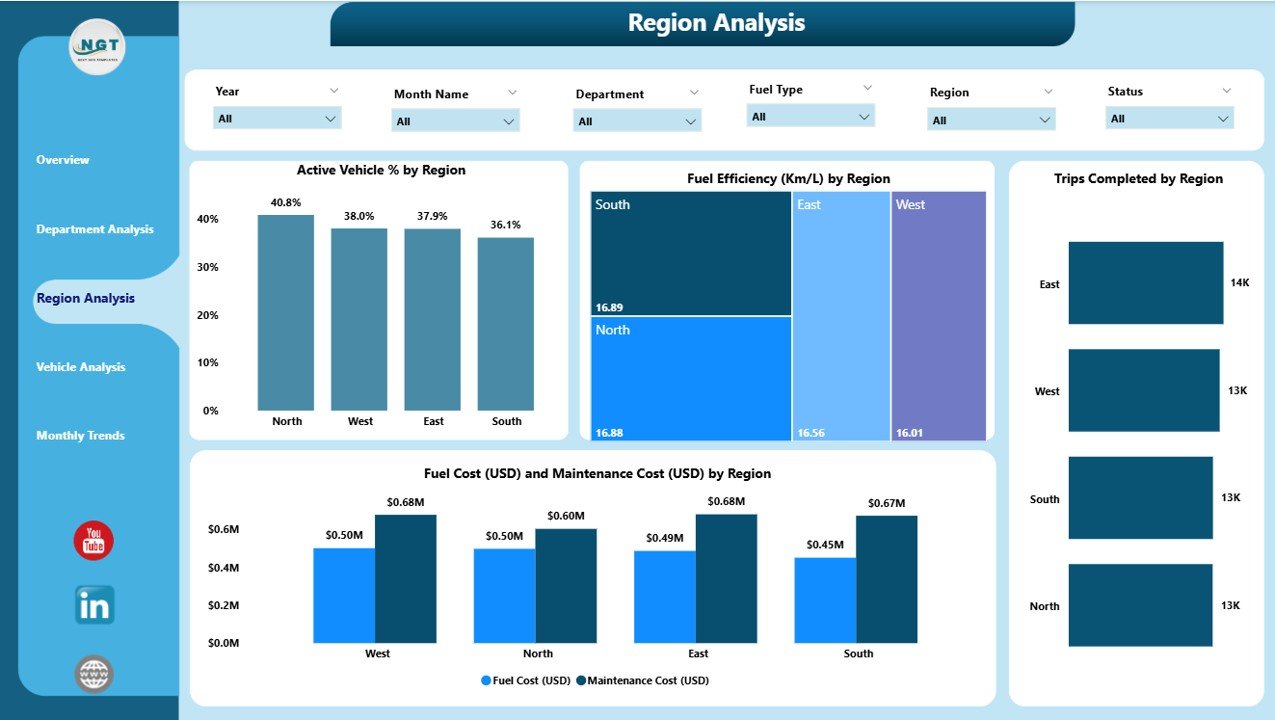
Regional performance can differ significantly due to infrastructure, geography, and operational practices.
The Region Analysis Page provides insights into how various regions are performing in terms of fuel efficiency, vehicle usage, and maintenance costs.
Charts displayed:
-
Active Vehicle % by Region
-
Fuel Efficiency (Km/L) by Region
-
Trips Completed by Region
-
Fuel Cost (USD) and Maintenance Cost (USD) by Region
Click to Purchases Automotive Dashboard in Power BI
This page helps organizations benchmark regional performance, uncover trends, and allocate resources effectively to high-performing areas.
Vehicle Analysis Page
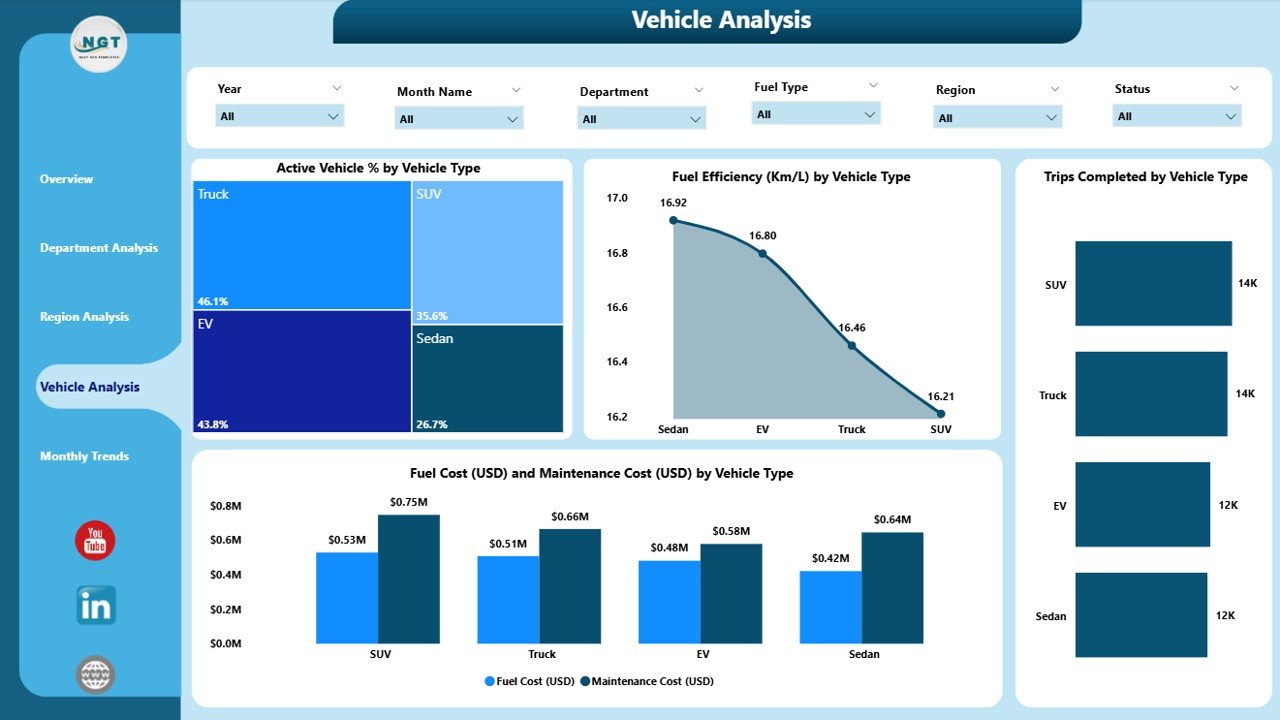
Understanding vehicle-specific performance is crucial for effective asset management.
The Vehicle Analysis Page dives into each vehicle type to help you evaluate utilization and operating costs.
Charts available:
-
Active Vehicle % by Vehicle Type
-
Fuel Efficiency (Km/L) by Vehicle Type
-
Trips Completed by Vehicle Type
-
Fuel Cost (USD) and Maintenance Cost (USD) by Vehicle Type
With this insight, management can identify high-performing vehicle categories, analyze underused assets, and optimize fleet renewal decisions.
Monthly Trends Page
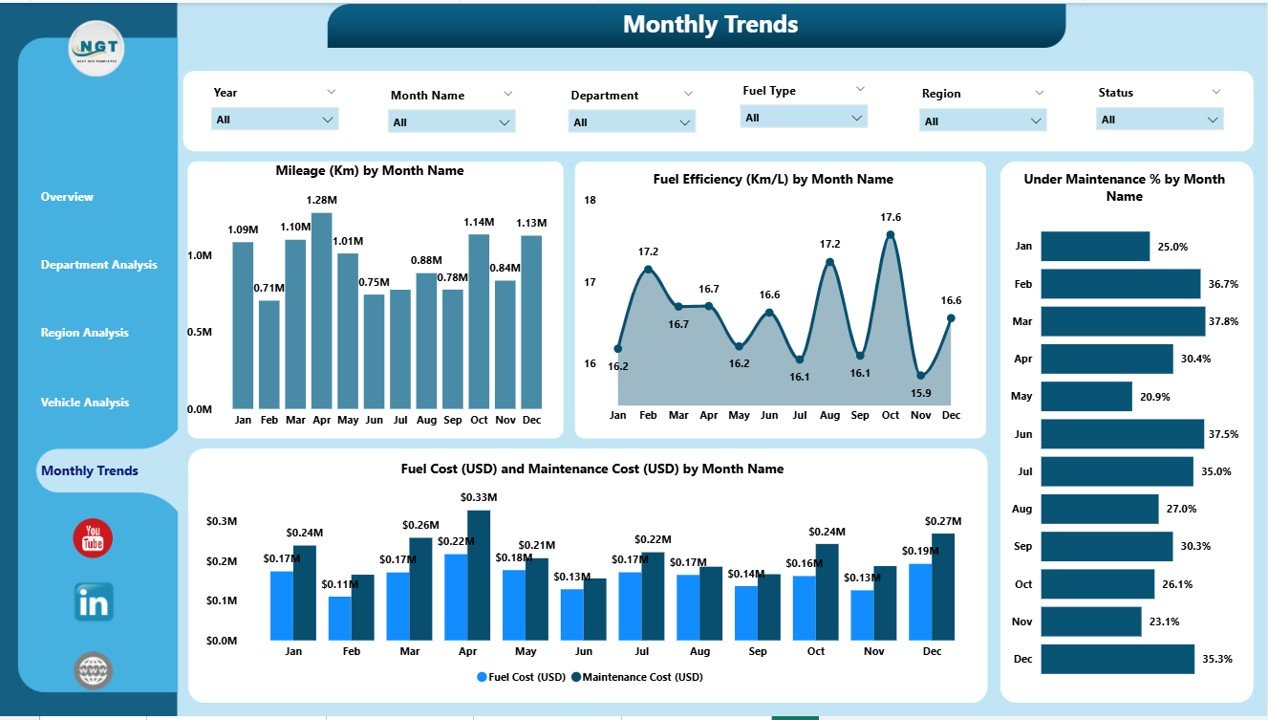
The Monthly Trends Page visualizes how key automotive KPIs evolve over time.
Tracking performance on a month-by-month basis allows early detection of seasonal patterns or anomalies.
Charts displayed:
-
Mileage (Km) by Month
-
Fuel Efficiency (Km/L) by Month
-
Under Maintenance % by Month
-
Fuel Cost (USD) and Maintenance Cost (USD) by Month
This time-based view helps teams forecast expenses, monitor fuel trends, and plan maintenance schedules proactively.
Why Use Power BI for Automotive Data Analytics?
Click to Purchases Automotive Dashboard in Power BI
Microsoft Power BI is one of the most powerful tools for data visualization and business intelligence.
When combined with automotive data, it helps teams transform raw information into actionable insights.
Here’s why Power BI is ideal for automotive analytics:
-
Real-Time Visualization: View up-to-the-minute performance updates.
-
Data Integration: Easily connect Excel, SQL, and other data sources.
-
Interactive Dashboards: Use slicers and filters to explore data dynamically.
-
Advanced Analytics: Utilize DAX formulas, trendlines, and KPIs to gain deep insights.
-
Accessibility: Share dashboards securely via Power BI Service or embed them in websites.
-
Automation: Schedule data refreshes to eliminate manual reporting.
Benefits of the Automotive Dashboard in Power BI
Implementing this dashboard offers tangible operational and financial benefits.
Below are some of the key advantages organizations can achieve:
✅ Centralized Vehicle Data
All vehicle, department, and regional data come together in one interactive dashboard—eliminating the need for multiple reports.
✅ Cost Optimization
By comparing fuel and maintenance expenses across vehicles and regions, companies can identify cost-saving opportunities.
✅ Improved Fleet Efficiency
Monitor vehicle performance metrics such as mileage, active status, and downtime to improve overall efficiency.
✅ Real-Time Decision Making
Instant updates and visuals enable management to make data-driven decisions faster and with higher confidence.
✅ Predictive Maintenance
By analyzing trends in maintenance costs, teams can plan preventive maintenance—reducing unplanned breakdowns and costs.
✅ Enhanced Accountability
Departmental and regional comparisons ensure transparency and accountability among teams.
✅ Scalability
As Power BI supports large datasets, organizations can easily scale their analytics as fleet sizes and operations grow.
How to Use the Automotive Dashboard in Power BI
Using this dashboard is simple and doesn’t require technical expertise.
Here’s a quick step-by-step guide:
-
Connect Data Source: Load your Excel or database files containing vehicle, fuel, and cost data.
-
Open Dashboard File: Launch the
.pbixfile in Power BI Desktop. -
Refresh Data: Click on the “Refresh” button to update metrics.
-
Navigate Pages: Use the sidebar buttons or slicers to explore Overview, Department, Region, Vehicle, or Monthly pages.
-
Analyze and Export: Drill down into insights and export reports for management reviews.
Advantages of Automotive Dashboard in Power BI
Let’s explore the major advantages this dashboard offers to businesses and fleet managers.
🚀 Comprehensive Overview: Gain a full picture of fleet performance and costs.
⚡ Quick Insights: Identify inefficiencies instantly with color-coded visuals.
📉 Reduced Operational Costs: Track and minimize fuel and maintenance expenses.
🕒 Time Efficiency: Save hours spent on manual reporting with automated updates.
📊 Better Planning: Plan maintenance, trips, and vehicle rotation effectively.
🌍 Regional Benchmarking: Evaluate which regions perform better and why.
🧠 Smart Decision Making: Empower leadership with accurate, up-to-date information.
Best Practices for the Automotive Dashboard in Power BI
To maximize the value of your Automotive Dashboard, follow these best practices:
1. Keep Data Clean and Updated
Ensure all vehicle, cost, and mileage data are accurate and regularly updated to maintain dashboard reliability.
2. Define Clear KPIs
Use meaningful KPIs like Fuel Efficiency, Maintenance Cost per Km, and Active Vehicle % to focus on actionable insights.
3. Use Filters and Slicers
Empower users to drill into data by department, vehicle type, or region for specific analysis.
4. Schedule Data Refresh
Automate data updates using Power BI Service to eliminate manual work and errors.
5. Customize Visuals
Modify visuals and themes to align with company branding and reporting preferences.
6. Integrate with Other Tools
Connect Power BI with Excel, ERP systems, or fleet management software for a unified data ecosystem.
7. Review Monthly Trends
Regularly track trends to identify anomalies or potential issues before they escalate.
Who Can Benefit from This Dashboard?
The Automotive Dashboard in Power BI is ideal for multiple professionals and industries, including:
-
Fleet Managers: To track utilization and efficiency.
-
Transportation Companies: For operational visibility.
-
Logistics Firms: To monitor vehicle performance and costs.
-
Corporate Travel Departments: To manage internal fleets efficiently.
-
Automotive Manufacturers: For analyzing regional and model-level performance.
-
Government Transport Departments: To ensure accountability and budget control.
Real-World Applications
Here are some real-world use cases for the Automotive Dashboard in Power BI:
-
Fleet Optimization: Identify low-efficiency vehicles and plan replacements.
-
Fuel Management: Track consumption and detect unusual spikes in cost.
-
Maintenance Planning: Use data to predict and prevent breakdowns.
-
Budget Forecasting: Compare actual vs. planned costs to refine forecasts.
-
Performance Reporting: Generate department-wise reports for management.
-
Compliance Monitoring: Ensure operational standards are consistently met.
Why Choose the Automotive Dashboard from NextGenTemplates?
The Automotive Dashboard in Power BI is designed with practicality and performance in mind.
It is ready-to-use, fully customizable, and visually engaging, allowing you to start analyzing data instantly.
Key Highlights:
-
Built with clean data models and optimized DAX formulas.
-
Professionally designed pages for seamless navigation.
-
Compatible with Excel, SQL, and other data sources.
-
Editable visuals and color schemes for customization.
-
Includes slicers, cards, and trend charts for in-depth insights.
With this dashboard, you can turn raw automotive data into actionable intelligence—driving smarter decisions and improved performance.
Conclusion
The Automotive Dashboard in Power BI revolutionizes the way organizations monitor vehicle performance and operational costs.
By integrating all data into a single, interactive platform, it enables stakeholders to analyze, compare, and improve efficiency with precision.
From tracking maintenance costs to optimizing fuel usage, this dashboard empowers you to make data-driven decisions with confidence.
It’s not just a dashboard—it’s a complete automotive performance management system designed for modern businesses.
❓ Frequently Asked Questions (FAQ)
1. What is an Automotive Dashboard in Power BI?
It’s a Power BI-based dashboard designed to monitor fleet performance, fuel efficiency, maintenance cost, and other KPIs across departments and regions.
2. How is the data connected in this dashboard?
The dashboard connects to an Excel file (or any data source) containing operational data such as mileage, vehicle type, cost, and efficiency metrics.
3. Can I customize the visuals?
Yes. You can edit chart types, KPIs, and themes directly in Power BI Desktop to match your organization’s needs.
4. Is it suitable for small companies?
Absolutely! The dashboard is scalable and works well for small to large organizations managing a few to hundreds of vehicles.
5. Can I share this dashboard online?
Yes. You can publish it to Power BI Service and securely share it with stakeholders or embed it into reports and portals.
6. Does it support real-time updates?
Yes, if connected to a live database or API feed, the dashboard can refresh data automatically.
7. What KPIs are included in this dashboard?
It includes Active Vehicle %, Mileage, Fuel Efficiency, Fuel Cost, Maintenance Cost, Trips Completed, and more.
8. How can this dashboard improve cost efficiency?
By identifying high-maintenance vehicles, inefficient routes, and departments with high costs, it enables proactive cost control.
Visit our YouTube channel to learn step-by-step video tutorials
Click to Purchases Automotive D
Watch the step-by-step video tutorial:
ashboard in Power BI