The automotive parts manufacturing industry depends heavily on efficiency, precision, and continuous improvement. Every production unit must monitor machine performance, quality standards, production output, operational costs, and delivery timelines. Therefore, manufacturers need accurate and real-time performance insights to remain competitive.
However, many organizations still rely on static reports and disconnected spreadsheets. As a result, managers struggle to analyze performance quickly and respond to operational challenges on time.
So, how can automotive parts manufacturers monitor KPIs dynamically and make smarter decisions using modern analytics?
The answer is simple — Automotive Parts Manufacturing KPI Dashboard in Power BI.
This ready-to-use Power BI dashboard transforms manufacturing data stored in Excel into interactive visuals, enabling managers to track KPIs, analyze trends, and evaluate performance instantly.
In this detailed guide, you will learn everything about the Automotive Parts Manufacturing KPI Dashboard in Power BI, including features, dashboard pages, implementation steps, advantages, best practices, and frequently asked questions.
Click to Purchases Automotive Parts Manufacturing KPI Dashboard in Power BI
What Is an Automotive Parts Manufacturing KPI Dashboard in Power BI?
An Automotive Parts Manufacturing KPI Dashboard in Power BI is an interactive business intelligence solution designed to monitor manufacturing performance using visual analytics and key performance indicators.
Instead of analyzing multiple Excel reports manually, users can view operational performance from a centralized Power BI dashboard.
Because Power BI connects directly with Excel data sources, organizations can refresh reports automatically and analyze updated results instantly.
The dashboard helps manufacturers:
-
Monitor production KPIs in real time
-
Compare targets with actual performance
-
Analyze MTD and YTD performance
-
Track historical trends
-
Identify performance gaps quickly
-
Improve operational decision-making
Consequently, leadership teams gain complete visibility into manufacturing operations.
Click to Purchases Automotive Parts Manufacturing KPI Dashboard in Power BI
Why Do Automotive Manufacturers Need Power BI KPI Dashboards?
Manufacturing environments generate massive operational data daily. However, without visualization tools, data becomes difficult to interpret.
Common reporting challenges include:
-
Manual reporting delays
-
Lack of centralized analytics
-
Limited data visualization
-
Difficulty comparing historical performance
-
Slow decision-making processes
Therefore, organizations require an intelligent dashboard that converts raw data into meaningful insights.
Power BI solves these challenges by providing interactive analytics, automated calculations, and dynamic filtering capabilities.
How Does Power BI Improve Manufacturing Performance Monitoring?
Power BI allows managers to analyze data visually rather than through complex tables.
As soon as users open the dashboard, they understand performance status immediately.
Operational improvements include:
-
Real-time performance visibility
-
Faster decision-making
-
Reduced reporting effort
-
Improved KPI accountability
-
Better forecasting accuracy
-
Enhanced production planning
As a result, organizations operate more efficiently and proactively.
Click to Purchases Automotive Parts Manufacturing KPI Dashboard in Power BI
Key Features of Automotive Parts Manufacturing KPI Dashboard in Power BI
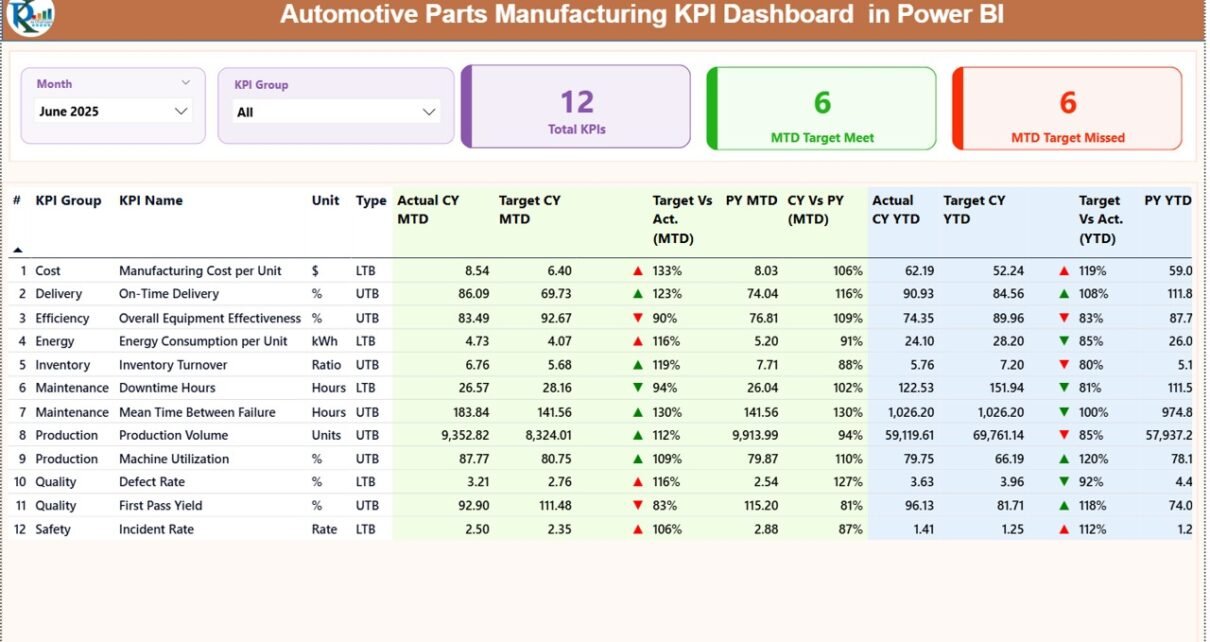
This ready-to-use dashboard contains three structured pages, each designed to deliver specific analytical insights.
1️⃣ Summary Page — Central Performance Overview
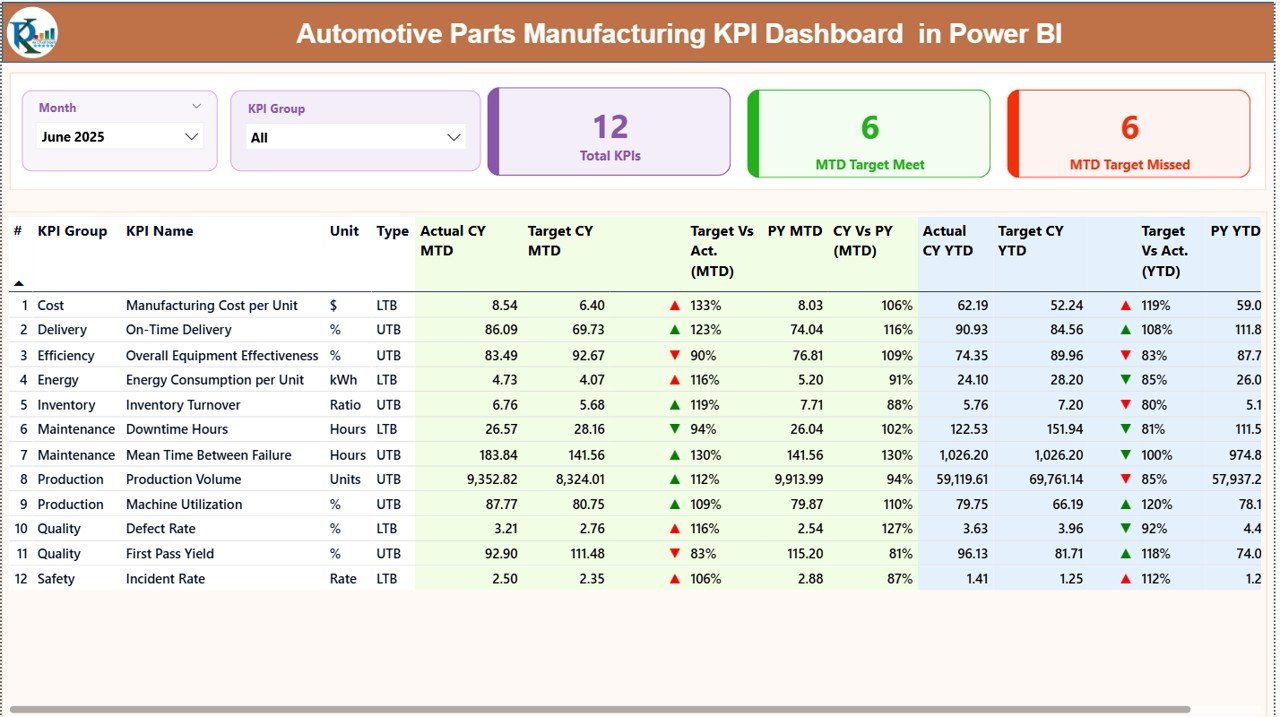
The Summary Page acts as the main dashboard interface.
At the top, users find interactive slicers that allow filtering by:
-
Month
-
KPI Group
These slicers instantly update all visuals across the page.
KPI Cards Display
Three performance cards provide quick insights:
-
Total KPI Count
-
MTD Target Meet Count
-
MTD Target Missed Count
Therefore, managers can evaluate overall performance at a glance.
Detailed KPI Performance Table
Below the cards, a comprehensive KPI table displays detailed performance metrics.
Columns Included:
-
KPI Number – Sequence identifier
-
KPI Group – KPI category
-
KPI Name – Performance metric name
-
Unit – Measurement unit
-
Type – LTB (Lower the Better) or UTB (Upper the Better)
MTD Performance Metrics
-
Actual CY MTD (Current Year Actual)
-
Target CY MTD
-
MTD Status Icon (▲ Green / ▼ Red)
-
Target vs Actual % (Actual ÷ Target)
-
PY MTD (Previous Year Value)
-
CY vs PY % Comparison
These indicators help managers evaluate short-term performance quickly.
YTD Performance Metrics
-
Actual CY YTD
-
Target CY YTD
-
YTD Status Icon
-
Target vs Actual YTD %
-
PY YTD
-
CY vs PY YTD %
Because both MTD and YTD metrics appear together, users gain balanced performance insights.
Click to Purchases Automotive Parts Manufacturing KPI Dashboard in Power BI
2️⃣ KPI Trend Page — Performance Trend Analysis
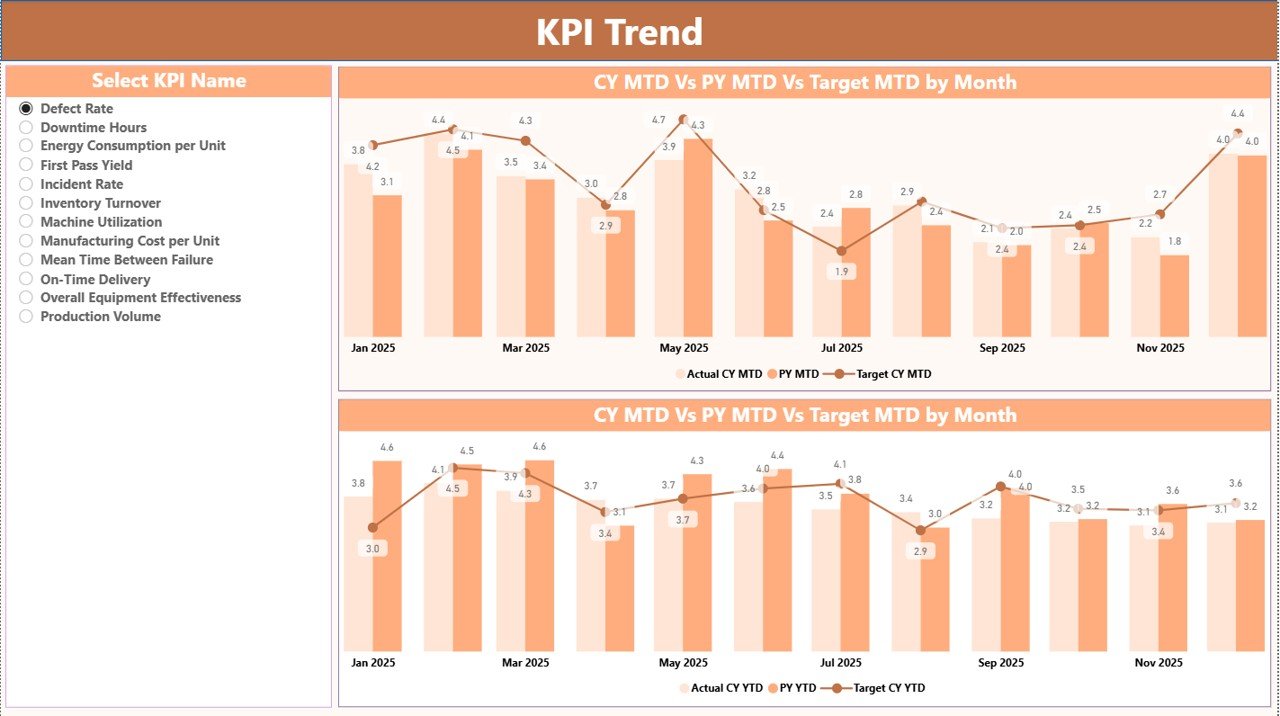
The KPI Trend Page provides visual trend analysis.
A KPI slicer on the left allows users to select any KPI dynamically.
Visualizations Included:
-
MTD Combo Chart
-
YTD Combo Chart
Each chart compares:
-
Current Year Actual
-
Previous Year Actual
-
Target Values
Therefore, managers can analyze performance patterns over time and detect improvement opportunities.
3️⃣ KPI Definition Page — Drill-Through Analysis
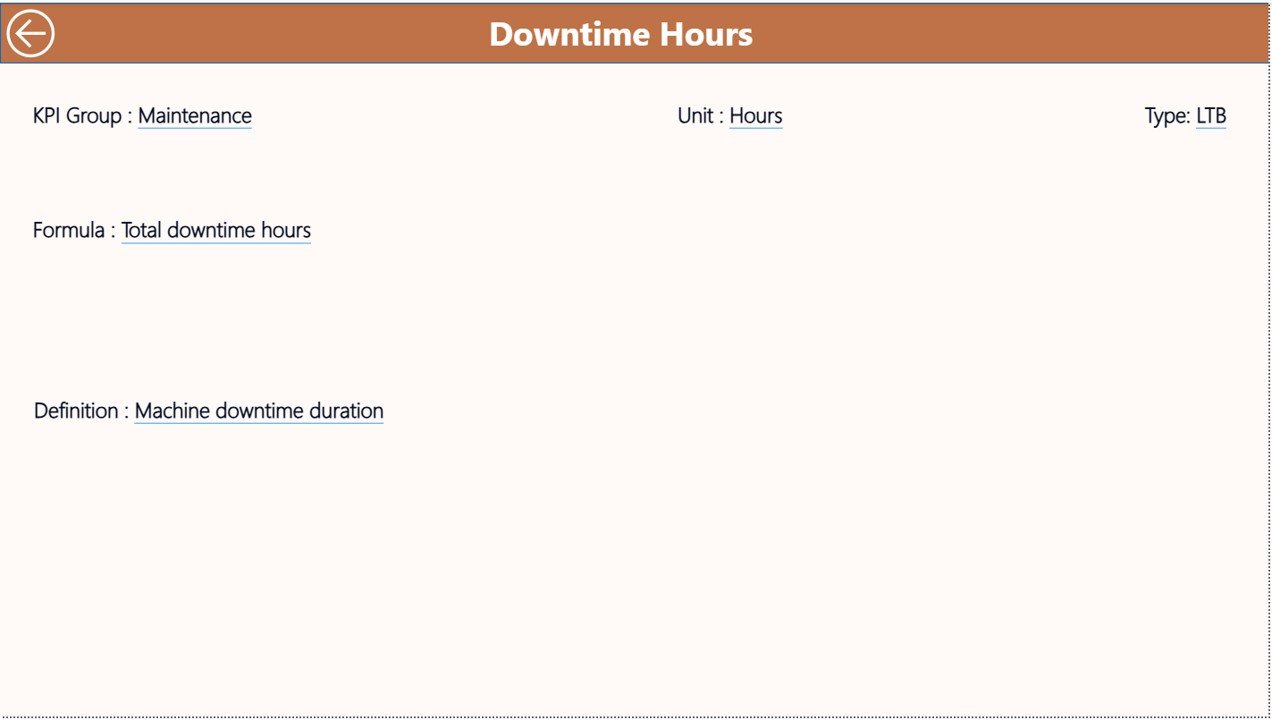
The KPI Definition Page works as a drill-through page and remains hidden during normal navigation.
Users can access it directly from the Summary Page.
Information Displayed:
-
KPI Formula
-
KPI Definition
-
KPI Details
-
KPI Classification
A back button located in the top-left corner allows users to return instantly to the main dashboard.
This feature ensures users understand KPI calculations clearly.
Excel Data Source Structure
The dashboard uses an Excel file as its data source, making implementation simple and flexible.
Users only need to maintain three worksheets.
1️⃣ Input_Actual Sheet
Enter actual performance data:
-
KPI Name
-
Month (first date of month)
-
MTD Values
-
YTD Values
Once updated, Power BI refreshes the dashboard automatically.
2️⃣ Input_Target Sheet
Enter target values for each KPI:
-
KPI Name
-
Month
-
MTD Target
-
YTD Target
Targets allow performance comparison.
3️⃣ KPI Definition Sheet
Enter KPI master information:
-
KPI Number
-
KPI Group
-
KPI Name
-
Unit
-
Formula
-
Definition
-
Type (LTB or UTB)
This structure ensures standardized KPI management.
Click to Purchases Automotive Parts Manufacturing KPI Dashboard in Power BI
What KPIs Should Automotive Parts Manufacturers Monitor?
Production KPIs
-
Production Volume
-
Machine Utilization
-
Downtime Rate
-
Overall Equipment Effectiveness (OEE)
Quality KPIs
-
Defect Rate
-
Scrap Percentage
-
Rework Rate
-
Customer Complaints
Delivery KPIs
-
On-Time Delivery
-
Lead Time
Cost KPIs
-
Cost per Unit
-
Labor Productivity
-
Manufacturing Cost Variance
Inventory KPIs
-
Inventory Turnover
-
Raw Material Availability
-
Stock Accuracy
Tracking these KPIs ensures operational balance.
Click to Purchases Automotive Parts Manufacturing KPI Dashboard in Power BI
Advantages of Automotive Parts Manufacturing KPI Dashboard in Power BI
✅ Real-Time Interactive Analytics
Users analyze performance instantly using filters and slicers.
✅ Centralized KPI Monitoring
All manufacturing KPIs appear in one dashboard.
✅ Dynamic Visualizations
Charts update automatically based on selections.
✅ Faster Decision Making
Managers identify issues quickly.
✅ Easy Excel Integration
Data maintenance remains simple.
✅ Scalable Reporting
Organizations can expand dashboards easily.
✅ Improved Performance Transparency
Teams clearly understand performance expectations.
How to Implement the Dashboard Successfully?
Follow these steps:
-
Prepare KPI definitions.
-
Populate Excel input sheets.
-
Connect Excel to Power BI.
-
Refresh data regularly.
-
Review dashboard insights monthly.
-
Share reports with stakeholders.
Additionally, assign KPI ownership to improve accountability.
Click to Purchases Automotive Parts Manufacturing KPI Dashboard in Power BI
Best Practices for the Automotive Parts Manufacturing KPI Dashboard in Power BI
✔ Maintain Clean Data Structure
Ensure Excel data remains consistent.
✔ Refresh Data Regularly
Schedule refresh cycles for updated insights.
✔ Focus on Actionable KPIs
Track metrics that influence decisions.
✔ Use Standard KPI Definitions
Avoid confusion across teams.
✔ Analyze Trends Frequently
Trend analysis drives improvement.
✔ Train Users on Dashboard Navigation
Better adoption improves results.
✔ Align KPIs with Strategic Goals
Every KPI should support business objectives.
How Does Power BI Support Data-Driven Manufacturing Decisions?
Power BI enables manufacturers to:
-
Detect performance deviations early
-
Compare historical performance
-
Evaluate operational efficiency
-
Improve production planning
-
Forecast performance trends
Therefore, organizations shift toward predictive and proactive management.
Click to Purchases Automotive Parts Manufacturing KPI Dashboard in Power BI
Who Should Use This Dashboard?
-
Production Managers
-
Plant Heads
-
Quality Managers
-
Operations Analysts
-
Supply Chain Managers
-
Senior Executives
Each role benefits from visual performance insights.
Why Choose Power BI for Manufacturing Analytics?
Power BI offers powerful advantages:
-
Interactive dashboards
-
Automated calculations
-
Real-time filtering
-
Easy sharing across teams
-
Strong visualization capabilities
-
Integration with Excel
Therefore, Power BI becomes an ideal analytics platform for modern manufacturing organizations.
Click to Purchases Automotive Parts Manufacturing KPI Dashboard in Power BI
Conclusion
The Automotive Parts Manufacturing KPI Dashboard in Power BI provides a modern and efficient approach to manufacturing performance management. Instead of relying on static reports, organizations gain interactive analytics that reveal performance insights instantly.
Moreover, the dashboard combines Excel data flexibility with Power BI visualization power, creating a scalable and intelligent reporting solution.
Ultimately, manufacturers that adopt KPI-driven analytics achieve higher efficiency, improved quality control, and stronger operational performance.
Click to Purchases Automotive Parts Manufacturing KPI Dashboard in Power BI
Frequently Asked Questions (FAQs)
What is the purpose of this Power BI dashboard?
It helps manufacturers monitor KPIs using interactive visual analytics.
Is Excel required for this dashboard?
Yes. Excel acts as the data source for KPI inputs.
Can I customize KPIs?
Yes, users can modify KPI definitions and metrics easily.
How often should data be refreshed?
Monthly refresh works well, although weekly updates provide deeper insights.
Does the dashboard compare historical performance?
Yes. It compares current year results with previous year data.
Is Power BI suitable for manufacturing analytics?
Yes. Power BI provides strong visualization and real-time analytics capabilities.
Can multiple departments use this dashboard?
Yes. Different teams can analyze KPIs using filters and slicers.
Do I need advanced Power BI knowledge?
No. The dashboard is ready-to-use and easy to operate.
Click to Purchases Automotive Parts Manufacturing KPI Dashboard in Power BI
Visit our YouTube channel to learn step-by-step video tutorials