Managing a backpacker hostel can be exciting, but at the same time, it requires constant tracking of bookings, revenue, guest satisfaction, and occupancy. However, if you rely on scattered data or manual reports, you may miss important insights.
So, how can you manage everything in one place efficiently?
The answer is simple — Backpacker Hostels Dashboard in Excel.
In this detailed guide, you will learn how this powerful Excel dashboard helps you monitor performance, analyze trends, and make better decisions with ease.
Click to Purchases Backpacker Hostels Dashboard in Excel
What is a Backpacker Hostels Dashboard in Excel?
A Backpacker Hostels Dashboard in Excel is a dynamic and interactive reporting tool designed to track hostel operations in real time. It combines multiple datasets into visual charts, KPIs, and slicers so that you can quickly understand your business performance.
Moreover, it allows you to:
- Track revenue and bookings
- Monitor occupancy and satisfaction
- Analyze guest behavior
- Compare performance across regions and hostels
As a result, you can make faster and smarter decisions.
Why Do You Need a Hostel Dashboard?
Running a hostel involves handling multiple variables like bookings, pricing, and guest preferences. Without a dashboard, it becomes difficult to track everything efficiently.
Therefore, this dashboard helps you:
- Save time on manual reporting
- Identify trends instantly
- Improve guest experience
- Optimize pricing and occupancy
In addition, it ensures that all your data stays organized and accessible.
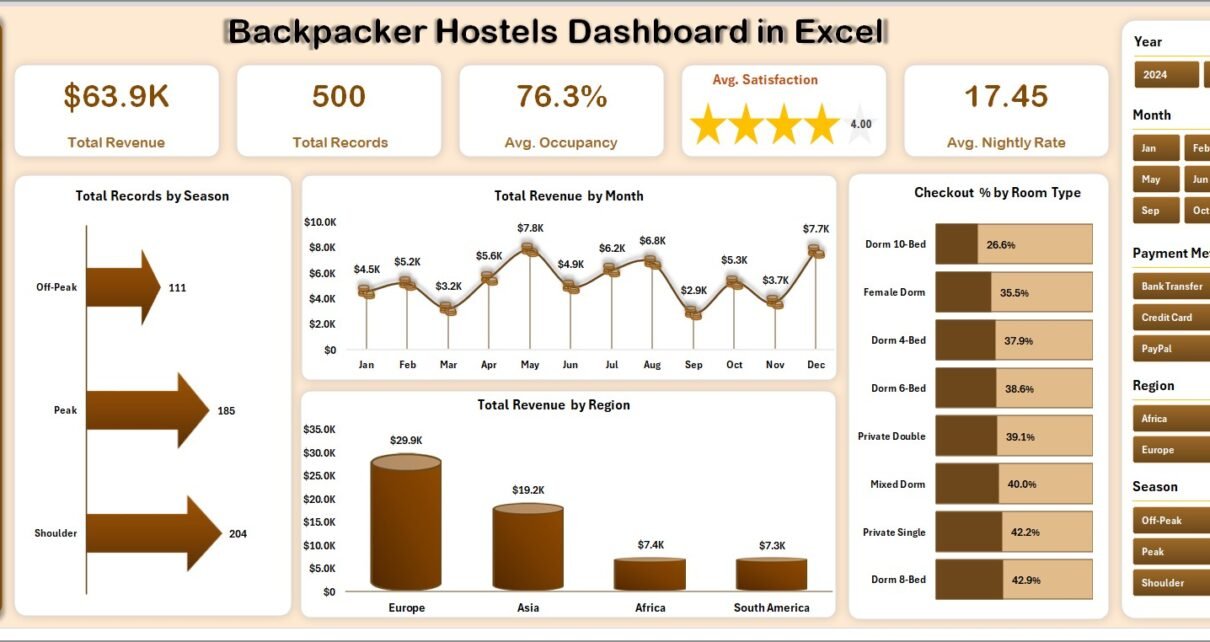
📊 Overview Page – What Does It Show?
The Overview Page provides a complete snapshot of your hostel business. At the top, you will find key performance indicators (KPIs) that highlight your performance instantly.
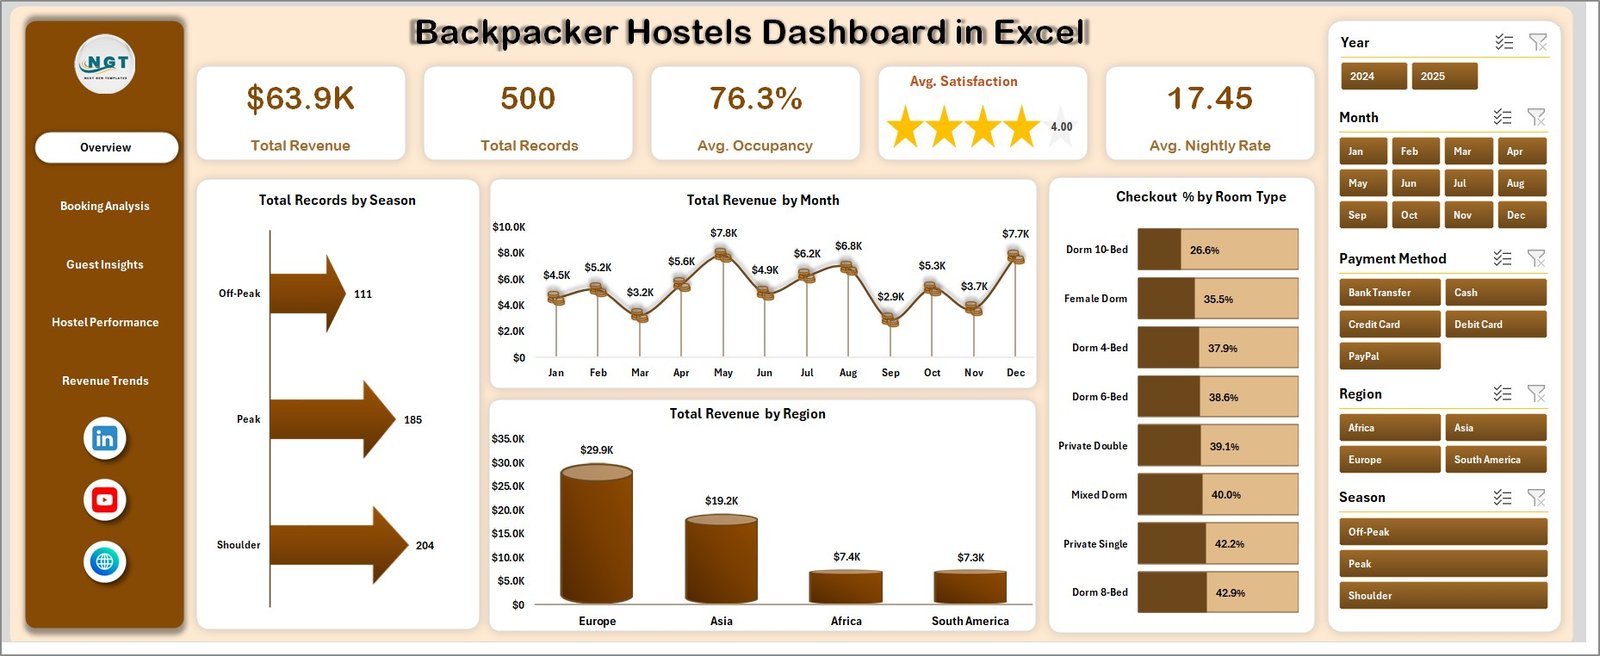
🔹 Key KPI Cards Explained
- Total Revenue
Shows the overall income generated from bookings. It helps you understand your financial performance quickly. - Total Records
Displays the total number of bookings or transactions. This helps you track business volume. - Avg. Occupancy
Represents the average percentage of occupied rooms. It indicates how efficiently your rooms are utilized. - Avg. Satisfaction
Shows guest ratings based on feedback. This helps you measure customer experience. - Avg. Nightly Rate
Displays the average price per night. It helps in pricing strategy decisions.
📈 Charts on Overview Page (Explained)
- Total Records by Season
This chart shows how bookings vary across different seasons. It helps identify peak and off-season trends. - Total Revenue by Month
Displays monthly revenue trends throughout the year. It helps in tracking seasonal revenue patterns. - Total Revenue by Region
Shows which regions generate the most revenue. This helps you focus on high-performing markets. - Checkout % by Room Type
Represents checkout rates across different room types. It helps understand guest preferences.
📊 Booking Analysis – How Are Your Bookings Performing?
The Booking Analysis Page focuses on booking sources and payment behaviors. This helps you understand where your bookings come from and how they perform.
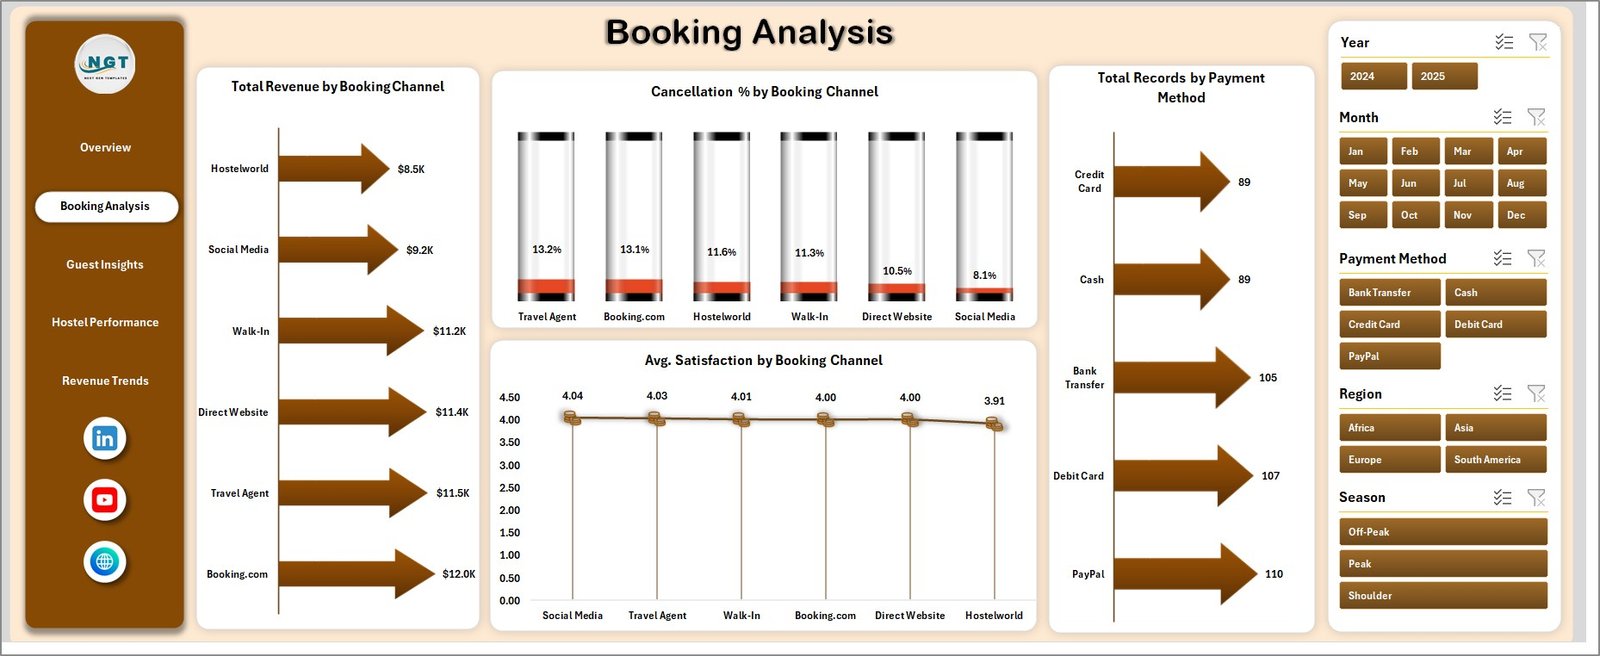
📈 Charts Explained
- Total Revenue by Booking Channel
Shows revenue contribution from different booking platforms. It helps identify the most profitable channels. - Cancellation % by Booking Channel
Displays cancellation rates across channels. This helps in managing booking reliability. - Total Records by Payment Method
Shows how customers prefer to pay. It helps optimize payment options. - Avg. Satisfaction by Booking Channel
Highlights satisfaction levels per channel. This helps you evaluate booking platforms.
🌍 Guest Insights – What Do Your Guests Tell You?
The Guest Insights Page helps you understand your guests better. This allows you to improve services and target the right audience.
📈 Charts Explained
- Total Revenue by Guest Nationality
Shows revenue generated by different nationalities. It helps in identifying key customer segments. - Avg. Satisfaction by Room
Displays satisfaction levels for different room types. This helps improve room quality. - Avg. Occupancy by Booking Channel
Shows occupancy performance by channel. It helps optimize booking strategies. - Avg. Occupancy by Region
Displays occupancy trends across regions. It helps in location-based planning.
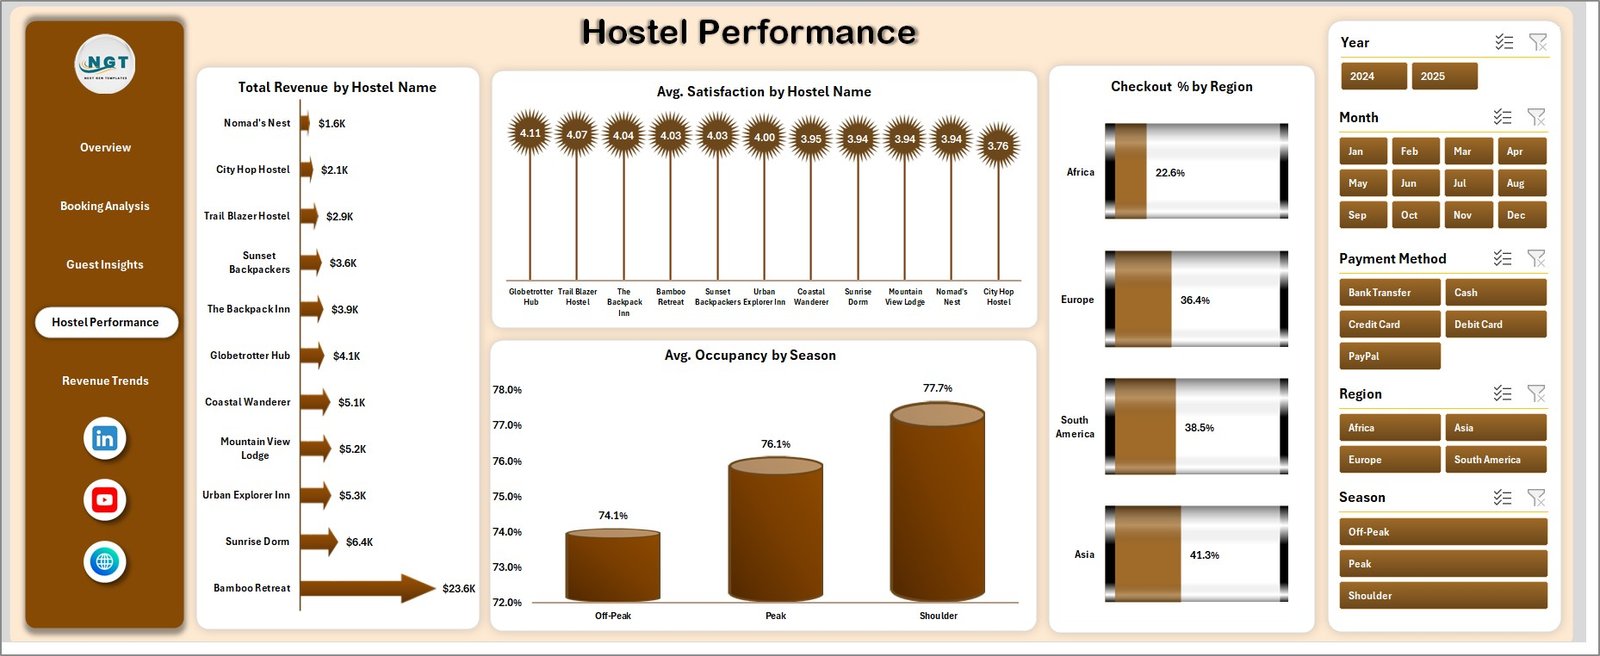
🏨 Hostel Performance – Which Hostel Performs Best?
The Hostel Performance Page focuses on comparing different hostels. This helps you identify top-performing and underperforming properties.
📈 Charts Explained
- Total Revenue by Hostel
Shows revenue generated by each hostel. It helps identify high-performing locations. - Avg. Satisfaction by Hostel Name
Displays guest satisfaction per hostel. This helps improve service quality. - Checkout % by Region
Shows checkout behavior by region. It helps understand regional trends. - Avg. Occupancy by Season
Displays seasonal occupancy trends. It helps in planning capacity.
📉 Revenue Trends – How Does Revenue Change Over Time?
The Revenue Trends Page helps you track financial performance over time.
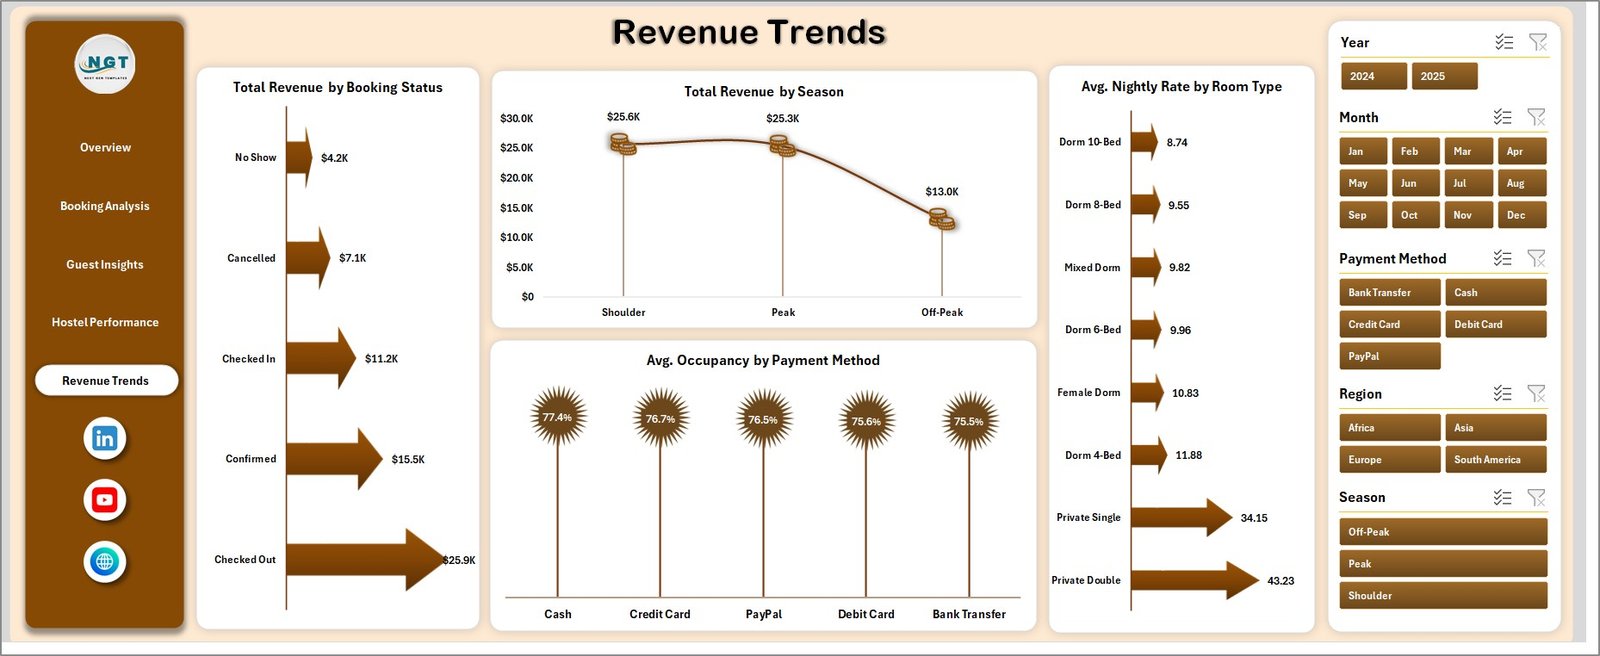
📈 Charts Explained
- Total Revenue by Booking Status
Shows revenue based on booking status. It helps track confirmed vs canceled bookings. - Total Revenue by Season
Displays seasonal revenue patterns. It helps plan pricing strategies. - Avg. Nightly Rate by Room Type
Shows pricing trends across room types. It helps optimize room pricing. - Avg. Occupancy by Payment Method
Displays occupancy based on payment method. It helps analyze customer behavior.
📄 Data Sheet Tab – Where Does the Data Come From?
The Data Sheet Tab is the backbone of the dashboard. Here, you need to enter all the raw data in a structured format.
- Maintain consistent data format
- Avoid blank rows
- Use correct data types
As a result, your dashboard will update accurately.
⚙️ Support Sheet – How Does the Dashboard Work?
The Support Sheet contains pivot tables that power the entire dashboard.
- It updates all charts dynamically
- It connects data with visuals
- It ensures fast performance
👉 After updating data, go to Data Tab → Click Refresh All
This will update the entire dashboard instantly.
✅ Advantages of Backpacker Hostels Dashboard in Excel
- ✔️ Centralized Data Management – Keep all hostel data in one place
- ✔️ Real-Time Insights – Instantly view performance metrics
- ✔️ Better Decision Making – Use data to improve operations
- ✔️ Time Saving – Reduce manual reporting efforts
- ✔️ Improved Guest Experience – Track satisfaction and improve services
- ✔️ Customizable – Easily modify based on your needs
🚀 Best Practices for Backpacker Hostels Dashboard in Excel
- 📌 Always keep your data updated regularly
- 📌 Use consistent formats for dates and numbers
- 📌 Avoid manual changes in pivot tables
- 📌 Use slicers for better filtering
- 📌 Keep the support sheet hidden to avoid errors
- 📌 Validate your data before updating
🔚 Conclusion – Why Should You Use This Dashboard?
In conclusion, the Backpacker Hostels Dashboard in Excel is a powerful tool that simplifies hostel management. It helps you track revenue, analyze guest behavior, and improve performance in one place.
Moreover, it saves time, reduces errors, and provides actionable insights. Therefore, if you want to run your hostel efficiently, this dashboard is a must-have tool.
Click to Purchases Backpacker Hostels Dashboard in Excel
❓ Frequently Asked Questions (FAQs)
1. Can beginners use this dashboard?
Yes, beginners can easily use it because it is simple and user-friendly.
2. How do I update the dashboard?
You just need to update the data sheet and click on Refresh All.
3. Can I customize this dashboard?
Yes, you can modify charts, KPIs, and fields based on your needs.
4. Does it work for multiple hostels?
Absolutely, it supports multiple hostel data and comparisons.
5. What tools are used in this dashboard?
It uses Excel features like Pivot Tables, Charts, and Slicers.
6. Is this dashboard suitable for real-time reporting?
Yes, once updated, it provides near real-time insights.
Click to Purchases Backpacker Hostels Dashboard in Excel
Visit our YouTube channel to learn step-by-step video tutorials