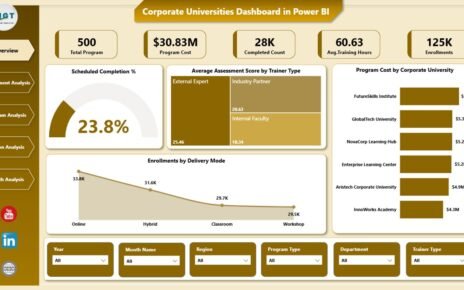
In today’s highly competitive manufacturing industry, precision and efficiency are everything. Especially in industries like automotive, heavy machinery, and industrial equipment, ball bearings play a critical role. However, managing production data, tracking costs, and ensuring timely delivery can quickly become overwhelming.
That’s exactly where the Ball Bearing Production Dashboard in Excel becomes a powerful solution.
Instead of relying on scattered spreadsheets, you can now track everything in one place. Moreover, this dashboard helps you visualize production trends, identify delays, and optimize operations easily. As a result, you make faster and smarter decisions.
In this detailed guide, you will learn everything about this dashboard, including its features, structure, advantages, best practices, and frequently asked questions.
Ball Bearing Production Dashboard in Excel
📊 What is a Ball Bearing Production Dashboard in Excel?
A Ball Bearing Production Dashboard in Excel is an interactive reporting tool designed to monitor and analyze production performance.
It helps manufacturers track:
-
Production volume
-
Unit costs
-
Delayed orders
-
Lead time
-
Material usage
-
Production efficiency
Instead of using multiple reports, you get a centralized view of all production activities. Therefore, you improve visibility and reduce manual work.
🤔 Why Do Manufacturers Need a Production Dashboard?
Manufacturing involves multiple processes, teams, and materials. Without a structured system, it becomes difficult to track performance.
Here’s why this dashboard is essential:
-
It simplifies complex production data
-
It helps identify bottlenecks quickly
-
It improves cost control
-
It supports better planning and forecasting
-
It enhances operational efficiency
In addition, it ensures that managers stay updated with real-time insights.
🧩 Key Features of Ball Bearing Production Dashboard in Excel
This ready-to-use dashboard comes with a well-structured layout. Moreover, it includes multiple pages that provide deep insights into production performance.
🔹 Page Navigator
-
Located on the left side
-
Helps users switch between pages easily
-
Improves user experience and navigation
-
Ball Bearing Production Dashboard in Excel
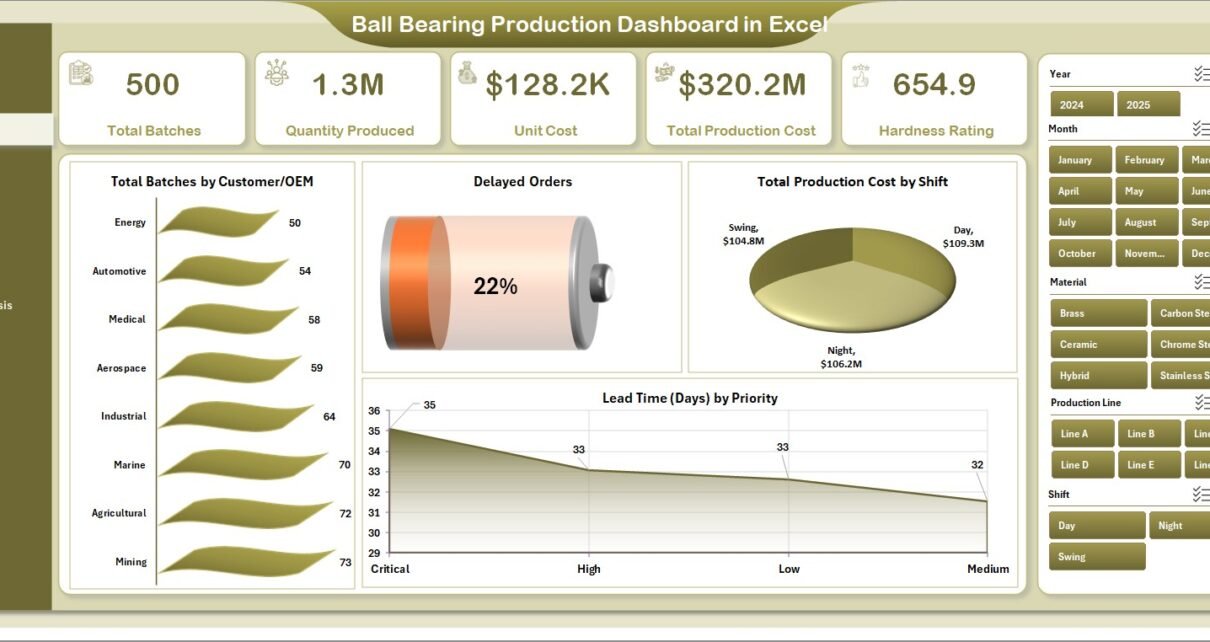
📌 1. Overview Page – What Does It Show?
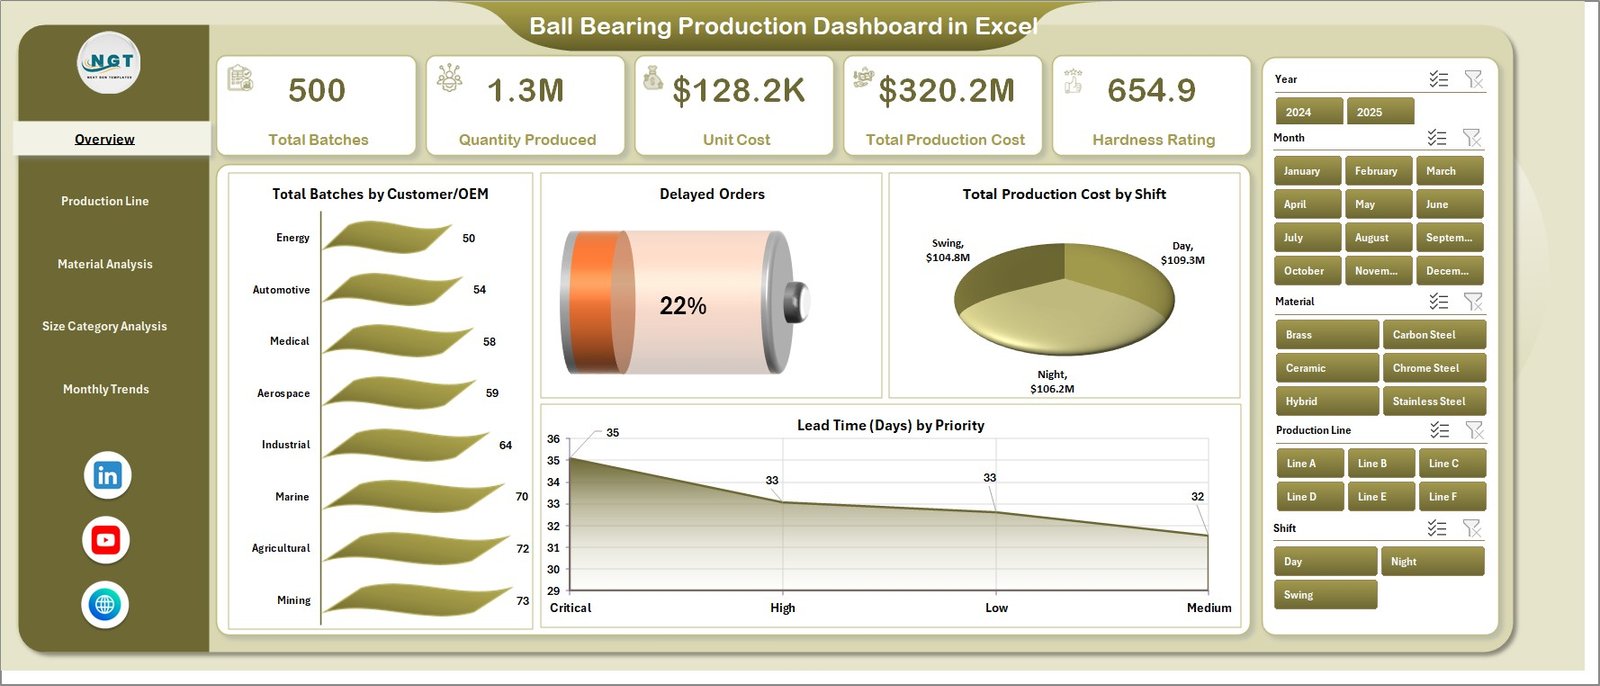
The Overview Page acts as the central control panel.
🔸 Key Highlights:
-
Right-side slicers for filtering data
-
4 KPI cards for quick insights
📊 Charts Included:
-
Total Batches by Customer/OEM
-
Delayed Orders
-
Total Production Cost by Shift
-
Lead Time (Days) by Priority
👉 Therefore, this page gives a quick snapshot of production performance.
⚙️ 2. Production Line Analysis – How Does It Help?
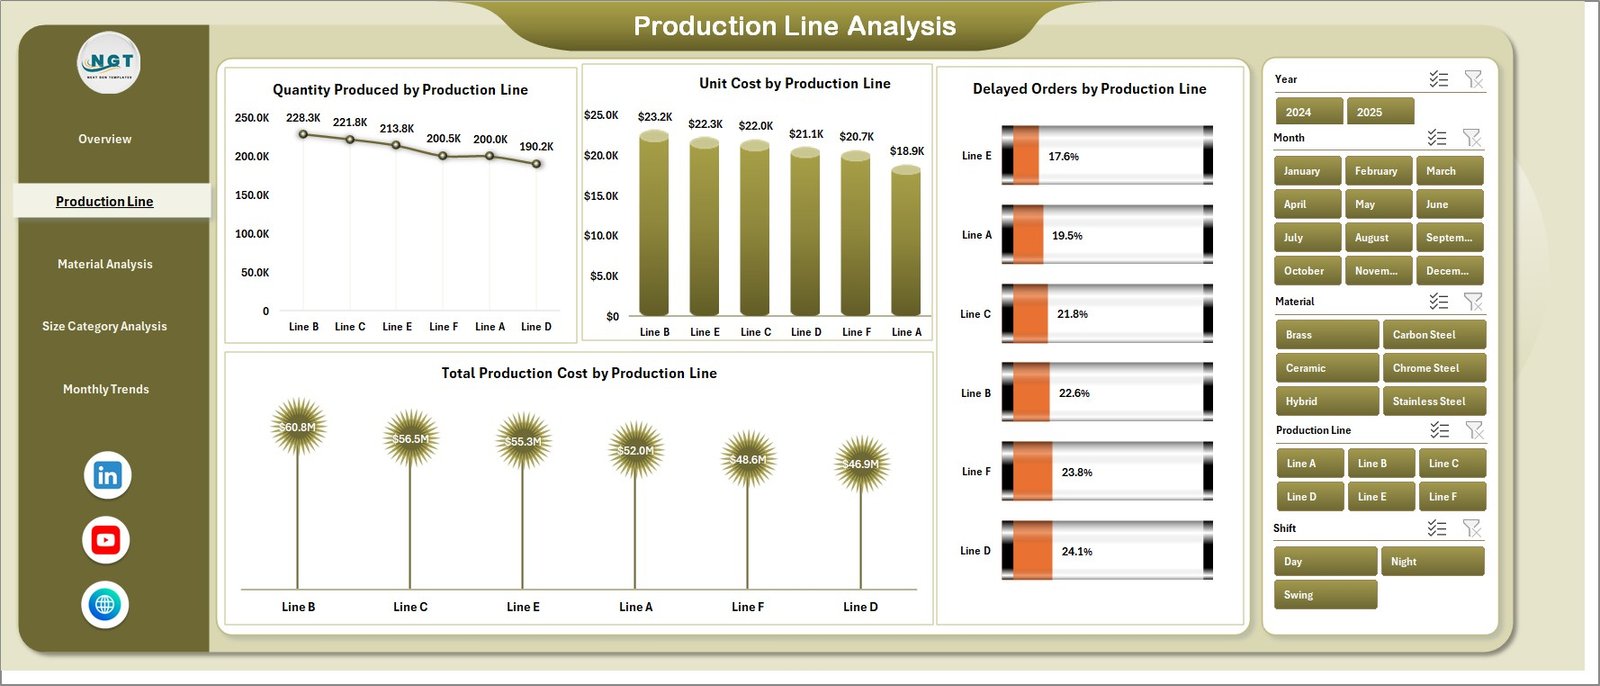
This page focuses on analyzing performance across different production lines.
📊 Charts Included:
-
Quantity Produced by Production Line
-
Unit Cost by Production Line
-
Delayed Orders by Production Line
-
Total Production Cost by Production Line
👉 As a result, you can easily identify which production line performs best and which needs improvement.
🧪 3. Material Analysis – Why Is It Important?
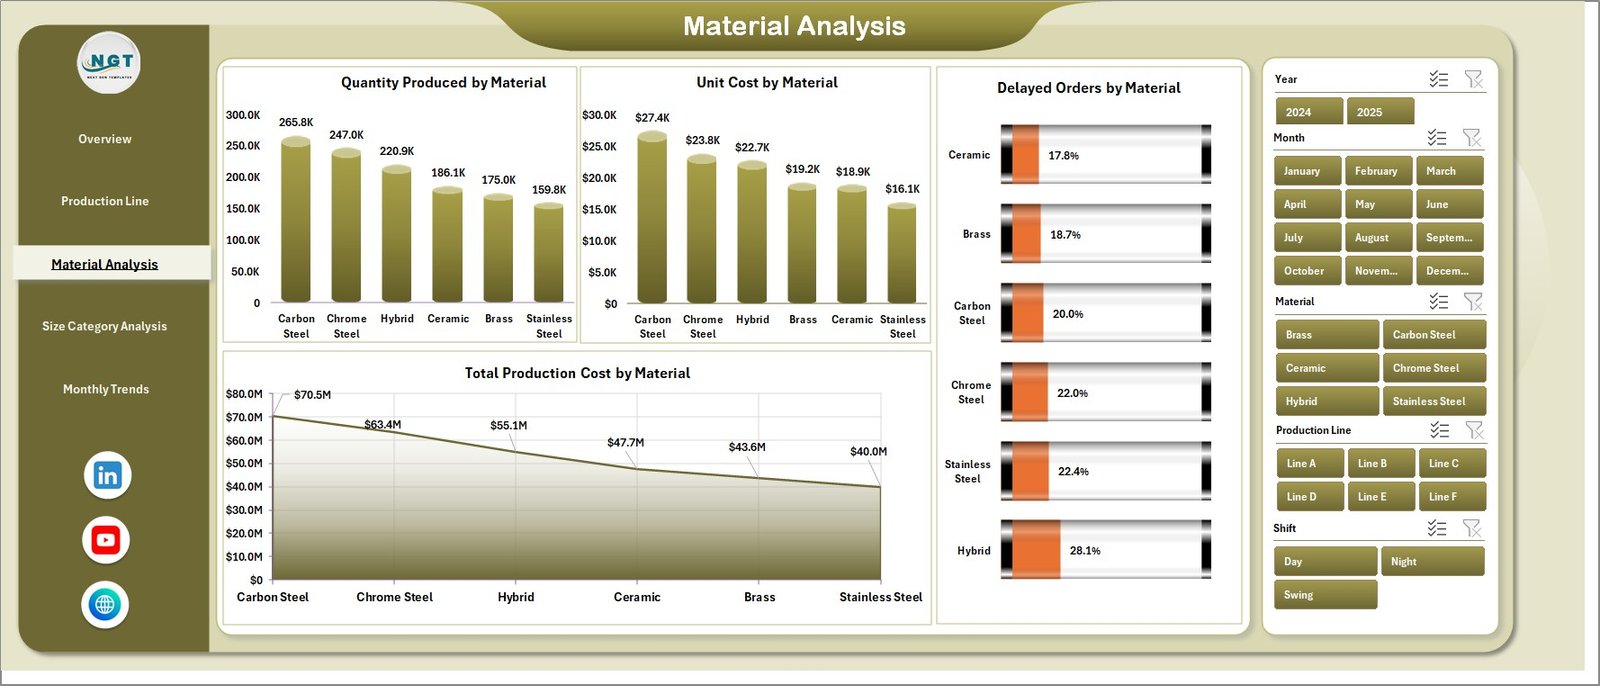
Materials directly impact production quality and cost. Therefore, analyzing material usage is essential.
Ball Bearing Production Dashboard in Excel
📊 Charts Included:
-
Quantity Produced by Material
-
Unit Cost by Material
-
Delayed Orders by Material
-
Total Production Cost by Material
👉 This helps you control material costs and reduce waste.
📏 4. Size Category Analysis – What Insights Does It Provide?
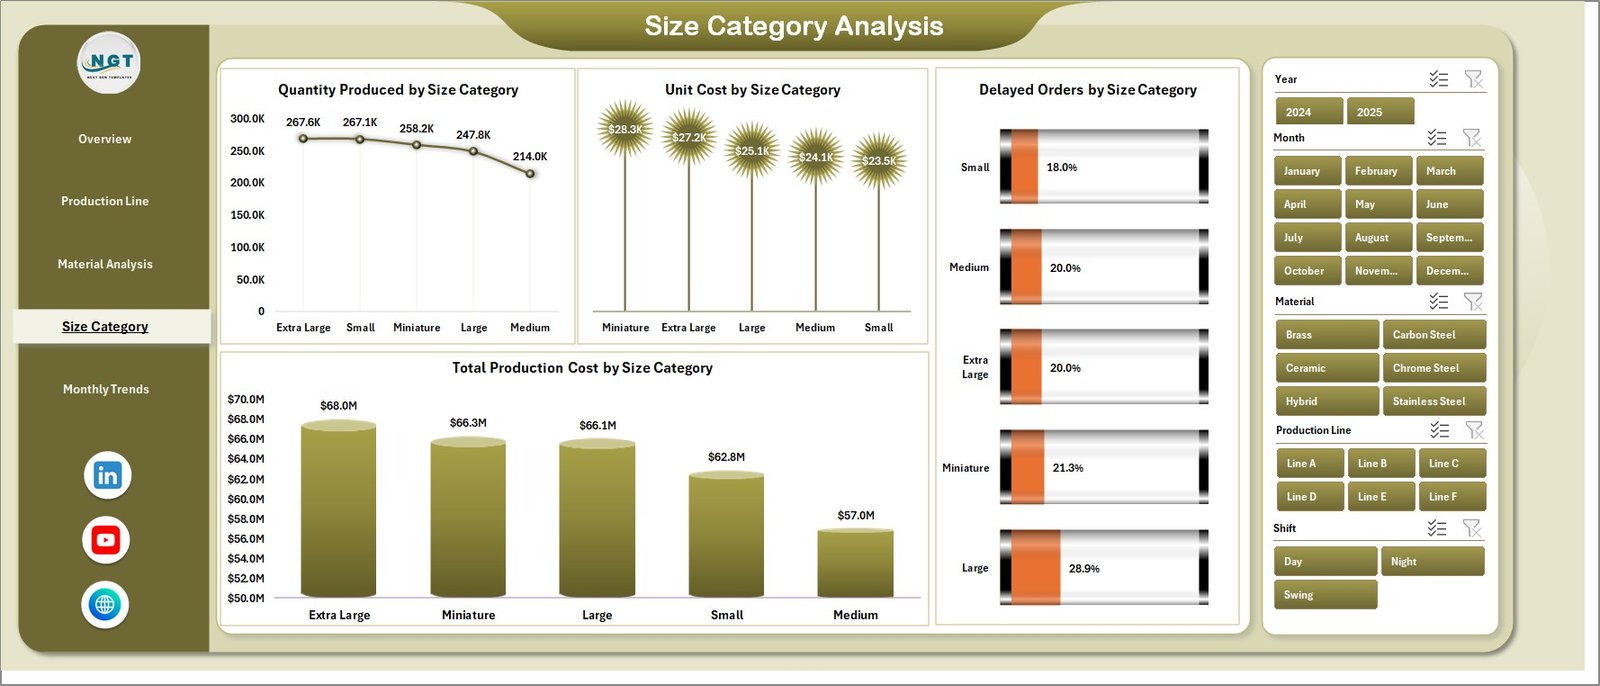
Different bearing sizes require different processes and costs.
📊 Charts Included:
-
Quantity Produced by Size Category
-
Unit Cost by Size Category
-
Delayed Orders by Size Category
-
Total Production Cost by Size Category
👉 Consequently, you can optimize production based on size categories.
📅 5. Month Analysis – How Can You Track Trends?
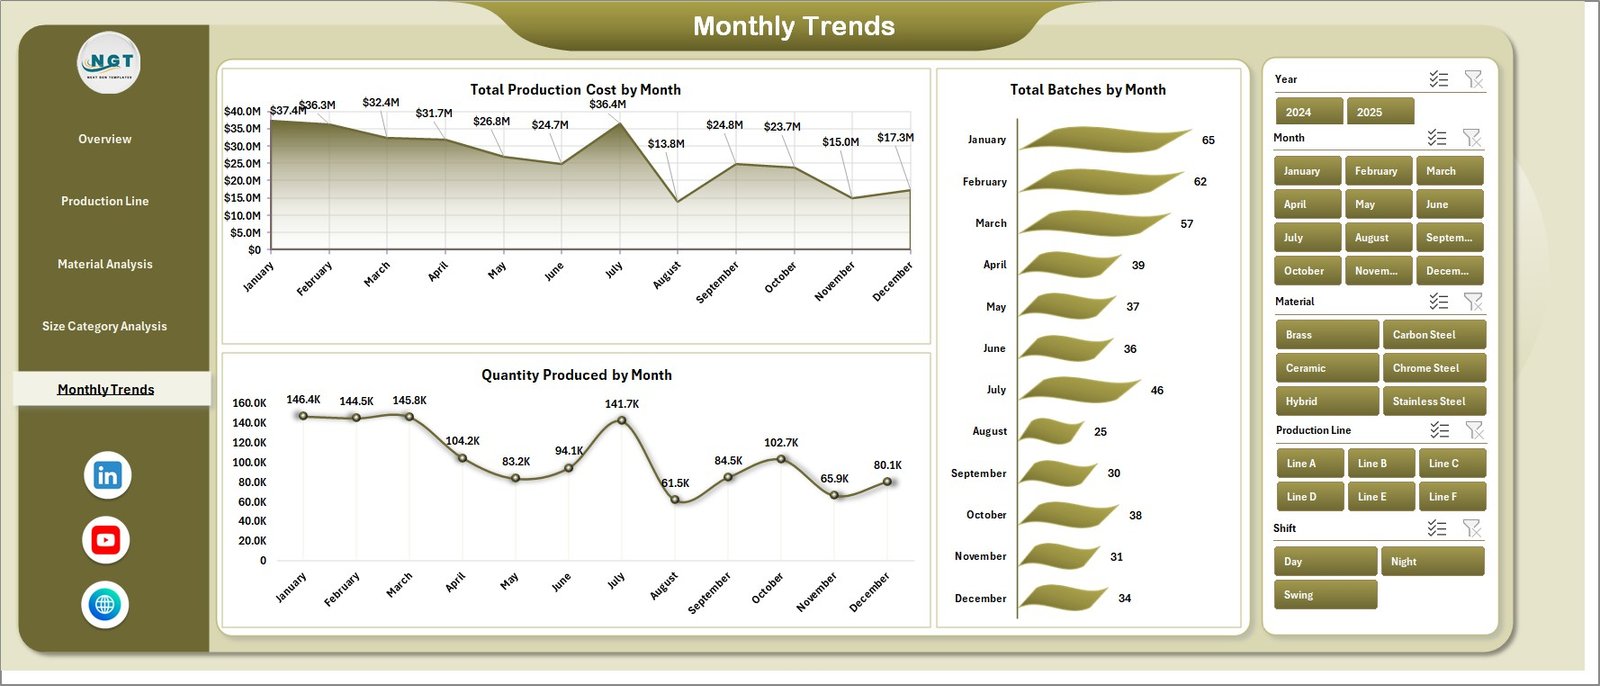
Tracking monthly trends is crucial for planning and forecasting.
📊 Charts Included:
-
Quantity Produced by Month
-
Total Batches by Month
👉 Therefore, you can identify seasonal trends and production patterns.
📂 Supporting Sheets – What’s Behind the Dashboard?
Ball Bearing Production Dashboard in Excel
🔹 Data Sheet
-
Stores all raw production data
-
Includes fields like batch, material, cost, production line, etc.
🔹 Support Sheet
-
Helps manage calculations and backend logic
-
Ensures smooth dashboard performance
🚀 Advantages of Ball Bearing Production Dashboard in Excel
Using this dashboard provides multiple benefits. Let’s explore them.
✅ 1. Centralized Data Management
-
You manage all production data in one place
-
Therefore, you reduce confusion and duplication
✅ 2. Real-Time Insights
-
You track performance instantly
-
As a result, you make faster decisions
✅ 3. Improved Cost Control
-
You monitor unit costs and total production cost
-
Hence, you reduce unnecessary expenses
✅ 4. Better Production Planning
-
You analyze trends and patterns
-
Therefore, you plan production more effectively
✅ 5. Enhanced Efficiency
-
You identify delays and inefficiencies
-
Consequently, you improve productivity
✅ 6. Easy Customization
-
You can modify the dashboard based on your needs
-
Thus, it fits different manufacturing setups
⚠️ Challenges Without a Production Dashboard
Before using a dashboard, many manufacturers face common issues:
-
Scattered data across multiple files
-
Lack of visibility into production performance
-
Difficulty tracking delays
-
Poor cost management
-
Slow decision-making
However, this dashboard eliminates all these problems.
🛠️ Best Practices for the Ball Bearing Production Dashboard in Excel
Ball Bearing Production Dashboard in Excel
To get the best results, you should follow these best practices.
✔️ Keep Data Updated Regularly
Always update the data sheet frequently. Otherwise, insights become outdated.
✔️ Use Clean and Structured Data
Ensure your data follows a consistent format. This improves accuracy.
✔️ Use Slicers Effectively
Filter data using slicers to analyze specific scenarios.
✔️ Monitor KPIs Daily
Check key metrics regularly. This helps you take quick action.
✔️ Customize Based on Business Needs
Adapt the dashboard according to your production process.
✔️ Validate Data Before Upload
Always verify data accuracy to avoid incorrect insights.
📈 How Does This Dashboard Improve Decision-Making?
This dashboard transforms raw data into visual insights. Therefore, decision-making becomes faster and more effective.
For example:
-
You identify high-cost production lines
-
You detect delays instantly
-
You optimize material usage
-
You improve production scheduling
As a result, you gain a competitive advantage.
🔍 Who Can Benefit from This Dashboard?
This dashboard is useful for multiple professionals:
-
Manufacturing Managers
-
Production Supervisors
-
Operations Teams
-
Quality Control Analysts
-
Supply Chain Managers
-
Business Analysts
👉 In short, anyone involved in production can benefit from it.
💡 How to Use the Ball Bearing Production Dashboard in Excel?
Using this dashboard is simple and straightforward.
Step 1: Enter Data
Input production data into the data sheet.
Step 2: Refresh Dashboard
Update pivot tables and charts.
Step 3: Use Slicers
Filter data based on your needs.
Step 4: Analyze Insights
Review KPIs and charts.
Step 5: Take Action
Make data-driven decisions.
📊 Key Metrics You Can Track
Ball Bearing Production Dashboard in Excel
This dashboard helps you monitor important KPIs such as:
-
Total Production Quantity
-
Unit Cost
-
Total Production Cost
-
Delayed Orders
-
Lead Time
-
Production Efficiency
🏁 Conclusion
The Ball Bearing Production Dashboard in Excel is a powerful and practical tool for modern manufacturing. It simplifies data management, improves visibility, and enhances decision-making.
Moreover, it helps you reduce costs, improve efficiency, and ensure timely production. Therefore, it becomes an essential tool for any manufacturing business.
If you want to stay competitive and optimize your operations, this dashboard is the perfect solution.
❓ Frequently Asked Questions (FAQs)
1. What is a Ball Bearing Production Dashboard?
It is an Excel-based tool that helps track and analyze production performance, costs, and efficiency.
2. Is this dashboard suitable for small businesses?
Yes, it works for both small and large manufacturing units.
3. Can I customize the dashboard?
Yes, you can modify it based on your production requirements.
4. Do I need advanced Excel skills to use it?
No, basic Excel knowledge is enough to use this dashboard.
5. How often should I update the data?
You should update it daily or weekly for accurate insights.
6. Can this dashboard reduce production costs?
Yes, it helps identify inefficiencies and optimize costs.
7. Does it support real-time data?
It works with updated data, so frequent updates provide near real-time insights.
Visit our YouTube channel to learn step-by-step video tutorials