In today’s highly competitive manufacturing environment, companies must monitor production performance, control costs, and improve efficiency in real time. However, many ball bearing manufacturers still rely on disconnected spreadsheets and manual reports. As a result, decision-making becomes slow and inaccurate.
Therefore, businesses now shift toward advanced analytics tools like Power BI. That’s exactly where the Ball Bearing Production Dashboard in Power BI becomes a powerful solution.
This dashboard helps manufacturers track production batches, monitor costs, analyze revenue, and improve operational efficiency—all in one place.
Click to Purchases Ball Bearing Production Dashboard in Power BI
In this comprehensive guide, you will learn everything about this dashboard, including its features, structure, advantages, best practices, and frequently asked questions.
🤔 What is a Ball Bearing Production Dashboard in Power BI?
A Ball Bearing Production Dashboard in Power BI is an interactive reporting tool designed to monitor and analyze manufacturing performance using real-time data.
It helps you track:
-
Production batches across different lines
-
Manufacturing costs by shift, material, and size
-
Revenue performance by category
-
Monthly production trends
-
Delayed orders and operational efficiency
Instead of managing multiple reports, you can centralize all your production data into one powerful dashboard. As a result, you gain better visibility, faster insights, and improved decision-making.
❓ Why Do Ball Bearing Manufacturers Need a Dashboard?
Manufacturing operations generate large volumes of data every day. However, without proper tools, teams struggle to use this data effectively.
Here’s why you need a dashboard:
-
First, it eliminates manual reporting errors
-
Next, it provides real-time insights
-
Moreover, it improves production planning
-
In addition, it helps control costs
-
Finally, it enhances decision-making speed
Therefore, a Power BI dashboard becomes essential for modern manufacturing businesses.
Click to Purchases Ball Bearing Production Dashboard in Power BI
🧩 Key Features of Ball Bearing Production Dashboard in Power BI
This dashboard comes with 5 interactive pages, each designed to analyze different aspects of production.
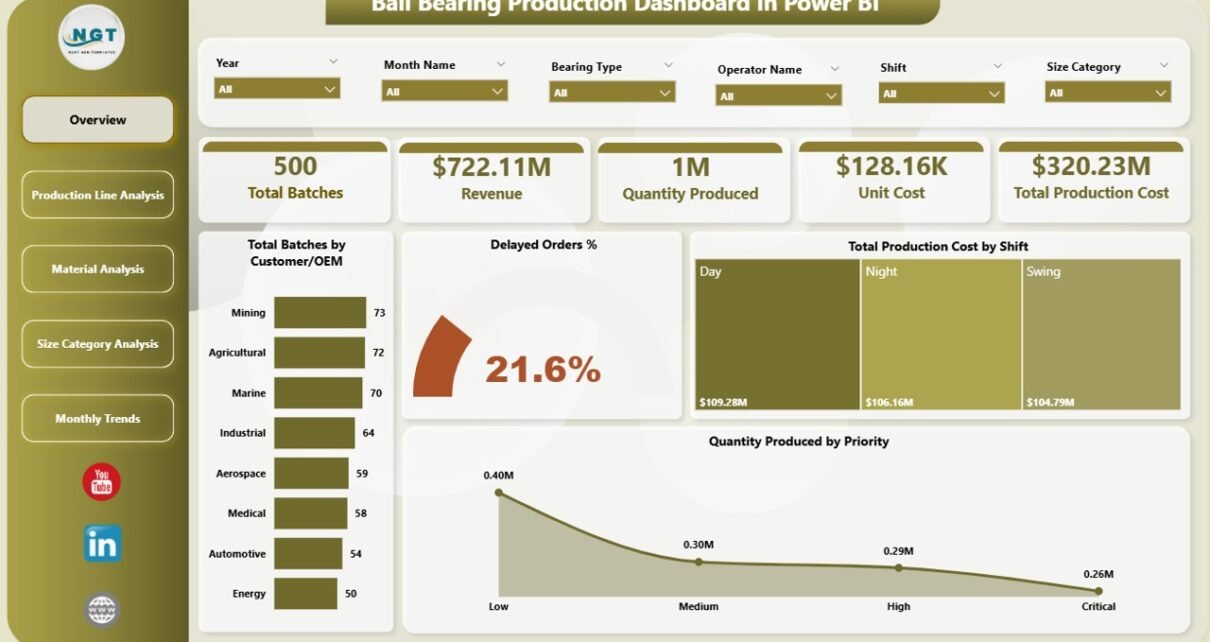
📊 1. Overview Page – The Control Center
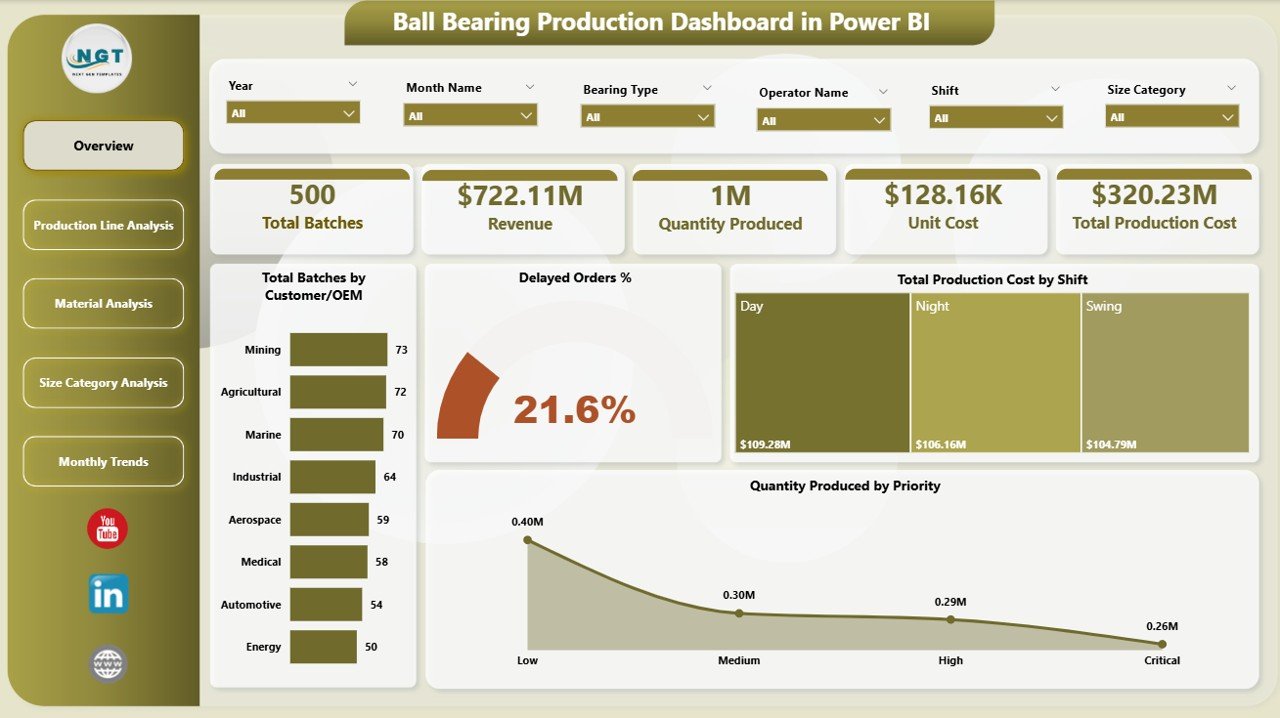
The Overview Page acts as the main dashboard where you can quickly monitor overall performance.
Key Highlights:
-
Slicers (Filters) for dynamic analysis
-
5 KPI Cards:
-
Total Batches
-
Revenue by Customer / OEM
-
Delayed Order %
-
Total Production Cost
-
Production by Shift
-
Benefits:
-
Quickly understand overall performance
-
Identify delays and cost issues instantly
-
Make faster operational decisions
-
Click to Purchases Ball Bearing Production Dashboard in Power BI
⚙️ 2. Production Line Analysis – Where Efficiency Meets Performance
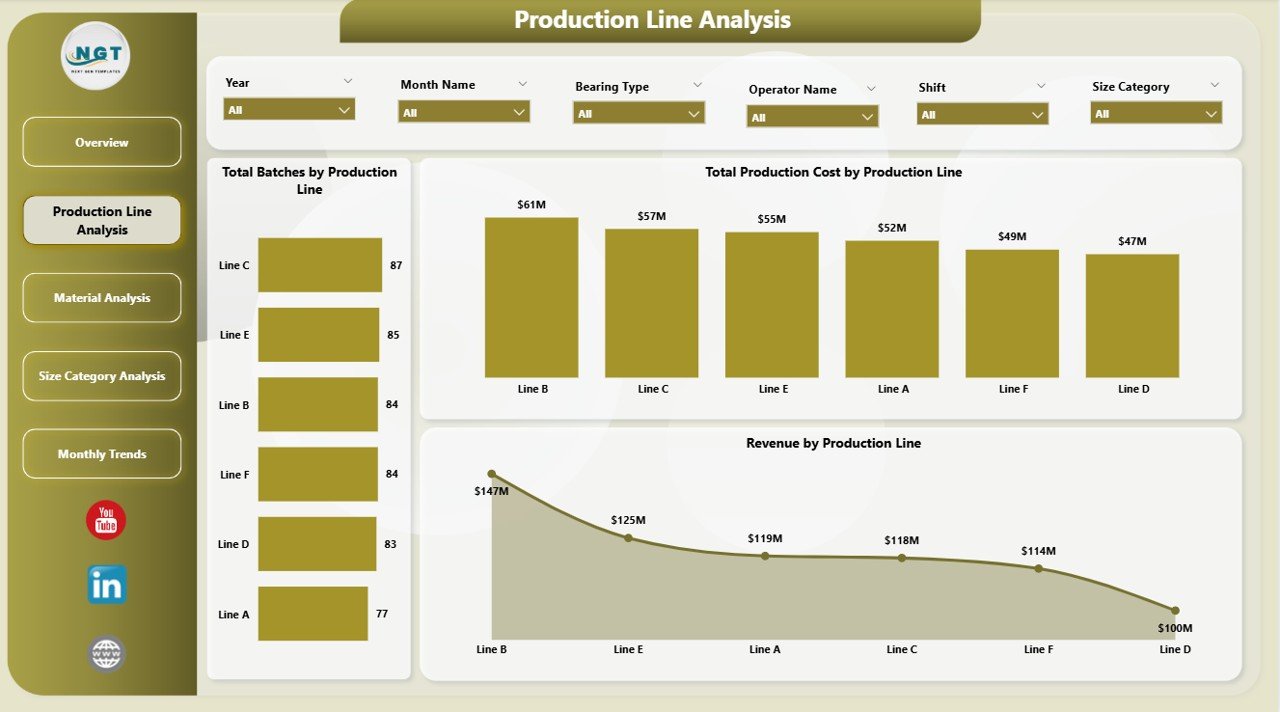
This page focuses on production line performance.
Charts Included:
-
Total Batches by Production Line
-
Total Production Cost by Production Line
-
Revenue by Production Line
Why This Matters:
-
Helps identify high-performing production lines
-
Highlights cost-intensive operations
-
Enables better resource allocation
🧱 3. Material Analysis – Optimize Raw Material Usage
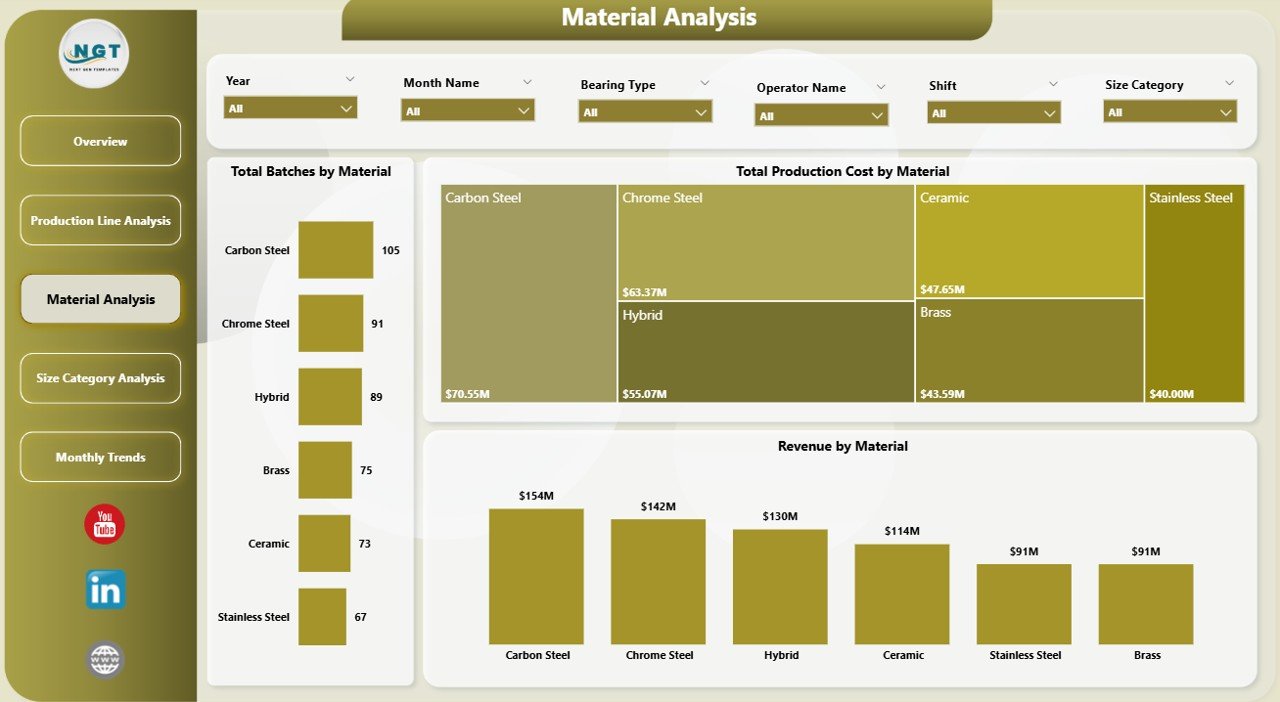
Material plays a crucial role in manufacturing costs. Therefore, this page helps analyze material efficiency.
Charts Included:
-
Total Batches by Material
-
Total Production Cost by Material
-
Revenue by Material
Key Insights:
-
Identify cost-heavy materials
-
Track material-wise profitability
-
Improve procurement strategies
📏 4. Size Category Analysis – Understand Product Demand
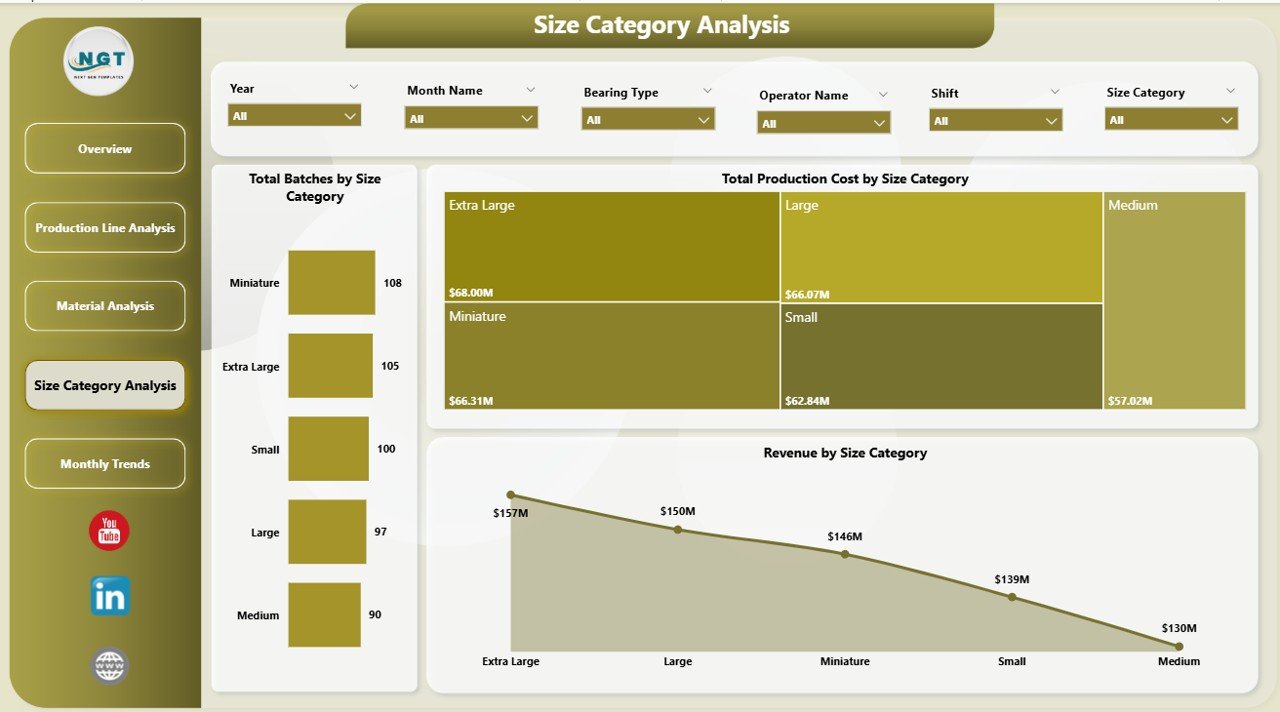
Different ball bearing sizes have different demand and cost structures.
Charts Included:
-
Total Batches by Size Category
-
Total Production Cost by Size Category
-
Revenue by Size Category
Benefits:
-
Analyze demand by size
-
Identify high-profit size categories
-
Improve production planning
-
Click to Purchases Ball Bearing Production Dashboard in Power BI
📅 5. Month Analysis – Track Trends Over Time
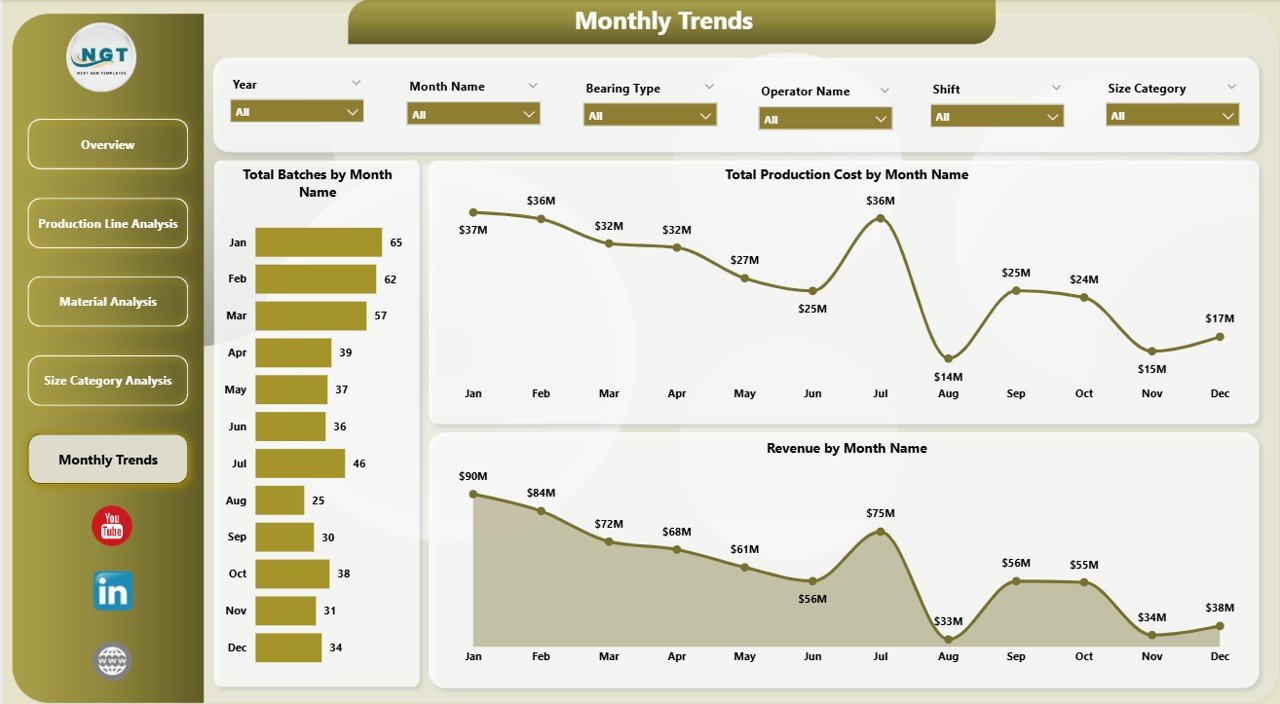
This page helps you monitor monthly performance trends.
Charts Included:
-
Total Batches by Month
-
Total Production Cost by Month
-
Revenue by Month
Why It’s Important:
-
Track seasonal trends
-
Monitor monthly performance
-
Plan future production strategies
🚀 Advantages of Ball Bearing Production Dashboard in Power BI
Using this dashboard provides several powerful benefits:
✅ 1. Real-Time Data Insights
-
You can monitor production instantly
-
You can detect issues quickly
-
You can act faster
✅ 2. Improved Decision-Making
-
You get accurate and visual insights
-
You reduce guesswork
-
You make data-driven decisions
✅ 3. Better Cost Control
-
You track production costs easily
-
You identify cost leaks
-
You improve profitability
✅ 4. Enhanced Production Efficiency
-
You analyze production lines
-
You optimize resources
-
You reduce downtime
✅ 5. Centralized Data Management
-
You store all data in one place
-
You eliminate multiple reports
-
You simplify operations
🛠️ How to Use the Ball Bearing Production Dashboard?
Click to Purchases Ball Bearing Production Dashboard in Power BI
Using this dashboard is simple and user-friendly.
Step-by-Step Guide:
-
Import Data into Power BI
-
Upload production, cost, and revenue data
-
-
Use Slicers for Filtering
-
Select month, production line, or material
-
-
Analyze KPI Cards
-
Check overall performance instantly
-
-
Explore Each Page
-
Review production line, material, size, and monthly analysis
-
-
Make Decisions
-
Use insights to improve operations
-
📊 Key KPIs Tracked in This Dashboard
This dashboard tracks several important manufacturing KPIs:
-
Total Production Batches
-
Revenue by Customer / OEM
-
Production Cost by Shift
-
Delayed Order Percentage
-
Cost by Material
-
Revenue by Size Category
-
Monthly Production Trends
These KPIs help you monitor performance effectively.
🎯 Who Can Benefit from This Dashboard?
This dashboard serves multiple roles in a manufacturing organization:
👨🏭 Production Managers
-
Monitor production efficiency
-
Track output and delays
💰 Finance Teams
-
Analyze cost and profitability
-
Monitor revenue trends
🏭 Plant Managers
-
Optimize operations
-
Improve performance
📈 Business Analysts
-
Generate insights
-
Support decision-making
⚠️ Challenges Without a Production Dashboard
Without a dashboard, companies face several issues:
-
Lack of real-time visibility
-
Data scattered across systems
-
Slow reporting process
-
Increased errors
-
Poor decision-making
Therefore, adopting a Power BI dashboard becomes essential.
🧠 Best Practices for the Ball Bearing Production Dashboard
Click to Purchases Ball Bearing Production Dashboard in Power BI
To get the best results, follow these best practices:
✔️ 1. Keep Data Updated
-
Always use the latest data
-
Ensure data accuracy
✔️ 2. Use Clean Data Sources
-
Avoid duplicate entries
-
Maintain data consistency
✔️ 3. Focus on Key KPIs
-
Do not overload the dashboard
-
Highlight important metrics
✔️ 4. Use Interactive Filters
-
Enable easy navigation
-
Improve user experience
✔️ 5. Review Dashboard Regularly
-
Track performance weekly or monthly
-
Update strategies accordingly
🔮 Future Scope of Manufacturing Dashboards
As technology evolves, dashboards will become even more powerful.
Future Trends:
-
AI-driven insights
-
Predictive analytics
-
Real-time IoT integration
-
Automated reporting
-
Advanced data visualization
Therefore, investing in dashboards today prepares you for the future.
🏁 Conclusion
The Ball Bearing Production Dashboard in Power BI transforms how manufacturers track and analyze their operations. Instead of relying on manual reports, you can now access real-time insights in a centralized system.
Moreover, this dashboard helps you monitor production, control costs, analyze revenue, and improve efficiency. As a result, you make smarter and faster decisions.
If you want to optimize your manufacturing process and stay ahead of the competition, this dashboard becomes an essential tool.
❓ Frequently Asked Questions (FAQs)
1. What is a Ball Bearing Production Dashboard in Power BI?
It is an interactive tool that helps track production, cost, and revenue using real-time data.
2. Can beginners use this dashboard?
Yes, the dashboard is user-friendly and easy to navigate.
3. What data is required for this dashboard?
You need production data, cost details, revenue data, and time-based information.
4. How often should I update the dashboard?
You should update it daily or weekly for accurate insights.
5. Can I customize the dashboard?
Yes, you can modify KPIs, charts, and filters based on your needs.
6. Is Power BI suitable for manufacturing dashboards?
Yes, Power BI provides powerful visualization and real-time analytics capabilities.
7. What are the main benefits of using this dashboard?
It improves decision-making, reduces costs, and enhances efficiency.
Visit our YouTube channel to learn step-by-step video tutorials