In today’s competitive banking environment, data-driven decision-making is not just an advantage — it’s a necessity. Every financial institution, whether a small cooperative bank or a global banking corporation, needs to measure, track, and evaluate its performance across key metrics. That’s where the Banking KPI Scorecard in Excel comes in.
This ready-to-use Excel-based scorecard is designed to help banks measure performance, monitor trends, and improve operational efficiency. It simplifies performance evaluation by turning raw data into visual insights — allowing banking professionals to focus on strategy rather than spreadsheets.
Click to buyBanking KPI Scorecard in Excel
What Is a Banking KPI Scorecard in Excel?
A Banking KPI Scorecard in Excel is a dynamic performance-tracking tool that enables banks to monitor critical Key Performance Indicators (KPIs) across various departments such as Retail Banking, Corporate Banking, Risk Management, and Customer Service.
This Excel-based tool provides a consolidated view of a bank’s financial and operational health. It compares actual performance with targets and previous year’s data to help management teams identify strengths, weaknesses, and opportunities for improvement.
Because it’s built in Excel, it’s:
- Easy to customize
- Familiar to most users
- Shareable across departments
- Functional without expensive software
The scorecard works like a performance dashboard — simple, structured, and insightful — enabling faster decision-making and better accountability.
Key Features of the Banking KPI Scorecard in Excel
This powerful scorecard template is structured across four interactive worksheets, each serving a unique purpose to ensure end-to-end performance tracking.
Scorecard Sheet
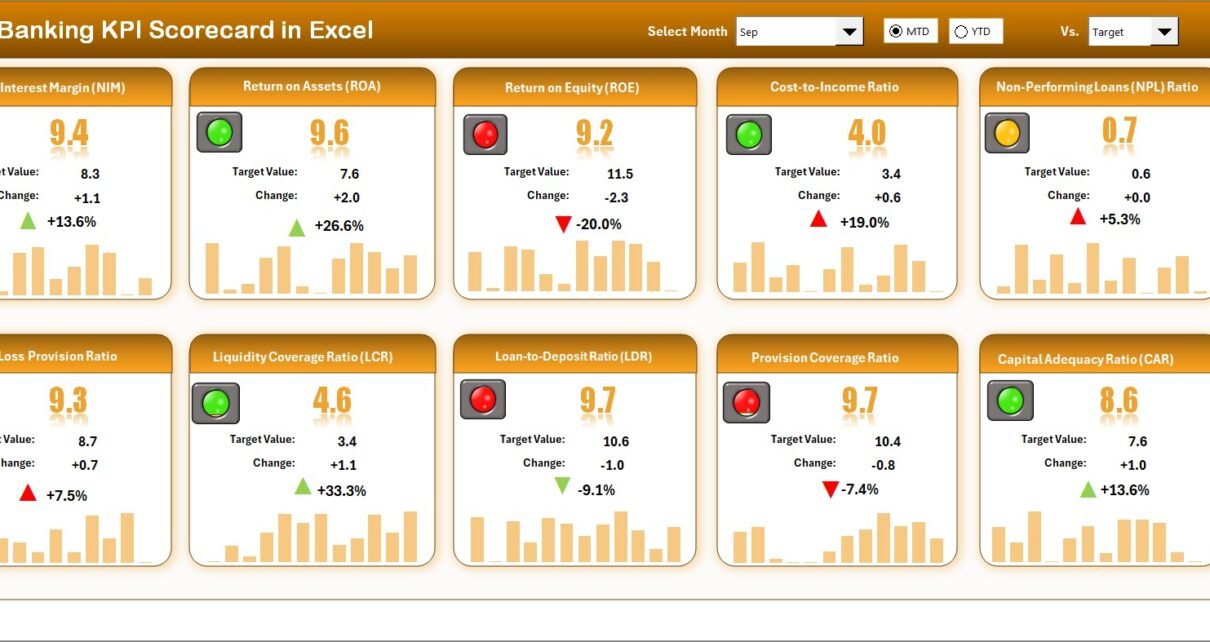
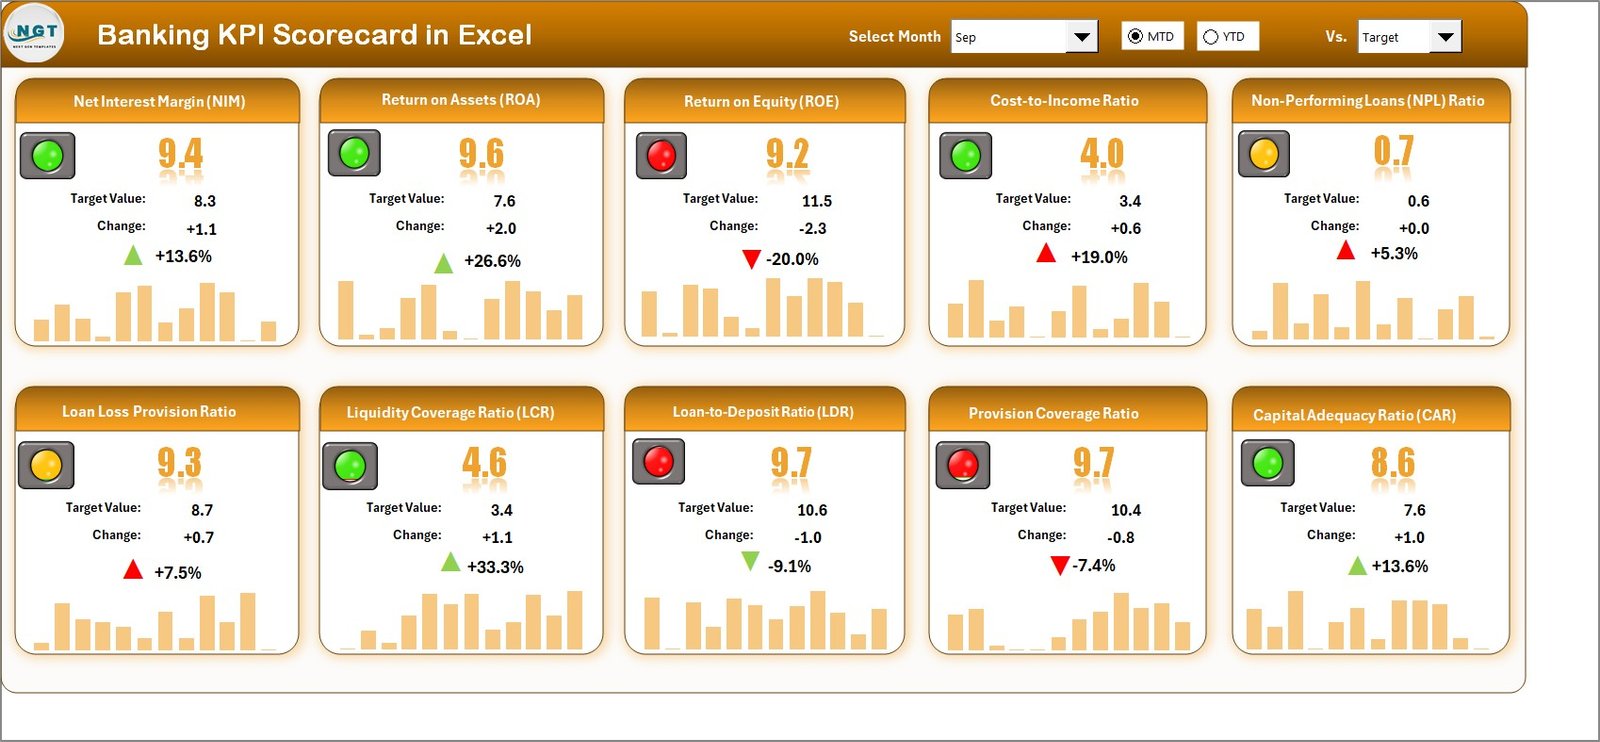
This is the main interface of the Banking KPI Scorecard where all KPI performance metrics are visualized.
Key Highlights:
- Dropdown Menus: Easily select the month and performance type (MTD or YTD).
- Actual vs Target Comparison: Instantly see whether KPIs meet expectations.
- Visual Indicators: Color-coded status (Green = Good, Yellow = Moderate, Red = Needs Improvement).
- Comprehensive KPI Overview: View 10 KPIs in a single glance for holistic performance monitoring.
- Conditional Formatting: Automatically highlights top and bottom-performing areas for quick focus.
This page acts as your control center — perfect for management meetings and monthly performance reviews.
Click to buyBanking KPI Scorecard in Excel
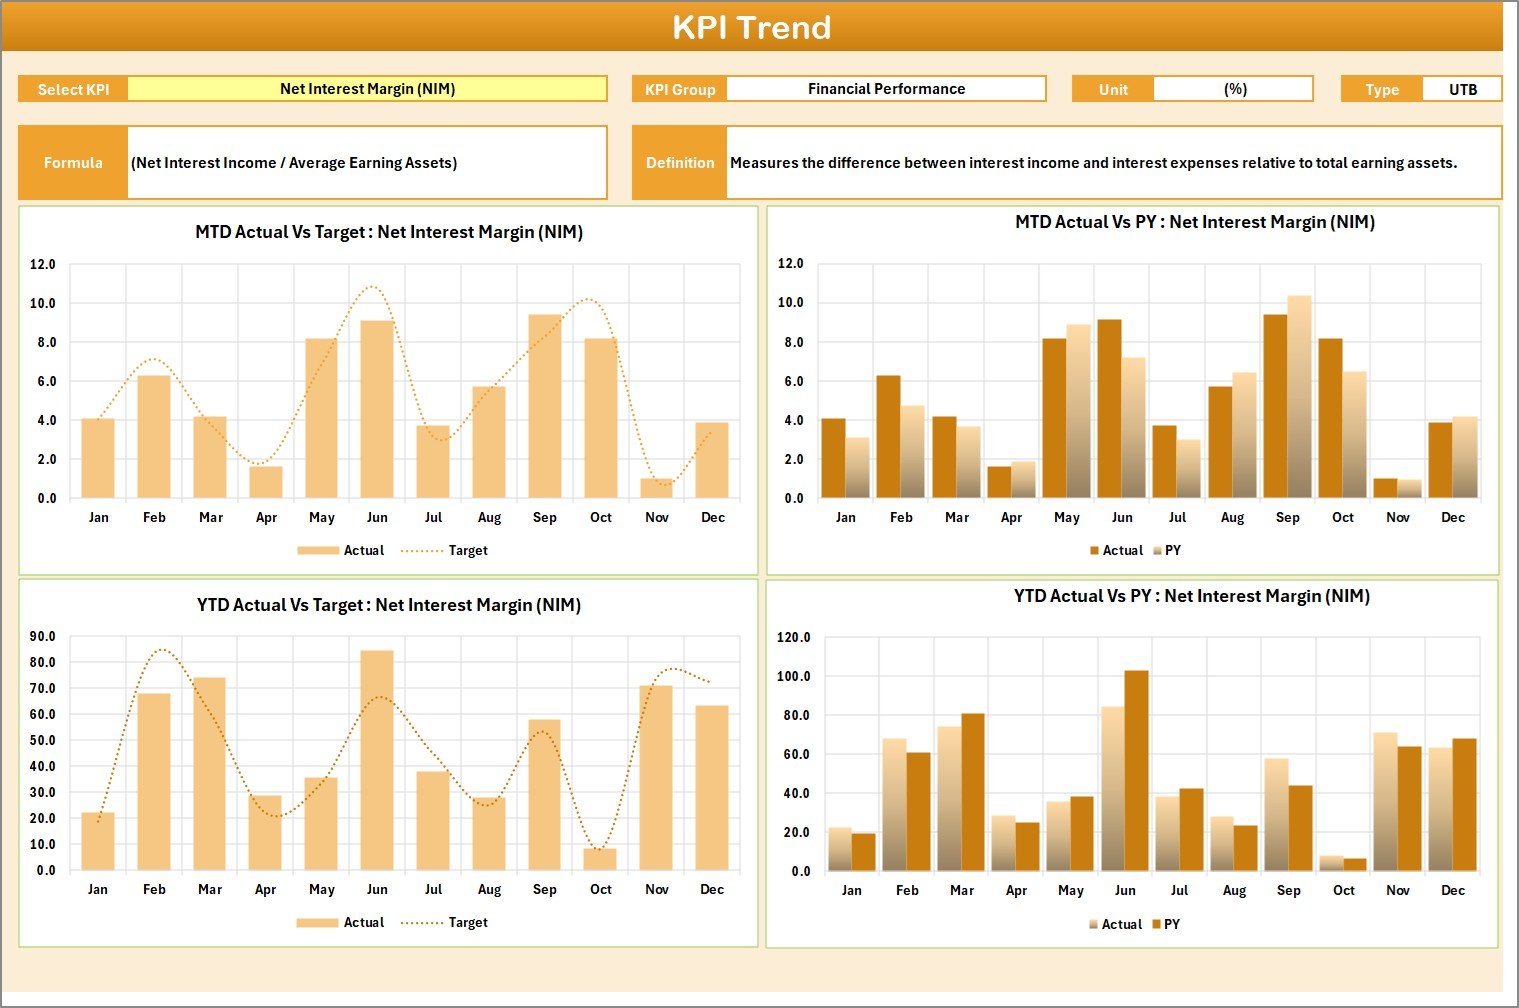
KPI Trend Sheet
This sheet provides visual insights into performance trends over time.
Features:
- Interactive Dropdown (Cell C3): Select any KPI to view detailed performance.
- Displayed Information: KPI Group, Unit, KPI Type (UTB or LTB), Formula, and Definition.
- MTD and YTD Charts: Compare Actual, Target, and Previous Year data for better trend analysis.
- Performance Insights: Identify growth patterns, seasonal shifts, or areas requiring corrective action.
This trend-based analysis is vital for strategic forecasting and goal setting.
Click to buyBanking KPI Scorecard in Excel
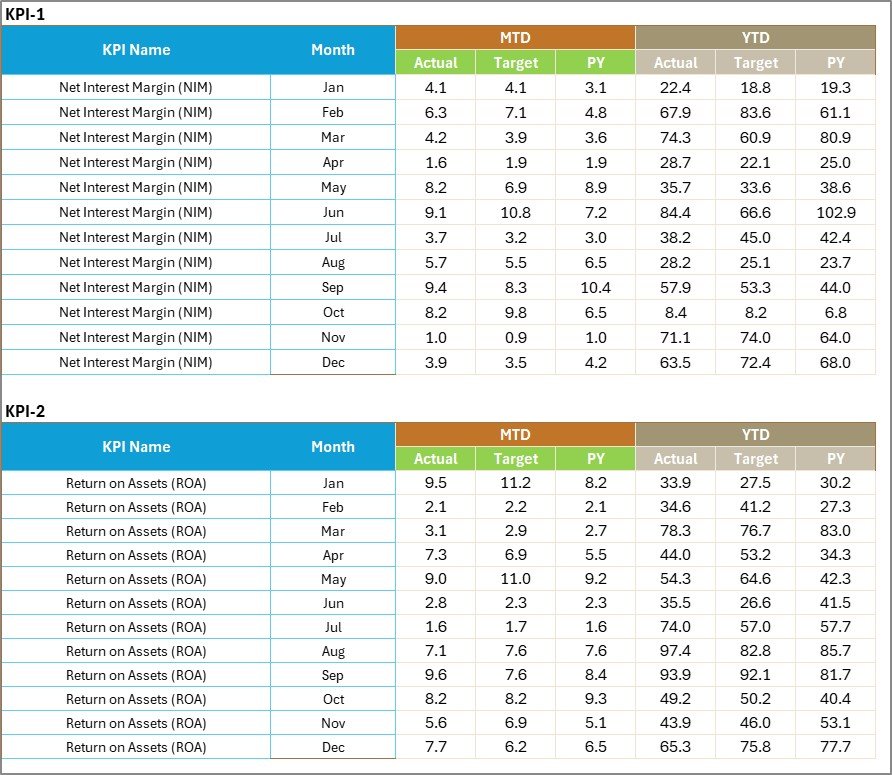
Input Data Sheet
This sheet is the data engine behind the scorecard.
Core Functions:
- Data Entry: Input all relevant KPI values — actuals, targets, and previous year data.
- Dynamic Update: Once data is entered, all linked charts and visuals refresh automatically.
- Flexibility: Add new KPIs or extend existing datasets as the bank grows.
- Error-Proof Layout: Structured columns minimize data entry mistakes.
Keeping this sheet updated ensures your KPI insights remain accurate and timely.
Click to buyBanking KPI Scorecard in Excel
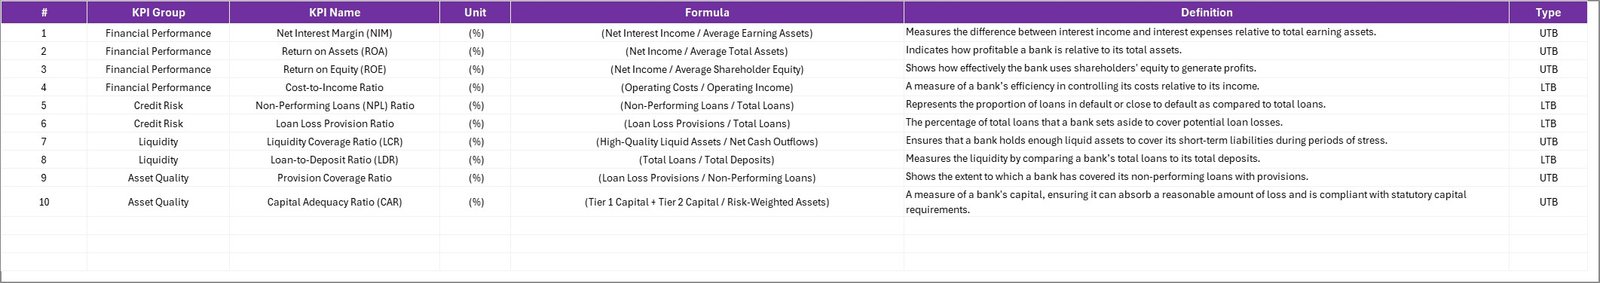
KPI Definition Sheet
This sheet defines the meaning and logic behind each KPI.
Included Fields:
- KPI Name
- KPI Group
- Unit
- Formula
- Definition
- Type (Lower the Better / Upper the Better)
This transparency ensures everyone in the team understands how each KPI is measured — from executives to analysts.
How the Banking KPI Scorecard Works
The workflow of the Banking KPI Scorecard in Excel is designed to be intuitive and automated:
- Data Entry: Enter monthly KPI values in the Input Data Sheet.
- Dynamic Update: The Scorecard Sheet auto-refreshes with new performance numbers.
- Trend Visualization: The KPI Trend Sheet shows historical performance through line or bar charts.
- Definition Reference: The KPI Definition Sheet ensures clarity and uniform understanding.
- All calculations (such as variance, growth %, or achievement rate) are performed automatically using Excel formulas. This eliminates manual calculation errors and ensures real-time insights.
Why Banks Need a KPI Scorecard
Banking operations involve hundreds of processes — from customer onboarding to loan disbursement. Tracking these activities manually often leads to inefficiencies and delays.
A KPI Scorecard centralizes performance monitoring and aligns all departments with the bank’s strategic goals. It encourages data-driven culture and improves decision-making at every level.
Benefits of Using Excel for Banking KPIs
Many banks use specialized software for analytics, but Excel remains the most accessible and adaptable tool. Here’s why:
- Familiar Interface: Almost every banker knows Excel basics.
- No Licensing Cost: No need for extra software or expensive systems.
- Customizable: KPIs, charts, and visuals can be modified easily.
- Integration Friendly: Compatible with other banking data systems and reports.
- Offline Access: Can be used without an internet connection — ideal for restricted environments.
This makes Excel-based KPI scorecards ideal for both small and large banks alike.
Advantages of Banking KPI Scorecard in Excel
Let’s look at the top advantages of using this ready-to-use template:
- Enhanced Visibility
Gain a clear overview of performance across departments with interactive visuals and charts.
- Improved Decision-Making
Data-driven insights help leadership teams make faster and more accurate decisions.
- Time Savings
Automated updates and calculations reduce manual effort, saving hours of reporting work.
- Customizable Metrics
Add or modify KPIs according to your bank’s evolving needs.
- Error Reduction
Structured input and formula-driven calculations ensure data accuracy.
- Departmental Alignment
All teams — finance, marketing, HR, and operations — work toward the same measurable targets.
Opportunities for Improvement
While Excel-based scorecards are powerful, there’s always room for improvement:
- Automate data import using Power Query or VBA macros.
- Add interactive slicers for dynamic filtering by branch, region, or department.
- Integrate with Power BI for real-time visualization.
- Set up data validation to prevent incorrect entries.
- Use version control or shared drives for multi-user access.
These upgrades can transform a simple scorecard into a robust business intelligence tool.
Best Practices for the Banking KPI Scorecard in Excel
To get the most from your scorecard, follow these best practices:
- Define KPIs Clearly
Ensure each KPI has a clear formula, owner, and purpose.
- Maintain Consistent Data Entry
Update data monthly and validate against actual results.
- Use Conditional Formatting
Highlight key insights with colors and icons for quick interpretation.
- Limit the Number of KPIs
Focus on the most impactful 10–15 KPIs per department to avoid clutter.
- Automate Repetitive Tasks
Use macros or Excel formulas (like SUMIFS, AVERAGEIFS, or INDEX MATCH) to save time.
- Secure Your File
Use password protection or restricted access for sensitive financial data.
- Regularly Review and Update KPIs
Adapt KPIs as the bank’s priorities and external environment change.
Real-World Example
Imagine a regional bank that uses this scorecard monthly.
After implementing it:
- Loan disbursement accuracy improved by 15%.
- Response time to customer queries reduced by 25%.
- Non-performing asset ratio dropped from 4.2% to 3.1%.
- Profitability improved because management could track underperforming branches faster.
This demonstrates how a structured scorecard in Excel can drive measurable performance improvements.
Conclusion
The Banking KPI Scorecard in Excel is more than a reporting tool — it’s a strategic partner in growth. It helps banks turn complex data into actionable insights, enabling continuous improvement and smarter decision-making.
With built-in visual indicators, dynamic comparisons, and customizable KPIs, this Excel scorecard ensures your entire organization stays aligned with performance objectives. Whether you’re managing loan portfolios, deposits, or customer experience — this template provides the clarity and control you need.
If you’re looking to simplify banking performance tracking without expensive software, the Banking KPI Scorecard in Excel is your best solution.
Frequently Asked Questions (FAQs)
- What is a Banking KPI Scorecard?
A Banking KPI Scorecard is a structured Excel tool that helps banks monitor and measure performance across key metrics like profitability, customer satisfaction, and risk management.
- How many KPIs can I track using this template?
The template allows you to track 10 KPIs per view, but you can easily extend it to include more metrics.
- Can I customize the KPI Scorecard?
Yes, you can modify KPI names, formulas, and visuals to match your bank’s performance framework.
- Does the scorecard support both MTD and YTD views?
Absolutely. You can toggle between Month-to-Date (MTD) and Year-to-Date (YTD) metrics using dropdown options.
- Is any coding or VBA knowledge required?
No coding is required. The scorecard works with built-in Excel formulas and conditional formatting.
- How does this differ from a Power BI dashboard?
A Power BI dashboard is online and interactive, while the Excel scorecard is offline and simpler, ideal for internal reviews.
- Can multiple users update the file?
Yes, if stored on a shared drive like OneDrive or SharePoint, multiple users can collaborate simultaneously.
- What are the file requirements?
You’ll need Microsoft Excel 2016 or later for full functionality, including dynamic charts and dropdown menus.
Visit our YouTube channel to learn step-by-step video tutorials
Watch the step-by-step video tutorial:
Click to buyBanking KPI Scorecard in Excel