In today’s fast-growing renewable energy sector, biofuel plants generate massive amounts of operational, financial, and performance data. However, many organizations still struggle to manage this data effectively. As a result, they rely on scattered spreadsheets, manual reporting, and delayed insights.
So, how can you simplify data management and improve decision-making?
Click to Purchases Biofuel Plants Dashboard in Excel
👉 The answer is the Biofuel Plants Dashboard in Excel.
This powerful, ready-to-use dashboard transforms complex biofuel plant data into clear, interactive, and actionable insights. Moreover, it helps you monitor plant performance, analyze revenue, and optimize operations—all in one place.
In this detailed guide, you will learn everything about this dashboard, including features, benefits, best practices, and frequently asked questions.
🤔 What is a Biofuel Plants Dashboard in Excel?
A Biofuel Plants Dashboard in Excel is an advanced data visualization tool designed to monitor and analyze biofuel plant operations.
Instead of using multiple disconnected Excel sheets, this dashboard centralizes all your data into a single, interactive system. Therefore, you can easily track performance, compare metrics, and make faster decisions.
With this dashboard, you can monitor:
-
Plant uptime performance
-
Revenue trends
-
Average profit margins
-
Technology efficiency
-
Feedstock utilization
-
Country-wise performance
As a result, you gain better visibility and improve operational efficiency.
Click to Purchases Biofuel Plants Dashboard in Excel
🚀 Why Do You Need a Biofuel Dashboard?
Managing biofuel plants without a structured dashboard creates several challenges. For example, teams often miss critical insights, delay decisions, and struggle with data accuracy.
However, when you use a dashboard, everything changes.
Here’s why you need it:
-
You get real-time performance tracking
-
You reduce dependency on manual reports
-
You improve data accuracy and consistency
-
You identify inefficiencies quickly
-
You make data-driven decisions faster
Therefore, this dashboard becomes an essential tool for biofuel plant managers, analysts, and business leaders.
📊 Key Features of Biofuel Plants Dashboard in Excel
This dashboard comes with a well-structured design and powerful features. Moreover, it includes multiple analytical pages to give you a complete view of your operations.
🔹 Page Navigator (Easy Navigation)
The dashboard includes a Page Navigator on the left side. As a result, you can quickly switch between different analysis pages without confusion.
Click to Purchases Biofuel Plants Dashboard in Excel
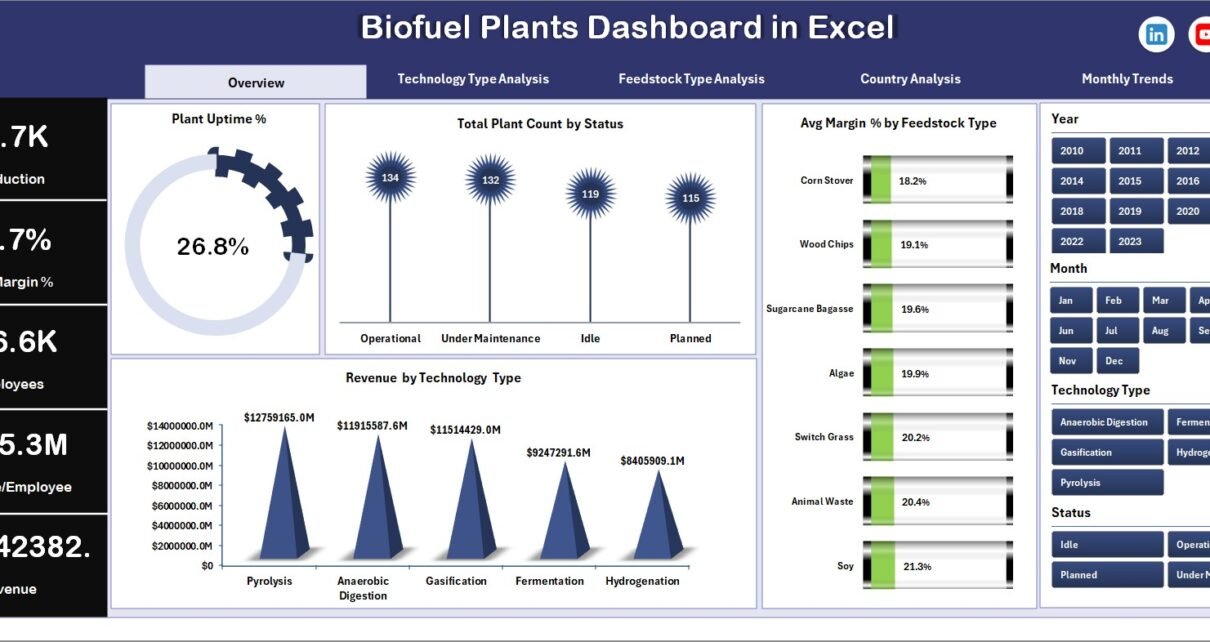
📈 What Does the Overview Page Show?
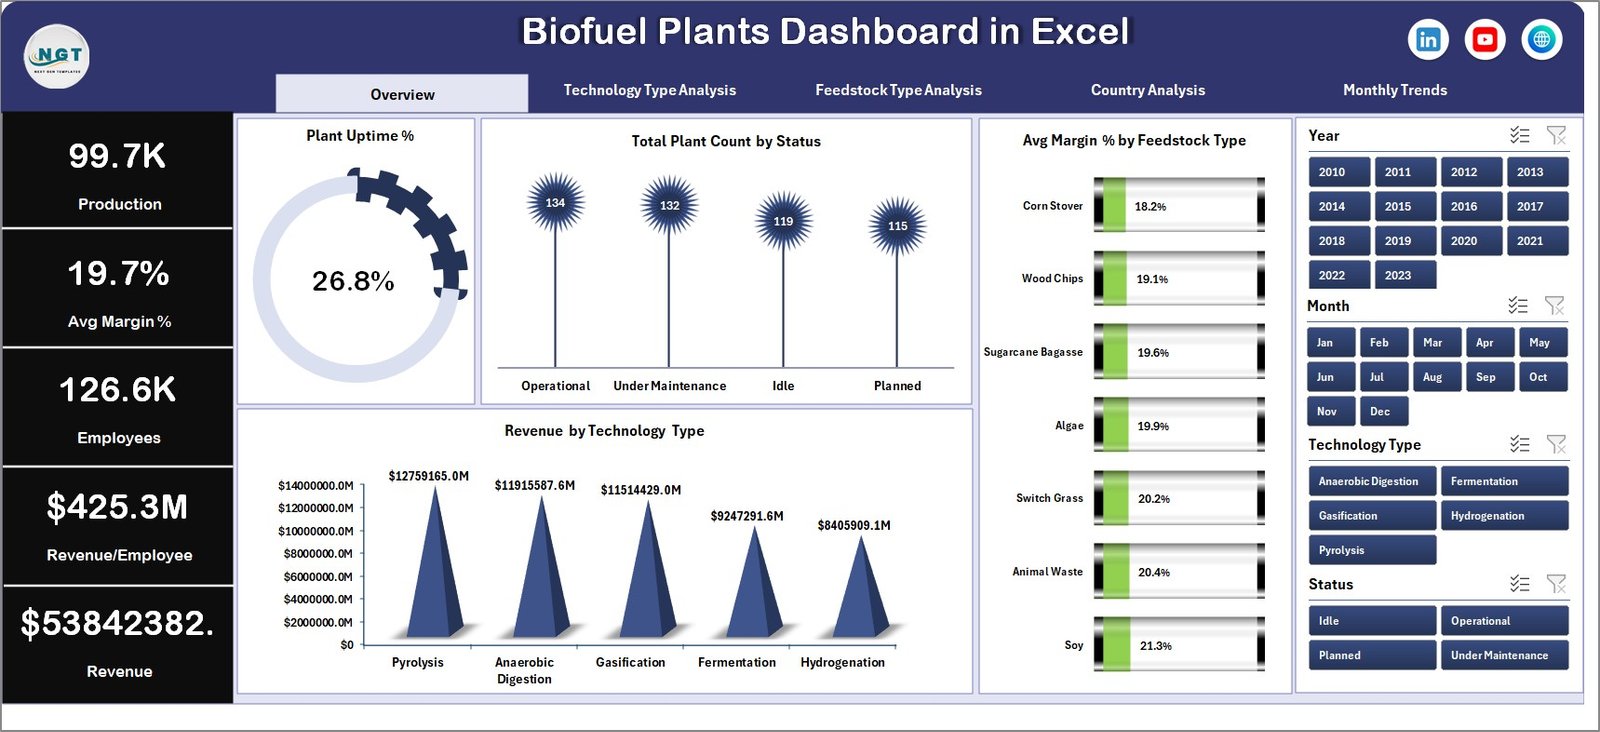
The Overview Page acts as the central hub of the dashboard. Therefore, it provides a quick snapshot of overall performance.
Key Highlights:
-
KPI Cards:
-
Plant Uptime %
-
Total Plant Count
-
Average Margin %
-
-
Charts:
-
Plant Uptime % by Feedstock Type
-
Total Plant Count by Status
-
Average Margin % by Feedstock Type
-
Revenue by Technology Type
-
👉 As a result, you can instantly understand plant performance and profitability.
⚙️ How Does Technology Type Analysis Help?
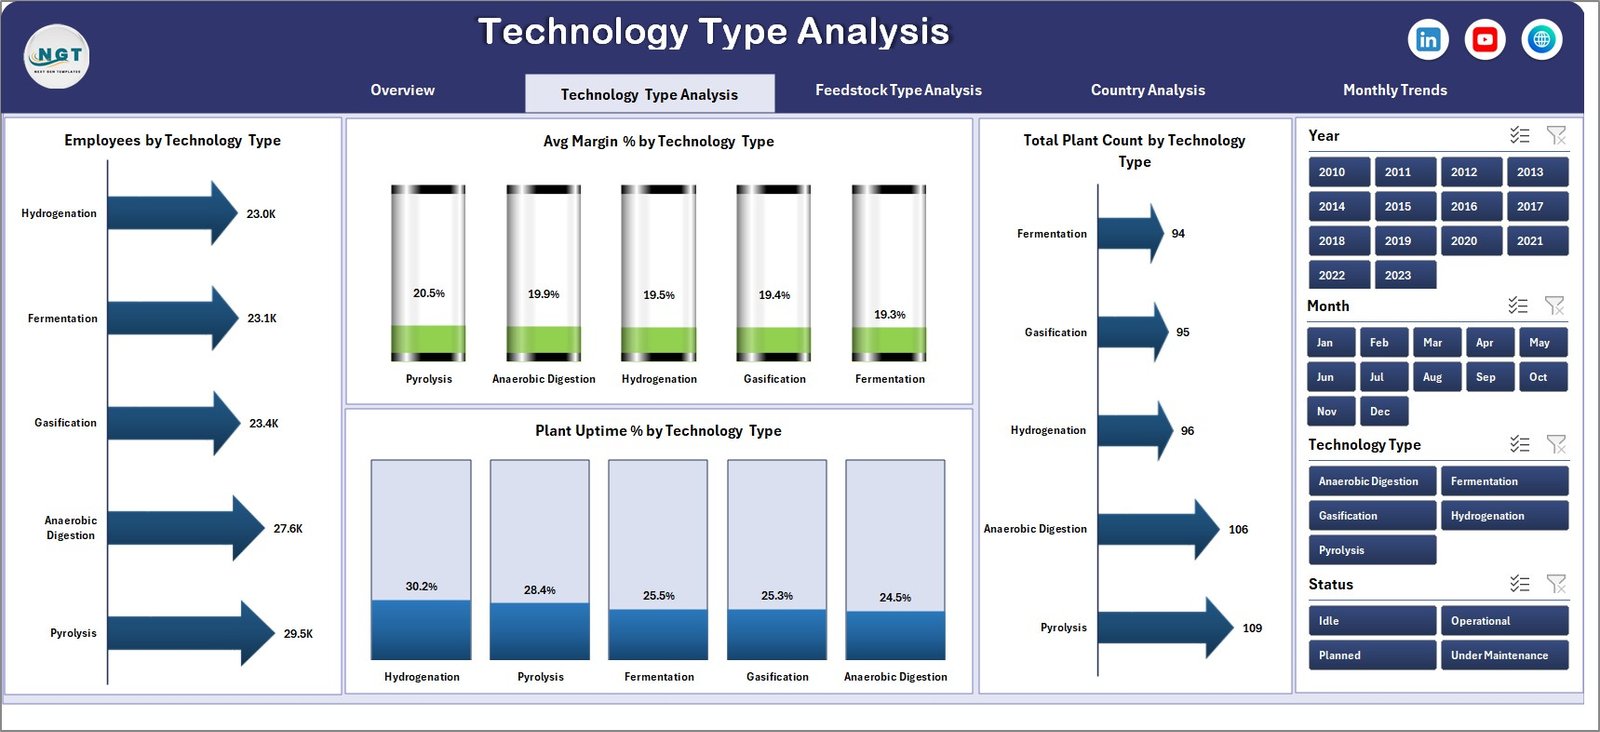
The Technology Type Analysis Page focuses on evaluating plant performance based on technology.
Click to Purchases Biofuel Plants Dashboard in Excel
Key Insights:
-
Employee Count by Technology Type
-
Average Margin % by Technology Type
-
Total Plant Count by Technology Type
-
Plant Uptime % by Technology Type
👉 Therefore, you can identify which technology performs best and where improvements are needed.
🌾 What Insights Do You Get from Feedstock Type Analysis?
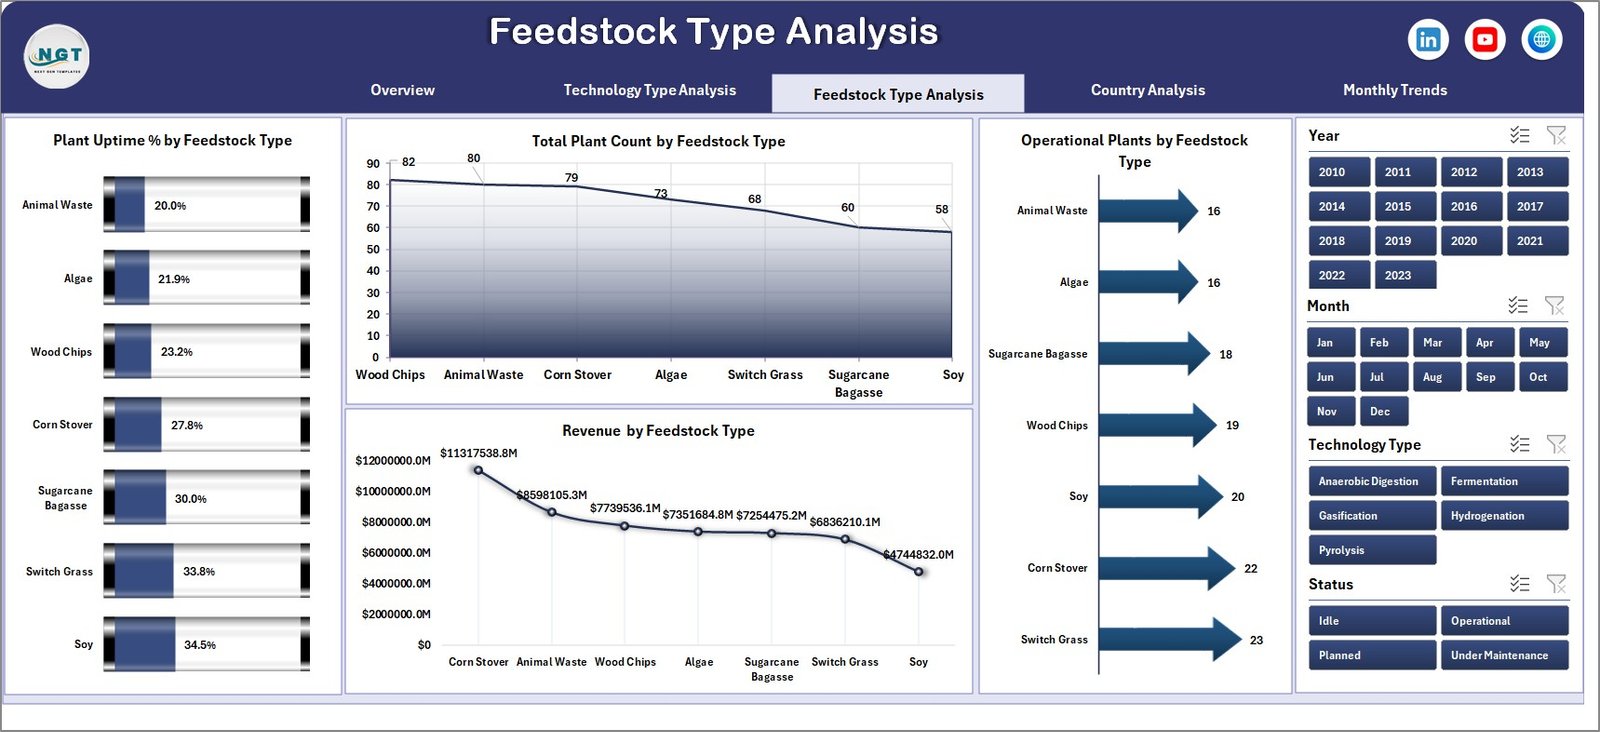
Feedstock plays a critical role in biofuel production. Therefore, analyzing it properly becomes essential.
Key Metrics:
-
Plant Uptime % by Feedstock Type
-
Total Plant Count by Feedstock Type
-
Operating Plants by Feedstock Type
-
Revenue by Feedstock Type
👉 As a result, you can optimize feedstock selection and improve production efficiency.
Click to Purchases Biofuel Plants Dashboard in Excel
🌍 How Does Country Analysis Improve Decision-Making?
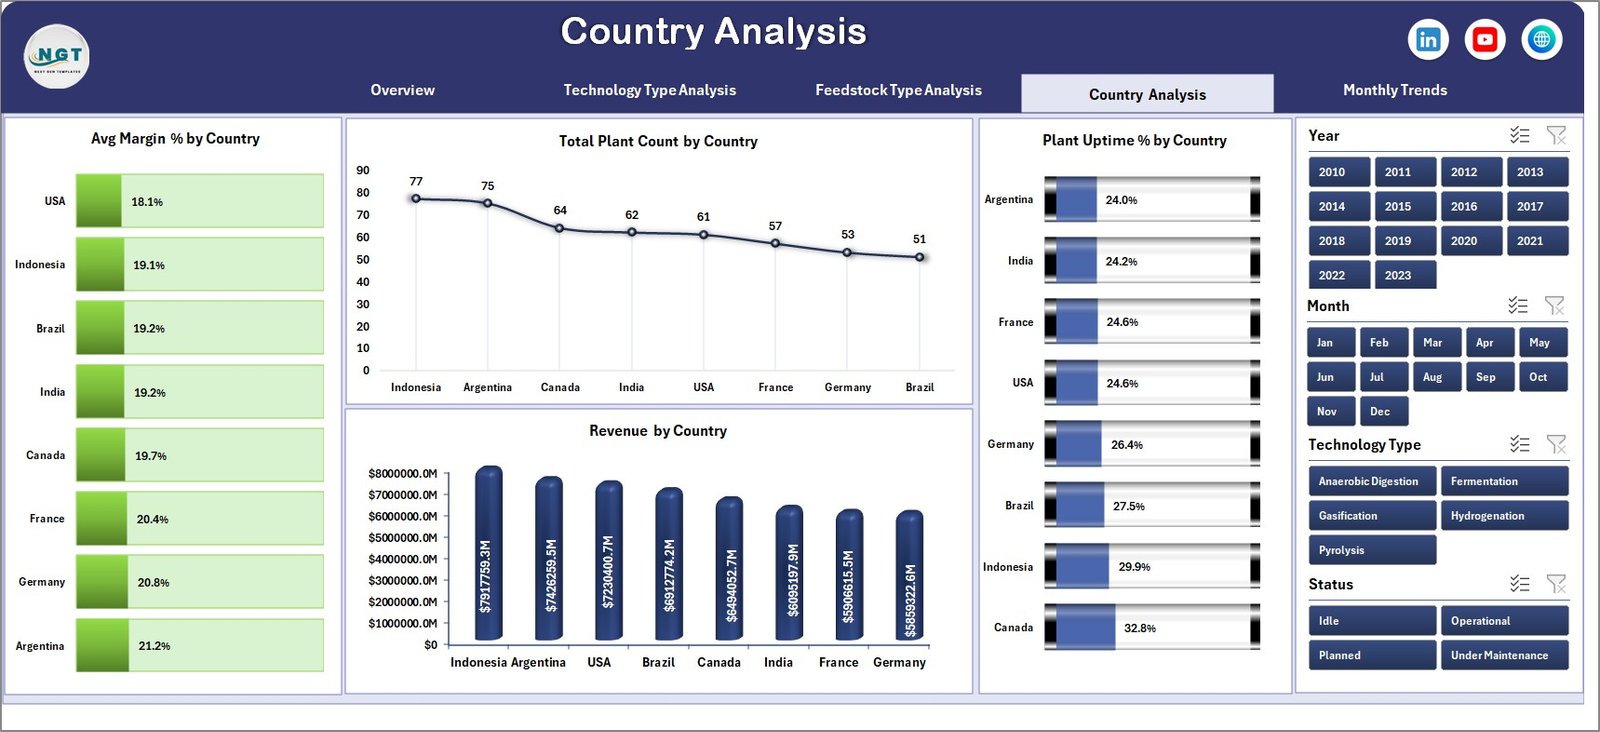
The Country Analysis Page helps you evaluate performance across different regions.
Key Insights:
-
Average Margin % by Country
-
Total Plant Count by Country
-
Plant Uptime % by Country
-
Revenue by Country
👉 Therefore, you can compare regional performance and plan expansion strategies effectively.
📅 Why is Month Analysis Important?
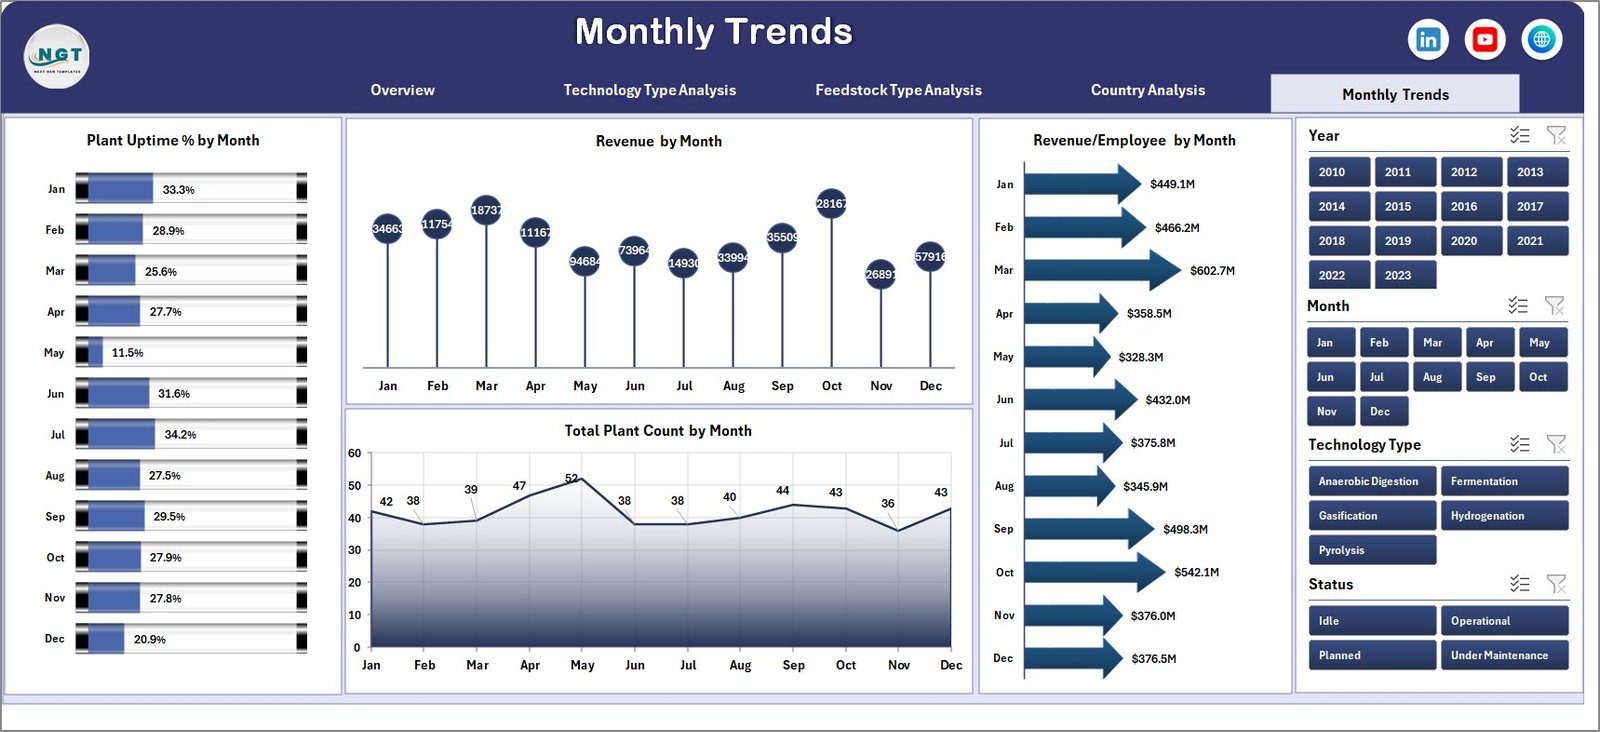
Tracking monthly trends helps you understand performance over time.
Key Metrics:
-
Plant Uptime % by Month
-
Revenue by Month
-
Revenue per Employee by Month
-
Total Plant Count by Month
👉 As a result, you can identify seasonal trends and improve forecasting.
🎯 Advantages of Biofuel Plants Dashboard in Excel
Using this dashboard offers multiple benefits. Moreover, it improves both operational and financial performance.
✅ Key Advantages:
-
📊 Centralized Data Management
You manage all plant data in one place, which reduces confusion. -
⚡ Faster Decision-Making
You access insights instantly, so you act quickly. -
📉 Improved Performance Monitoring
You track uptime, revenue, and margins in real time. -
🌍 Better Regional Insights
You compare countries and optimize expansion plans. -
🔍 Enhanced Data Visibility
You identify trends, patterns, and inefficiencies easily. -
💰 Profitability Optimization
You focus on high-performing technologies and feedstocks.
⚠️ Opportunities for Improvement in Biofuel Dashboard
Although the dashboard is powerful, you can still enhance it further.
🔧 Areas to Improve:
-
Add real-time data integration using Power Query
-
Include predictive analytics for future trends
-
Enhance visuals with advanced charts
-
Add alerts for low uptime or margin drops
-
Integrate with Power BI for deeper insights
👉 Therefore, continuous improvement ensures long-term value.
Click to Purchases Biofuel Plants Dashboard in Excel
🧠 Best Practices for the Biofuel Plants Dashboard in Excel
To get maximum value from this dashboard, you should follow best practices.
✅ Best Practices:
-
📌 Keep Data Updated Regularly
Always refresh your data to ensure accuracy. -
📊 Use Consistent Data Formats
Maintain uniform formats for easy analysis. -
🔍 Focus on Key KPIs
Avoid clutter and track only important metrics. -
⚙️ Automate Data Loading
Use Power Query to reduce manual work. -
📈 Customize Based on Needs
Modify charts and metrics according to your business. -
🔒 Ensure Data Security
Protect sensitive financial and operational data.
👉 As a result, you improve both usability and efficiency.
📌 Who Can Benefit from This Dashboard?
This dashboard is useful for multiple professionals and industries.
👥 Ideal Users:
-
Biofuel plant managers
-
Renewable energy analysts
-
Operations teams
-
Financial analysts
-
Energy consultants
-
Business owners
👉 Therefore, anyone involved in biofuel operations can benefit from it.
🛠️ How to Use the Biofuel Dashboard Effectively?
Using this dashboard is simple. However, following a structured approach gives better results.
Step-by-Step Guide:
-
Import your plant data into Excel
-
Update the data tables
-
Refresh the dashboard
-
Use slicers to filter data
-
Analyze charts and KPIs
-
Take data-driven actions
👉 As a result, you make smarter and faster decisions.
📊 What KPIs Should You Track in Biofuel Plants?
Click to Purchases Biofuel Plants Dashboard in Excel
Tracking the right KPIs ensures better performance management.
Important KPIs:
-
Plant Uptime %
-
Revenue
-
Average Margin %
-
Revenue per Employee
-
Total Plant Count
-
Operating Plants
👉 Therefore, focusing on these KPIs improves efficiency and profitability.
🔮 Future of Biofuel Analytics in Excel
Excel dashboards continue to evolve. Moreover, they integrate with modern tools for better analytics.
Future Trends:
-
AI-based insights
-
Automated reporting
-
Cloud-based dashboards
-
Integration with IoT systems
-
Real-time monitoring
👉 Therefore, adopting dashboards now prepares you for the future.
🏁 Conclusion
The Biofuel Plants Dashboard in Excel is a powerful solution for managing and analyzing biofuel operations. It simplifies complex data, improves visibility, and supports faster decision-making.
Moreover, it helps you track performance, optimize resources, and increase profitability.
If you want to transform your biofuel plant operations, this dashboard is the perfect tool to start with.
❓ Frequently Asked Questions (FAQs)
1. What is a Biofuel Plants Dashboard in Excel?
It is an interactive Excel tool that helps you monitor and analyze biofuel plant performance, revenue, and efficiency.
2. Who should use this dashboard?
Plant managers, analysts, and renewable energy professionals can use it to track and improve performance.
3. Can I customize this dashboard?
Yes, you can modify charts, KPIs, and layouts based on your business needs.
4. Does this dashboard support real-time data?
By default, it uses static data. However, you can integrate Power Query for automation.
5. What are the main KPIs in this dashboard?
Key KPIs include Plant Uptime %, Revenue, Average Margin %, and Total Plant Count.
6. Is Excel enough for biofuel analytics?
Yes, Excel works well for most use cases. However, you can integrate Power BI for advanced analytics.
7. How often should I update the dashboard?
You should update it regularly—daily, weekly, or monthly—depending on your data.
8. Can small businesses use this dashboard?
Absolutely! It is suitable for both small and large biofuel operations.
Visit our YouTube channel to learn step-by-step video tutorials